http://www.scirp.org/journal/jbm ISSN Online: 2327-509X
ISSN Print: 2327-5081
A New Method to Digitize DNA Sequence
Xiaofei Xu, Feng Zhu
*School of Pharmaceutical Sciences, Chongqing University, Chongqing, China
Abstract
The global description uses composition, transition and distribution to de-scribe an amino acid sequence and has been widely adopted in various fields. Here we integrate it with properties of nucleic acid and form a new method to digitize DNA sequence. Through this method we can use a 39-dimession vec-tor to represent a DNA sequence. We use the exon-1 of β-Globin genes of eight species to verify this method and compare with other methods. A similar result with other method proves that this method is persuading. This method provides a new strategy to digitize DNA sequence and generates DNA se-quence descriptor vector. It is different from other methods and this method only produces a 39-dimession vector and not depends on the length of DNA sequence.
Keywords
DNA Sequence, Characteristic Sequence, Global Description, Digitize DNA
1. Introduction
As the sequencing method is widely used in various researches the stupendous DNA sequence data is producing. The 1000 genomes project [1] have reported completion of the project, having reconstructed the genomes of 2504 individuals from 26 populations using a combination of low-coverage whole-genome se-quencing, deep exome sese-quencing, and dense microarray genotyping. It’s ur-gently necessary to analyze these data with the mathematical method rapidly and accurately.
In order to generate the mathematical descriptor how to characterize DNA sequence is the most important work. In the earlier study many methods have been proposed to characterize DNA sequence. Graphical representation [2] was adopted by the majority of reported methods. In graphical representations it is believed that sequence character can be quickly obtained by corresponded plot of DNA sequence. With this theory researchers developed various techniques for
How to cite this paper: Xu, X.F. and Zhu, F. (2017) A New Method to Digitize DNA Sequence. Journal of Biosciences and Me-dicines, 5, 7-12.
https://doi.org/10.4236/jbm.2017.53002
plotting the DNA sequence, such as 2-D, 3-D, 4-D and other graphical repre-sentations. 2D method is the mainly adopted form of graphical methods. Gates [3] used the four cardinal directions to represent A, T, C and G and a DNA se-quence can be plot points on the graph. In Nandy’s method [4], if the base was an adenine the graph will be added one step in the negative x-direction and gua-nine, cytosine and thymine are separated represented by one step in positive x- direction, positive y-direction and negative y-direction. The Gates method [3] and Lenong Morgenthaler method [5] prescribed the GTCA and CTAG reading clockwise. The 2-D method have already been used in various researches by Nandy [4] [6] [7], Raychaudhury and Nandy [4], Nandy and Basak [8], Wu, Liew, Yan, and Yang [9], Yao, Nan and Wang [10] and Ghosh, Roy, Adhya and Nandy [11]. But almost all of these methods produced overlapping paths that caused degeneracy.
In order to avoid or diminish, researchers proposed some mutated methods. He and Wang [12] introduced a no degeneracy method. In their method the four bases were divided into different groups by purine-pyrimidine, amino-keto, weak H-bond-strong H-bond. And they prove that a DNA primary sequence is uniquely determined by any pair of its three characteristic sequences.
The global description of amino acid sequence [13] has been widely used in various fields. It uses three descriptors composition, transition and distribution that are deprived for the physicochemical properties to generate the sequence descriptors.
In this work we integrate the characteristic sequence and the global descrip-tion. First we characterize DNA primary sequence with three characteristic se-quences. Then according to the global description method a 39-dimission de-scriptors are produced from the three characteristic sequences. Finally we com-pare this method with other methods and verify this method.
2. Materials and Methods
2.1. The Method to Generate the Characteristic Sequences
He and Wang [12] developed method that can produce characteristic sequences for DNA primary sequence with different properties. As we know the four-base can be divide into different group with different chemical structures. In He and Wang’s work they proposed three properties that is purine and pyrimidine, amino and keto and weak H-bond and strong H-bond. First it can be divided into purine R = {A, G} and pyrimidine Y = {C, T}. And then considering the amino and keto the four bases are divided into amino group M = {A, C} and ke-to group K = {G, T}. At last the strength of the hydrogen bond that is weak H- bonds W = {A, T} and strong H-bonds S = {G, C} also can be the classification standard.
Table 1. Transform human L1 putative promoter sequence into three characteristic sequence.
DNA sequence
GGGAGGAGGAGCCAAGATGGCCGAATAGGAACAGCTCCGG
TCTACAGCTCCCAGCGTGAGCGACGCAGAAGACGGGTGATTTCTGCATTTCCATCTGAGG
(R,Y)-Characteristic sequence
0000000000011000010011000100000100111100111010011111001010001001010000001000100111110101111101110000
(M,K)-Characteristic sequence
1110110110100001011100100101100001010011101000101000010111010100100100100111110111011001110001011011
(W,S)-Characteristic sequence
1110110110111001001111100001100101101111010010110111011101011101110100101111010000101100001100101011
2.2. The Global Descriptors for DNA Sequence
The global descriptor was first proposed for amino acid sequence [13]. It used three descriptors: composition, transition, and distribution to describe the global composition, the frequencies of property changes and the distribution pattern of the property of a given amino acid sequence respectively. The composition (C) is the number of amino acids of a particular property divided by the count of the bases in a protein sequence. In this work n0,n1
N N
C=
where n0, n1 and N is
the number of 0, 1 and total number of the characteristic sequence. Transition (T) characterizes the frequency with which a property is followed by a different property. T = (t01, 10) and the t01, 10 represents the transition from 0 to 1 and 1 to 0. Distribution (D) calculates the first, 25%, 50%, 75%, and 100% of each property of a characteristic sequence. P0,P25,P50,P75,P100
N N N N N
D=
. P0 and P100 is the lo-
cation of the first and last property in the characteristic sequence. There are 13 elements in all: 2 for C, 1 for T and 10 for D. According the above method Table 2 lists the corresponded descriptors.
3. Method Validation
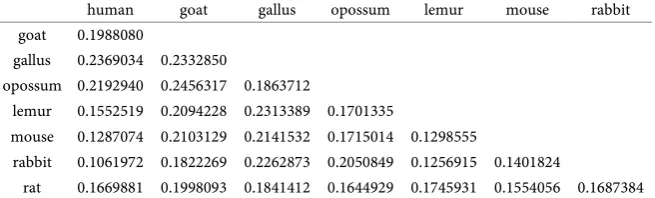
In this section, a 39-dimension vector is constructed consisting of all the de-scriptors in the three characteristic sequences for the exon-1 of β-Globin genes of eight species in Table 3. Using these vectors we analyze the relationship for the eight sequences. If two sequences are similar their vectors will be close to each other in the 24 dimensions space.
Table 2. All the 13 descriptors for each characteristic sequence.
DNA sequence:
GGGAGGAGGAGCCAAGATGGCCGAATAGGAACAGCTCC
GGTCTACAGCTCCCAGCGTGAGCGACGCAGAAGACGGGTGATTTCTGCATTTCCATCTGAGG Descriptors of (R,Y)-Characteristic sequence:
C = (0.59000,0.41000,0.20000) T = (0.01000)
D = (0.16000,0.40000,0.69000,1.00000,0.12000,0.37000,0.52000,0.82000,0.96000) Descriptors of (M,K)-Characteristic sequence:
C = (0.49000,0.51000,0.28000) T = (0.04000)
D = (0.25000,0.46000,0.67000,0.98000,0.01000,0.20000,0.54000,0.78000,1.00000) Descriptors of (W,S)-Characteristic sequence:
C = (0.42000,0.58000,0.27000) T = (0.04000,0.26000,0.53000)
[image:4.595.65.551.98.757.2]D = (0.80000,0.98000,0.01000,0.21000,0.48000,0.68000,1.00000)
Table 3. Exon-1 of the of β-Globin genes of eight species.
human β-globin 92 bases:
ATGGTGCACCTGACTCCTGAGGAGAAGTCTGCCGTTACTGCCC TGTGGGGCAAGGTGAACGTGGAGTAAGTTGGTGGTGAGGCCCTGGGCAG
goat β-globin 86 bases:
ATGCTGACTGCTGAGGAGAAGGCTGCCGTCACCGGCTTCT GGGGCAAGGTGAAAGTGGATGAAGTTGGTGCTGAGGCCCTGGGCAG
gallus β-globin 92 bases:
ATGGTGCACTGGACTGCTGAGGAGAAGCAGCTCATCACCGGCCTC TGGGGCAAGGTCAATGTGGCCGAATGTGGGGCCGAAGCCCTGGCCAG
opossum β-hemoglobin 92 bases:
ATGGTGCACTTGACTTCTGAGGAGAAGAACTGCATCACTACC ATCTGGTCTAAGGTGCAGGTTGACCAGACTGGTGGTGAGGCCCTTGGCAG
lemur β-globin 92 bases:
ATGACTTTGCTGAGTGCTGAGGAGAATGCTCATGTCACCTCTCTGT GGGGCAAGGTGGATGTAGAGAAAGTTGGTGGCGAGGCCTTGGGCAG
mouse β-globin 94 bases:
ATGGTTGCACCTGACTGATGCTGAGAAGTCTGCTGTCTCTTGCCTGT GGGCAAAGGTGAACCCCGATGAAGTTGGTGGTGAGGCCCTGGGCAGG
rabbit β-globin 90 bases:
ATGGTGCATCTGTCCAGTGAGGAGAAGTCTGCGGTCACTGCCCTGT GGGGCAAGGTGAATGTGGAAGAAGTTGGTGGTGAGGCCCTGGGC
rat β-globin 92 bases:
[image:4.595.212.540.636.735.2]ATGGTGCACCTAACTGATGCTGAGAAGGCTACTGTTAGTGGCCTGT GGGGAAAGGTGAACCCTGATAATGTTGGCGCTGAGGCCCTGGGCAG
Table 4. The euclidean distance of the sequence in Table 3.
human goat gallus opossum lemur mouse rabbit goat 0.1988080
gallus 0.2369034 0.2332850
opossum 0.2192940 0.2456317 0.1863712
lemur 0.1552519 0.2094228 0.2313389 0.1701335
mouse 0.1287074 0.2103129 0.2141532 0.1715014 0.1298555
rabbit 0.1061972 0.1822269 0.2262873 0.2050849 0.1256915 0.1401824
4. Results and Discussion
In this work we combine characteristic sequence with global descriptors and form a new method to generate a 39 demission vector for DNA sequence. We also compare our method with other strategies and the similar results are given. The global descriptor has been widely adopted in protein sequence and we first introduce it into DNA sequence. For protein sequence various properties are used to divide the 20 amino acids into different groups. Such as: hydrophobicity, polarity, polarizibility, charge, secondary structures and Van der Waals volume. How many properties does it need at least if we plan to uniquely represent a protein sequence or a DNA sequence. As above three properties is enough to uniquely represent a DNA sequence at least. But protein sequence will need more properties and the way choosing useful property is the key work for pro-tein sequence. Our method has enumerated all the possible characteristic se-quence and can uniquely characterize a DNA sese-quence. We only introduce the global descriptor into DNA sequence directly and do not alter the way to pro-duce vector. We think it is necessary to make the effort to modify the global de-scriptor method and make it more suitable for DNA sequence.
Acknowledgements
This work was funded by the research support of National Natural Science Foun-dation of China (81202459, 21505009 and 21302102); by Innovation Project on Industrial Generic Key Technologies of Chongqing (cstc2015zdcy-ztzx120003); by the Chongqing Graduate Student Research Innovation Project (CYB14027); by the Fundamental Research Funds for the Central Universities (CDJZR14468801, CDJKXB14011, 2015CDJXY).
References
[1] Genomes Project Consortium, Auton, A., Brooks, L.D., Durbin, R.M., Garrison, E.P., Kang, H.M., Korbel, J.O., Marchini, J.L., McCarthy, S., McVean, G.A., et al. (2015) A Global Reference for Human Genetic Variation. Nature, 526, 68-74. https://doi.org/10.1038/nature15393
[2] Roy, A., Raychaudhury, C. and Nandy, A. (1998) Novel Techniques of Graphical Representation and Analysis of DNA Sequences—A Review. J Biosciences, 23, 55- 71. https://doi.org/10.1007/BF02728525
[3] Gates, M.A. (1986) A Simple Way To Look at DNA. J Theor Biol, 119, 319-328. https://doi.org/10.1016/S0022-5193(86)80144-8
[4] Raychaudhury, C. and Nandy, A. (1999) Indexing Scheme and Similarity Measures for Macromolecular Sequences. J Chem Inf Comp Sci, 39, 243-247.
https://doi.org/10.1021/ci980077v
[5] Leong, P.M. and Morgenthaler, S. (1995) Random Walk and Gap Plots of DNA Se-quences. Computer Applications in the Biosciences: CABIOS, 11, 503-507. [6] Nandy, A. (1996) Two-Dimensional Graphical Representation of DNA Sequences
Gene Sequences. Internet Electron J Mol Des, 1, 545-558.
[8] Nandy, A. and Basak, S.C. (2000) Simple Numerical Descriptor for Quantifying Ef-fect of Toxic Substances on DNA Sequences. J Chem Inf Comp Sci, 40, 915-919. https://doi.org/10.1021/ci990117a
[9] Wu, Y., Liew, A.W.-C., Yan, H. and Yang, M. (2003) DB-Curve: A Novel 2D Me-thod of DNA Sequence Visualization and Representation. Chemical Physics Letters, 367, 170-176. https://doi.org/10.1016/S0009-2614(02)01684-6
[10] Yao, Y.-H., Nan, X.-Y. and Wang, T.-M. (2006) A New 2D Graphical Representa-tion—Classification Curve and the Analysis of Similarity/Dissimilarity of DNA Se-quences. Journal of Molecular Structure: THEOCHEM, 764, 101-108.
https://doi.org/10.1016/j.theochem.2006.02.007
[11] Ghosh, S., Roy, A., Adhya, S. and Nandy, A. (2003) Identification of New Genes in Human Chromosome 3 Contig 7 by Graphical Representation Technique. Current Science-Bangalore, 84, 1534-1543.
[12] He, P.A. and Wang, J. (2002) Characteristic Sequences for DNA Primary Sequence. J Chem Inf Comput Sci, 42, 1080-1085. https://doi.org/10.1021/ci010131z
[13] Dubchak, I., Muchnik, I., Holbrook, S.R. and Kim, S.-H. (1995) Prediction of Pro-tein Folding Class Using Global Description of Amino Acid Sequence. Proceedings of the National Academy of Sciences, 92, 8700-8704.
https://doi.org/10.1073/pnas.92.19.8700
[14] Randić, M. (2000) On Characterization of DNA Primary Sequences by a Condensed Matrix. Chemical Physics Letters, 317, 29-34.
https://doi.org/10.1016/S0009-2614(99)01321-4
[15] Hamori, E. and Ruskin, J. (1983) H Curves, a Novel Method of Representation of Nucleotide Series Especially Suited for Long DNA Sequences. Journal of Biological Chemistry, 258, 1318-1327.
Submit or recommend next manuscript to SCIRP and we will provide best service for you:
Accepting pre-submission inquiries through Email, Facebook, LinkedIn, Twitter, etc. A wide selection of journals (inclusive of 9 subjects, more than 200 journals)
Providing 24-hour high-quality service User-friendly online submission system Fair and swift peer-review system
Efficient typesetting and proofreading procedure
Display of the result of downloads and visits, as well as the number of cited articles Maximum dissemination of your research work