Wireless Sensor Network, 2010, 2, 243-249
doi:10.4236/wsn.2010.23033 Published Online March 2010 (http://www.scirp.org/journal/wsn)
QPSK DS-CDMA System over Rayleigh Channel with a
Randomly-Varying Frequency Narrow-Band
Interference: Frequency Tracking Analysis
Aloys N. Mvuma
School of Informatics, University of Dodoma, Dodoma, Tanzania E-mail:{anmvuma, mvuma}@udom.ac.tz
ReceivedAugust 25, 2009; revised September 7, 2009; accepted September 21, 2009
Abstract
This paper analyses frequency tracking characteristics of a complex-coefficient adaptive infinite-impulse response (IIR) notch filter used for suppression of narrow-band interference (NBI) with a randomly-varying frequency in a quadriphase shift keying (QPSK) modulated direct-sequence code-division multiple-access (DS-CDMA) communication system. The QPSK DS-CDMA signals are transmitted over a frequency non-selective Rayleigh fading channel. The analysis is based on a first-order real-coefficient difference equa-tion with respect to steady-state instantaneous frequency tracking error from which a closed-form expression that relates frequency tracking mean square error (MSE) with number of DS-CDMA active users and NBI power is obtained. Closed-form expressions for optimum notch bandwidth coefficient and step size constant that minimize the frequency tracking MSE are also derived. Computer simulations are included to substanti-ate the accuracy of the analyses.
Keywords: Code-Division Multiple Access (CDMA), Quadriphase Shift Keying (QPSK), Complex Adaptive IIR Notch Filter, Narrow-Band Interference (NBI), Frequency Tracking MSE
1. Introduction
Direct-sequence code-division multiple-access (DS-CDMA) is a preferred multiplexing technique in cellular tele-communications services as it exhibits desired features that are not inherently found in other multiple access techniques, i.e., time-division multiple-access (TDMA) and frequency-division multiple-access (FDMA). Some of superior DS-CDMA features include robustness in multipath fading environment, flexibility in allocation of channels and increased spectral efficiency due to its ca-pability of sharing bandwidth with narrow-band commu-nication systems [1–3]. The bandwidth sharing capability is made possible by the inherent narrow-band interfer-ence (NBI) suppression capacity of DS-CDMA due to the processing gain of spread spectrum systems. How-ever, for high levels of NBI power, the NBI suppression capacity of DS-CDMA system can be enhanced by means of signal processing techniques at the receiver. Several methods with varying complexities have been proposed for suppression of NBI in DS-CDMA commu-nication systems [4–9].
In [10], a complex coefficient adaptive notch filter implemented as a constrained infinite-impulse response (IIR) filter with a complex Gauss-Newton adaptation algorithm was proposed. Its application in the suppres-sion of NBI in quadriphase shift keying (QPSK) di-rect-sequence spread-spectrum (DSSS) communication system was shown to result in a better signal-to-noise ratio (SNR) improvement factor than that achieved by finite-impulse response (FIR) adaptive prediction filter. In [11] a complex coefficient adaptive IIR notch filter with a simplified gradient-based algorithm that does not require any matrix inversion was presented. Analyses of its convergence, steady-state and tracking characteristics were presented in [12–15], respectively. Its application in suppression of NBI in QPSK-DSSS system with fixed unknown frequency was introduced in [13].
i s t
I i t b
I i
c t cos 2
c P f t
I i
s t w t
i t
icient difference equation with respect to steady-state instantaneous frequency tracking error from which a closed-form expression for frequency tracking mean square error (MSE) is obtained. In addition, closed-form expressions for optimum notch bandwidth coefficient and step size constant are also derived. Computer simu-lations are included to substantiate accuracy of the analyses.
This paper is organized as follows. Section 2 presents the system model. Complex coefficient adaptive IIR not- ch filter is presented in Section 3 whereas frequency trac- king is analyzed in Section 4. In Section 5 simulations are presented and discussed before a conclusion in Section 6.
2. System Model
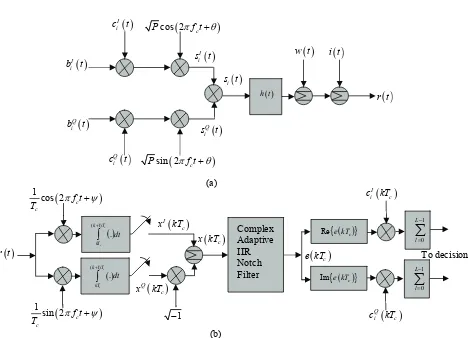
We consider a synchronous DS-CDMA system over frequency-nonselective Rayleigh fading channel using QPSK modulation, quaternary pseudo-noise (PN) spr- eading m-sequences and the rectangular chip waveform. It is assumed that there are K simultaneously transmit-ting users. Referring to Figure 1, the transmitted signal for the i-th users ti
Ki1 is expressed as
cos
sin
I I
i i i c
Q Q
i i c
s t Pb t c t t Pb t c t t
(1)
where:
P is the power of the transmitted signal.
I i
b t and Q
ib t are in-phase and quadrature-phase binary data signals, respectively.
I i
c t and Q
ic t are in-phase and quadrature-phase PN spectrum spreading signals, respectively.
c
and are the modulator carrier frequency and phase, respectively.
We define the rectangular pulse with duration as
T p t T
1, 00, elsewhere T
t T p t
(2)
Therefore the in-phase and quadrature-phase data and spectrum spreading signals are expressed as
, s
,I I
i i j T
j
b t b p t jT
s (3)
r t
Q i b t
Q i
c t Psin 2
f tc
Q i s t
1
sin 2 c c
f t
T
1 cos 2
c c
f t
T
Q i Tc c k
I c kTi c
1
r t
c x kT
I c x kT
Q c x kT
[image:2.595.63.536.362.700.2]
c e kTFigure 1. QPSK DS-CDMA communications system model. (a) Transmitter; (b) Receiver.
h t
(a)
1
0
L
l
Complex Adaptive IIR Notch Filter
( 1)
.
c c
k T
kT
dt
Re
e kT c
To decision
( 1)
.
c
c
k T
kT
dt
10
L
l
Im e kTc
A. N. Mvuma 245
s
c
c
, s
Q Q
i i j T
j
b t b p t jT
(4)
, c
,I I
i i j T
j
c t c p t jT
(5)
, c
Q Q
i i j T
j
c t c p t jT
(6)where
, 1, 1
I i j
b and are identically and
independently distributed (IID) random j-th data bits of the i-th user for the in-phase and quadrature-phase components.
, 1, 1
Q i j
b
, 1, 1
I i j
c and Q,
1, 1
i j
c are IID random
j-th chips for the i-th user for the in-phase and quad-rature-phase components, respectively.
c
T and Ts are the chip duration and the symbol du-ration, respectively, where is the number of chips per symbol or processing gain.
/
s c T T L
The QPSK DS-CDMA signal comprising of signals for all K active users is transmitted over a frequency non-selective Rayleigh fading channel with impulse re-sponse given by
exp
h t j t (7) where is the phase shift with uniform PDF over
0, 2
, is the time delay which is uniformly dis-tributed over
0, Ts
and is the Rayleigh distrib-uted attenuation having a probability density function (PDF) expressed as
2
exp , 0, 2
0, 0. A
f
(8)
The transmitted signal is corrupted with a zero-mean additive white Gaussian noise (AWGN) w t
0/ 2
N
with two-sided power spectral density (PSD) and a NBI modeled as
2 cos
c
I t J t t (9)
where J is the power of the interference and
t is the instantaneous phase deviation.The received signal at the input of the correla-tor bank in Figure 1 is expressed as
r t
1
K i i
r t s t w t I t
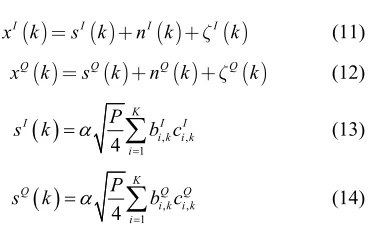
(10)At time kTc the samples I
c( )
( )
( )
( )
I I I I
x k =s k +n k +z k (11)
( )
( )
( )
( )
Q Q Q Q
x k =s k +n k +z k (12)
, ,1
4 K
I I I
i k i k i
P
s k b
c (13)
, ,1
4 K Q
i k i k i
P Q Q
s k b
c (14)where
, 1, 1
I i k
b and Q,
1, 1i k
b
are the values ofdata signals at the k-th sampling instant of the i-th user for the in-phase and quadrature-phase components.
, 1, 1
I i k
c and ci kQ,
1, 1
are the values ofthe spectrum spreading signals at the k-th sampling instant for the i-th user for the in-phase and quadra-ture-phase components, respectively.
I
n k and n kQ
are independent and uncorrelated random processes with zero mean and variance2
4
N 0
c T .
Assuming
t to be varying slowly such that it is constant over one chip interval, then NBI components
I k
and Q
k in (11) and (12) are expressed as
cos
2
I k J
k (15)
sin
2
Q k J
k (16)
It can easily be shown that s kI
and sQ
k are zero-mean uncorrelated random processes each withvariance 2 2
4 s
P
E K
.
3. Complex Coefficient Adaptive IIR Notch
Filter
Using complex notation, a complex input signal to a complex coefficient adaptive IIR notch filter in Figure 1
is of the form
( ) ( ),
x k s k k n k (17) where
I
Q
s k s k js k (18)
exp
2
J
k j
x kT and Q
c x kTc T
[image:3.595.356.540.87.201.2]in
Figure 1 can be written as (for simplicity, is nor-malized to unity)
k
(19)
( )k (k 1) ( ),k
( ) I( ) Q( ).
n k n k jn k (21) ( )k
is the instantaneous frequency that follows a
random walk model and is expressed as
0
( )k (k 1) ( ), (0)k
(22) where
k is a zero-mean white noise with variance2
v
, is the scaling factor for the frequency drift and is assumed to be small, i.e., 1 and 0 is the
ini-tial frequency.
Transfer function of first-order complex coefficient IIR notch filter for suppression of the NBI in (17) is given by [11].
1
1
( ) 1
0
( ) 1
0 1 1 ( ) 2 1 j k j k e z H z e z
(23)
where 0 is the notch bandwidth coefficient and 1 is the notch frequency coefficient. Adaptation algorithm used here to estimate the instantaneous frequency of the NBI is expressed as [11].
* 1(k 1) 1( )k Re ( ) ( )e k
k . (24)
Re[.] denotes real number and * denotes complex conju-gate. Here is the step size constant, is the complex notch filter output and
e k( )k
is the gradient signal. Referring to (23), the instantaneous frequency can be estimated by ˆ
k where1
ˆ ( )k ( ).k
(25) Transfer function from the input ( )x k to the gradient signal ( ) k in (24) is given by [11].
1
1
( ) 1
0
( ) 1
0 1 ( ) . 2 1 j k j k je z G z e z
(26)
4. Frequency Tracking Error Analysis
In this section, frequency tracking error of the algorithm in (24) is analyzed. We define steady-state tracking error of instantaneous frequency ( ) k as [14], [15].
ˆ
( )k ( )k ( ).k
(27) Referring to the coefficient adaptation algorithm in (24), it follows from (27) that [15]:
*
(k 1) ( )k ( )k Re[ ( ) ( )],e k
k (28) A first-order difference equation with respect to ( ) k is
and
obtained by using approximations for steady-state signals ( )
e k ( ) k derived in [14], and is expressed by
0 2
0
1
( 1) 1 ( ) ( ),
24 1
J
k k k
k is
(29)
where the input to the difference equation given by
( ( ) ) * ( ( )
2 2
1
( )k J n k e( ) j k n k e( ) j k
)
* *
2 4
1 ( )
( ) ( ) ( ) ( ) 2
e e
e e
k n k n k n k n k
(30)
Here n ke
and n k
are the output of H z
and
G z , respectively, due to s k
n k . By g to function referrinr (29), a first-order real coefficient transfe
F z between the input
k and the output
kis given by
1 1 2 ( ) 1 1 2 4 z F z J z
. (31)
4.1. Square of Tracking Error Due to Frequency Drift
ro the frequency drift is found to be given by By referring to (29), (30) and (31), square of tracking
r due to er
2 2 2 2
2 2 1 1
1
2
1 ( ) ( ) 2 .
2
v v j F z F z z dz J
(32)(32) is obtained by assuming that 4 2
2
J
w
means the step-size parameter is sufficiently small.
um hich
4.2. Frequency Tracking Mean Square Error
Frequency tracking mean square error (MSE) is the s f 2
o 1 in (32) and frequency error variance 2 2
due to ( )
e
n k and n k( ). 2 2
is obtained by [12,14].
2 0 2 3
0
(1 ) 2 2 c
N
J PK
T 2 2 2 0 0 2
16(1 ) (1 )(1 )
E
, (33)
2 1 1 2 4 J ,
The following observations are made f 1) Frequency tracking error varia
(34)
rom (33) and (34): nce is directly pro-portional to the NBI power J.
2) For small AWGN PSD N0 frequency tracking error variance is directly o the signal transmit power P and num
proportional t ber of active users K.
A. N. Mvuma 247
notch bandwidth coefficient 0.
4) Frequency tracking error variance varies propor-tionally with the square of step-size constant.
From (32), (33) and (34), the closed-form expression for the frequency tracking MSE can be expressed as
2 0 2
2 2 2 2 2 2
2
2 v c
N P
E K
T
MSE 3
32
J
J
. (35)
4.3. Optimum Step Size and Notch Bandwidth Coefficients
From (35), the optimum step-size opt that corresponds by ct to
to minimum frequency tracking MSE is derived equating the first derivative of MSE in (35) with respe
to zero. This yield:
1 3
2 2 5
2
4
2 v .
opt
N
J E
(36)
2 0
2 2 2 c PK
T
Similarly, equating to zero the first derivative of MSE in (35) with respect to
we obtain:0
1 . 1
opt opt
opt
(37)
where:
1
2 5
2 0 3
2 2
3
2 2 2Tc
(38)
1
2 4
opt
v
N
J P
E K
5. Simulation and Discussions
In this section, computer simulation results are compared with analytical values obtained in (35), (36), (37) and (38)
substantiate the accuracy of the proposed analytical tained by
averag-or to
to
method. All simulated results were ob g over 50 independent computer runs f
in k2500
14000 with J = 2.0, and P = 0.1, i.e., interfer-ence-to-signal power ratio (ISR) of 13.0 dB. The values for 2
v
, ,
and 0 were set to 10 , 0.2,3 and 0.2 ,
respectively, and L=255. Here the AWGN PSD N is ignored as it is assumed to be much smaller than the NBI power J.
In Figure 2, simulated results for the frequency track-
ing MSE are plotted and compared retical v s obtained from (29) with the DS-CDMA system n ber of active users K as a parameter. Here the step size con-stant
0
with theo alue um
was set to 104. For small values of 0
[image:5.595.318.519.319.477.2] , the figure shows a decrease in the frequency tracking MSE which increases after 0 exceeds the optimal notch bandwidth coefficient opt whose value depends on K. Close agreement between analytical and simulation re-sults is clearly demonstrated by the figure.
Figure 3 shows plots of theoretical values of the fre-quency tracking MSE ob ined from (35) and simulated results with the number active DS CDMA users K as a parameter for 0 0.90.
ta of
It is observed from the figure that the frequency tracking MSE decreases for values of
less than the optimal step size opt which depends
on K. For values of above opt, the frequency tracking MSE increases steadily. Similarly, close agree-
0.8 0.82 0.84 0.86 0.88 0.9 0.92 0.94 0.96 0.98 1 10-6
10-5 10-4 10-3
Notch bandwidth coefficient 0
F
re
qu
enc
y t
ra
cki
ng M
S
E
[image:5.595.319.519.531.686.2]K=10 USERS K=5 USERS K=1 USER ANALYTICAL
Figure 2. Frequency tracking MSE with number of DS-CDMA users K as a parameter.
0 0.5 1 1.5 2 2.5 3 3.5 4 4.5 5
x 10-4 10-6
10-5 10-4
Step size constant
Fr
equ
enc
y t
ra
cki
n
K=10 USERS K=5 USERS
g M
S
E
K=1 USER ANALYTICAL
ment between analytical values and simulation results is clearly shown by the figure.
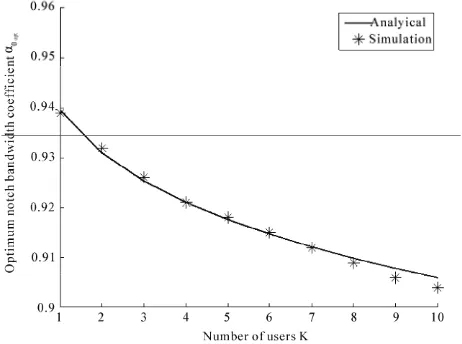
Figure 4 shows simulated results and theoretical val-ues for the optimum notch bandwidth coefficient 0opt
s K
ease in plotted against the number of DS-CDMA active user for 10 .4 Similarly, the figure shows a decr
opt
0
with the increase in K as predicted by (37 (38). There is a close agreement between simulated re-sults and theoretical values as validated by the figure.
Simulated results and theoretical values obtained from (36) for the optimum step-size constant
) and
opt
versus number of active DS-CDMA users K are Fig-ure 5 with
plotted in
0 0.9
. The figure shows a decrease in
opt
with the increase in K as anticipated by (30). Close agreement between simulated results and theoretical values is clearly demonstrated by the figure.
Figure 4. Optimum step-size constant versus number of ctive users K.
igure 5. Optimum notch bandwidth coefficient versus the number of DS-CDMA active users K.
6. Conclusions
Frequency tracking characteristics of the complex-coe- fficient adaptive IIR notch filter for suppression of NBI with randomly-varying frequency in a DS-CDMA com-munication system over a Rayleigh fading channel were investigated in this paper. Derived closed-form expres-sions for frequency tracking MSE and optimum step size and notch bandwidth coefficient have revealed a need for proper setting of adaptation algorithm and IIR notch fil-ter paramefil-ters to minimize frequency tracking MSE. Moreover, computer simulation results have demon-strated the accuracy of the analytical approach. In the future, probability of bit error of the DS-CDMA system with NBI suppression complex adaptive IIR notch filter will be investigated.
“Adaptive LMS filters for overlay situations,” IEEE Journal on Communications, Vol. 14, pp. 1548–1559, October 1996.
a
F
7. References
[1] W. C. Y. Lee, “Overview of cellular CDMA,” IEEE Transactions on Vehicular Technology, Vol. 40, pp. 291– 301, May 1991.
[2] R. L. Pickholtz, D. L. Schilling, and L. B. Milstein, “Theory of spread spectrum communications: A tutorial,” IEEE Transactions on Communications, Vol. COMM-30, pp. 855–884, May 1982.
[3] L. B. Milstein, et al., “On the feasibility of a CDMA overlay for personal communications networks,” IEEE Journal on Selected Areas in Communications, Vol. 10, pp. 655–668, May 1992.
[4] H. V. Poor and L. A. Rusch, “Narrowband interference suppression in spread spectrum CDMA,” IEEE Commu-nications Magazine, Vol. 1, pp. 14–27, August 1994. ] J. Wang and L. N. Miltein,
[5
cellular CDMA lected Areas in
[6] M. Lops, G. Ricci, and A. M. Tulino, “Narrowband in-terference suppression in multiuser CDMA systems,” IEEE Transactions on Communications, Vol. 46, pp. 1163–1175, September 1998.
[7] S. Buzzi, M. Lops, and A. M. Tulino, “Time-varying narrow-band interference rejection in asynchronous mul-tiuser DS/CDMA systems over frequency-selective fad-ing channels,” IEEE Transactions on Communications, Vol. 47, pp. 1523–1535, October 1999.
[8] W. S. Hou, L. M. Chen and B. S. Chen, “Adaptive nar-rowband interference rejection in DS-CDMA systems: A scheme of parallel interference cancellers,” IEEE Journal on Selected Areas in Communications, Vol. 19, pp. 1103–1114, June 2001.
[9] V. Krishnamurthy, G. Yin, and S. Singh, “Adaptive step-size algorithms for blind interference suppression in DS/CDMA systems,” IEEE Transactions on Signal Proc-essing, Vol. 49, pp. 190–201, January 2001.
1 2 3 4 5 6 7 8 9 10
1 1.2 1.4 1.6 1.8 2 2.2
2.4x 10
-4
Number of users
Analytical Simulation
O
pt
im
um
step
si
ze
co
ns
tan
t
op
A. N. Mvuma 249
amoto,
“Conver-o. 5, pp.
, pp. 1526–1529, June 2009. [10] S. C. Pei and C. C. Tseng, “Complex adaptive IIR notch
filter algorithm and its applications,” IEEE Transactions on Circuits and Systems, Vol. CAS-41, No. 2, pp. 158– 163, February 1994.
[11] S. Nishimura and H. Y. Jiang, “Simplified realization of cascaded adaptive notch filters with complex coeffi-cients,” Proceedings of International Symposium on Cir-cuits and Systems, Vol. 5, pp. 269–272, 1998.
[12] H. Y. Jiang, S. Nishimura, and T. Hin
gence analysis of complex adaptive IIR notch filters for the detection of single sinusoid,” IEICE Transactions Fundamentals, Vol. E82-A, No. 6, pp. 912–915, June 1999.
[13] H. Y. Jiang, S. Nishimura, and T. Hinamoto, “Steady- state analysis of complex adaptive IIR notch filter and its application to QPSK communication systems,” IEICE Transactions Fundamentals, Vol. E85-A, N
1088–1085, May 2002.
[14] A. Mvuma, S. Nishimura, and T. Hinamoto, “Tracking analysis of complex adaptive IIR notch filter for a linear chirp signal,” IEICE Transactions Fundamentals, Vol. E92-A