and Quantitative Magnetization Transfer
Laurie A. Loevner, Robert I. Grossman, Joseph C. McGowan, Karen N. Ramer, and Jeffrey A. Cohen
PURPOSE: To investigate the relationship between the appearance of multiple sclerosis lesions
identified on unenhanced T1-weighted images and their corresponding magnetization transfer ratios. METHODS: A total of 119 white matter lesions seen on T2-weighted images in 17 patients with multiple sclerosis were evaluated. Axial T1-weighted images were used to classify the lesions as isointense to white matter (10 lesions), hypointense to white matter but hyperintense to gray matter (44 lesions), hypointense to gray matter (59 lesions), and relatively isointense to cerebro-spinal fluid (6 lesions). The magnetization transfer ratio of each lesion was calculated, and an average magnetization transfer ratio for each subcategory was determined. RESULTS: The mag-netization transfer ratio values became progressively lower with increasing hypointensity of lesions on T1-weighted images. The average magnetization transfer ratio for lesions isointense to white matter, hypointense to white matter but hyperintense to gray matter, hypointense to gray matter, and relatively isointense to cerebrospinal fluid was 34.9062.67 (mean6SD), 30.9363.57, 27.2763.56, and 23.6262.83, respectively. All groups were significantly different from each other. CONCLUSION: Lesions isointense to white matter exhibited higher magnetization transfer ratio values than lesions that were hypointense. These findings are consistent with relative pres-ervation of the myelin structure in the former, perhaps indicating that these lesions are predomi-nantly inflammatory (edematous) in nature. The proportionately lower magnetization transfer ratio values of lesions that appear progressively more hypointense on T1-weighted images may reflect varying degrees of demyelination, with increasing lesion hypointensity corresponding to more breakdown in the macromolecular structure. These results suggest that T1-weighted images may be useful in characterizing the underlying pathologic substrate in multiple sclerosis plaques.
Index terms: Sclerosis, multiple; Magnetic resonance, magnetization transfer
AJNR Am J Neuroradiol16:1473–1479, August 1995
Magnetic resonance (MR) imaging is a very sensitive technique for detecting focal lesions in patients with multiple sclerosis. Serial MR ex-aminations are helpful in distinguishing acute from chronic lesions, and lesion enhancement after administration of gadolinium may show
transient blood-brain barrier abnormalities (1). Enhancing lesions may resolve or may progress to chronic plaques, and older lesions may be reactivated, as evidenced by recurrent en-hancement (1). However, MR is not specific in showing disease stage and does not distinguish between edema, demyelination, and gliosis within tissue (1–3).
Classification of multiple sclerosis lesions could potentially serve as a rationale for thera-peutic interventions. Identification of lesions with myelin loss may be important, because they may be less responsive to treatment than edematous and inflammatory lesions. Several investigators have noted a wide range of ele-vated T1 and T2 relaxation times in multiple sclerosis lesions and have speculated that the spectrum of values may denote histologic dif-ferences among lesions (4 –7).
Received October 18, 1994; accepted after revision February 21, 1995. Supported in part by grant RO1 NS2 9029-OIA1 from the National Institute of Neurological Disorders and Stroke, National Institutes of Health. Presented at the Second Scientific Meeting of the Society of Magnetic Resonance, San Francisco, Calif, 1994.
From the Department of Radiology, Hospital of the University of Penn-sylvania, Philadelphia.
Address reprint requests to R. I. Grossman, MD, Department of Radiol-ogy, Hospital of the University of Pennsylvania, 3400 Spruce St, Philadel-phia, PA 19104-4283.
AJNR 16:1473–1479, Aug 1995 0195-6108/95/1607–1473
qAmerican Society of Neuroradiology
Magnetization transfer imaging is a relatively new technique that may generate contrast that reflects structural variation within tissue. Mag-netization transfer is observed through the ap-plication of off-resonance radio-frequency irra-diation designed to saturate preferentially immobile protons of macromolecules, which subsequently exchange with mobile protons in the aqueous phase (8, 9). Exchange of the sat-urated proton spins into the pool of aqueous spins tends to decrease the observed signal in-tensity on the subsequent MR image when com-pared with the reference image obtained with-out saturation. This effect may be quantitated by determining the magnetization transfer ratio. Dousset et al (10) measured the magnetiza-tion transfer ratio (expressed as percentages) of white and gray matter in healthy volunteers and found average values (mean 6 SD) of 41.8 6 1.3 and 38.961.7, respectively. Cerebrospinal fluid (CSF) had an average magnetization transfer ratio of approximately 2%. In patients with multiple sclerosis, these investigators found a wide range of reduced magnetization transfer ratios in focal white matter lesions iden-tified on T2-weighted images, with small to marked decreases, and speculated that these reflected edematous lesions without significant myelin loss and demyelination, respectively (10). In experimental allergic encephalomyelitis in guinea pigs, they found small decreases in the magnetization transfer ratios of lesions that histologically had edema but no demyelination (10). These authors found the decrease in the magnetization transfer ratio in edematous le-sions without demyelination to be less than the decrease in the magnetization transfer ratio in those lesions suspected of being demyelinated. Although hyperintensity is seen with both types of lesions on T2-weighted images, T2-weighted images are unable to differentiate them.
Prior investigators have suggested that le-sions that are hypointense on T1-weighted im-ages represent older plaques with more demy-elination and gliosis compared with lesions that show minimal or no hypointensity (11, 12). The purpose of this study is to investigate the rela-tionship between the appearance of white mat-ter lesions on unenhanced T1-weighted images and their corresponding magnetization transfer ratios. The particular intensity of lesions on T1-weighted images may provide additional infor-mation regarding their pathologic substrate.
Materials and Methods
A total of 119 circumscribed white matter lesions (high signal abnormalities on T2-weighted images) were studied in 17 patients with multiple sclerosis (4 chronic progres-sive and 13 relapsing remitting). To avoid artifacts related to volume averaging, lesions were selected for evaluation only if they were well defined and measured at least 5 mm. The patients (11 women and 6 men) ranged in age from 24 to 48 years (mean, 34.2 years). All studies were per-formed with a 1.5-T scanner using a quadrature head coil. Each patient’s head was secured between sponge wedges and taped to prevent motion both during and between the acquisition of images. Patients were evaluated with con-ventional spin-echo sequences, which included unen-hanced 5-mm-thick sagittal T1-weighted images (600/ 11/1 [repetition time/echo time/excitations]), contiguous 3-mm-thick axial T1-weighted images (600/11–17/1), and 3-mm-thick interleaved axial T2-weighted fast spin-echo images (2500/18,90/1). Other imaging parameters included a 22-cm field of view and a 2563192 matrix.
Unenhanced magnetization transfer imaging in the axial plane was performed with a modified three-dimensional gradient-recalled acquisition in the steady state (General Electric Medical Systems, Milwaukee, Wis). The pulse se-quence was chosen to minimize both T1 and T2 weighting (106/5/1, 128flip angle) with 5-mm-thick sections and a 256 3 128 matrix. Magnetization transfer contrast was achieved by the application of 19-millisecond sinc-shaped saturation pulses with an average amplitude (B1 intensity) of 3.7 3 1026 T at a frequency 2 kHz less than water
resonance. The interval between the end of the saturation pulses and the beginning of each excitation was approxi-mately 1 millisecond. Corresponding reference images were obtained using identical acquisition parameters but no saturation pulses.
Image analysis consisted of identifying focal, well-de-fined plaques on T2-weighted images (all lesions mea-sured 5 to 15 mm). These lesions were then evaluated on the corresponding unenhanced axial T1-weighted images and divided into categories based on increasing hypoin-tensity relative to brain tissue. Plaques were subcatego-rized as isointense to white matter (10 lesions), hypoin-tense to white matter but hyperinhypoin-tense to gray matter (44 lesions), hypointense to gray matter (59 lesions), and approaching the intensity of CSF (6 lesions) (Fig 1). T1-weighted intensity values in the center of each lesion were obtained from the axial images using a 0.04-cm2 round
cursor. We obtained normalized T1 intensity data by divid-ing the lesion T1-weighted intensity value by the average ventricular CSF intensity value in the same patient. On magnetization transfer images, a region of interest also using a 0.04-cm2round cursor (eight pixels were
exact axial level; however, the same axial level to within 1 mm was achievable for all measurements. The average intensity in the region of interest was measured in the same location on images with the saturation pulses on and off. The magnetization transfer ratio defined as (Mo2Ms)/Mo, where Mo is the average intensity of pixels within a region of interest on an image without saturation, and Ms is the average intensity of pixels corresponding to the same re-gion of interest on an image with saturation, was deter-mined for each lesion. The calculated magnetization trans-fer ratio was then multiplied by 100 to yield a percentage
(Fig 2). An average magnetization transfer ratio for each subcategory of lesions identified on T1-weighted images was then determined. The relationships between (a) lesion appearance on T1-weighted images and magnetization transfer ratio and (b) normalized lesion T1 intensity values and magnetization transfer ratio were examined. All lesion characterizations and calculations were performed by the same radiologist (L.A.L.).
[image:3.612.57.386.101.314.2]Statistical analysis of the data was performed. Compar-ison of the magnetization transfer ratio data among the four groups of white matter lesions subcategorized by their Fig 1. Examples of white matter lesions on T1-weighted images in two patients with multiple sclerosis.
A, Lesions hypointense to white matter are noted in the corona radiata (arrows) in this 29-year-old man.
B, Multiple lesions hypointense to gray matter in the centrum semiovale in a 27-year-old man.
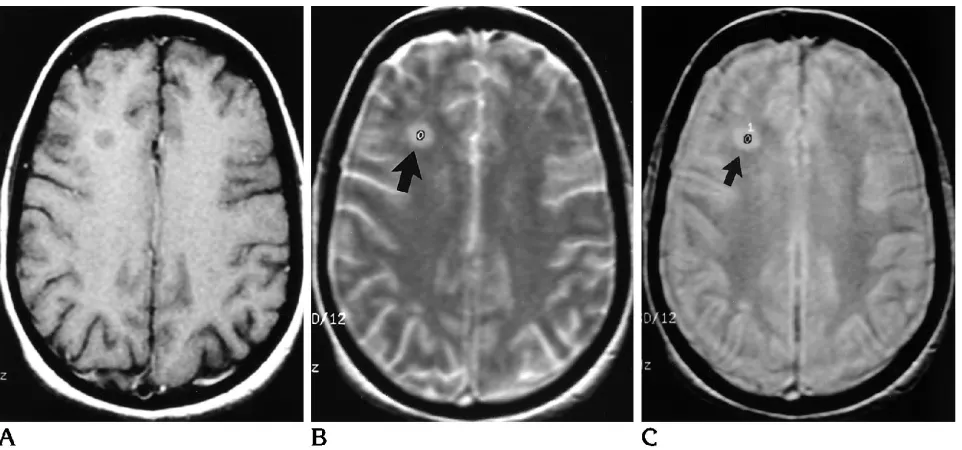
Fig 2. Demonstration of region of interest intensity measurement in a white matter lesion. A, Axial T1-weighted images shows a lesion in the right frontal white matter.
[image:3.612.68.549.470.695.2]appearance on T1-weighted images was performed using a one-way analysis of variance and an unpairedttest with Bonferroni’s correction. A P value of less than .05 was considered a significant difference.
Results
All patients had focal, circumscribed lesions. The number of plaques per patient ranged from 2 to 16. There was a strong correlation between lesion hypointensity on T1-weighted images and magnetization transfer ratio values. Specif-ically, the magnetization transfer ratio values were progressively lower with increasing lesion hypointensity on T1-weighted images. The av-erage magnetization transfer ratio for lesions isointense to white matter, hypointense to white matter but hyperintense to gray matter, hypoin-tense to gray matter, and relatively isoinhypoin-tense to CSF were 34.9062.67 (mean6SD), 30.936 3.57, 27.2763.56, and 23.6262.83, respec-tively. The recorded SDs were calculated on the range of average magnetization transfer ratios that were obtained for each subcategory of plaques. The mean SD for the signal intensity measurements of all the individual region of interests within the plaques was 2.8 (range, 0.4 to 5.3; median, 2.6). All groups were compared with each other by statistical analysis and found to be significantly different from each other with
P , .01 in all comparisons. These results are summarized in the Table.
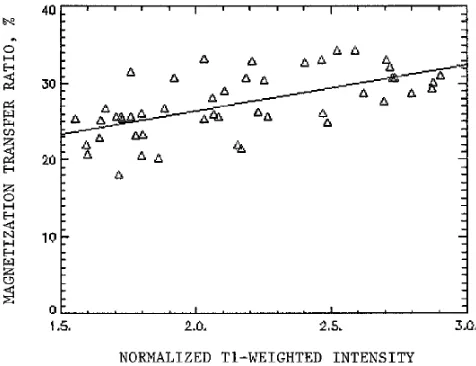
Comparison of normalized lesion T1 intensity values with their corresponding magnetization transfer ratios showed a good correlation, with lower signal intensity on the T1-weighted im-ages having proportionately lower magnetiza-tion transfer ratios. To reduce the effects of vol-ume averaging, only lesions larger than 6 mm were evaluated by a scatter plot, which demon-strated a regression correlation coefficient of .62 (Fig 3).
Discussion
To evaluate the efficacy of various treatment protocols in patients with multiple sclerosis, a sensitive indicator of disease burden is neces-sary. Clinical symptoms depend not only on physiologic activity, but also, perhaps more im-portantly, on lesion location (1, 13). Numerous lesions are usually identified on MR imaging, many of which are clinically silent. Studies have suggested that MR is a sensitive indicator of disease burden and activity (1, 14, 15). T2-weighted imaging is sensitive in identifying fo-cal plaques in patients with multiple sclerosis; however, it does not distinguish histologic dif-ferences (edema, demyelination, and gliosis) among lesions, most of which are similar in appearance on T2-weighted images (1).
To evaluate long-term prognosis as well as to establish the subset of patients most likely to benefit from a particular therapeutic interven-tion, it would be useful to be able to subcatego-rize total disease burden into those lesions that
T1 weighting and magnetization transfer ratio data for lesions
Lesion Category on T1 Weighting Number of Lesions Average Magnetization Transfer Ratio6SD
Isointense to white matter 10 34.9062.67
Hypointense to white matter but
hyperintense to gray matter 44 30.9363.57
Hypointense to gray matter 59 27.2763.56
[image:4.612.316.554.501.684.2]Approaching intensity of CSF 6 23.6262.83
are edematous and inflammatory with relative preservation of myelin structure and those le-sions in which there has been significant break-down of myelin. Pathologic evaluation of multi-ple sclerosis plaques has established the heterogeneous nature of these lesions. Not only is there histologic variation from lesion to lesion within a patient, but individual lesions them-selves are often complex, having central demy-elination and gliosis with more peripheral edema (16). Therefore, imaging techniques that reflect structural variations within tissue would be use-ful in subcategorizing lesions based on their pre-dominant underlying pathologic substrate.
Investigators have studied a variety of MR imaging techniques in an attempt to classify white matter plaques based on their underlying histology. Lacomis et al (7) demonstrated in-creased T1 relaxation times in lesions com-pared with normal-appearing white matter. Larsson et al (5, 6) found a range of prolonged T1 and T2 values in both stable and active mul-tiple sclerosis lesions. Armspach et al (4) found a wide distribution of increased T2 relaxation values in lesions as well as changing T2 values within lesions over serial examinations, sup-porting the concept that multiple sclerosis is an evolving disease. Prolongation of T1 and T2 values have also been noted in lesions of un-fixed postmortem brains (17). Increased relax-ation times may be related to an increase in the free water–to– bound water ratio in abnormal tissue (18, 19). In multiple sclerosis, this may be secondary to a decrease in lipid bound water accompanying demyelination with an increase in extracellular free water that fills in areas of tissue loss (20, 21). Investigators have specu-lated that the spectrum of increased relaxation values reflects pathologic differences in tissue; however, they have not been able to assign specific values to particular histologies (4 – 6, 17).
Magnetization transfer imaging is a technique that may generate contrast based on the ex-change of magnetization between bound pro-tons and free water, thus reflecting structural variation within tissue (8, 9). In 1963, Forsen and Hoffman exploited the exchange of magne-tization in a spectroscopy experiment to quan-tify chemical exchange rates (22). Although the exact physical mechanism of magnetization transfer contrast has not been completely delin-eated, a model that has been proposed incor-porates two distinct pools of water protons
within biological tissues: bound immobile pro-tons associated with macromolecules (such as myelin and cell membranes) and mobile pro-tons associated with bulk water. Magnetization transfer imaging is achieved through the appli-cation of off-resonance radio-frequency irradia-tion designed to saturate preferentially immo-bile protons of macromolecules, which subse-quently cross-relax with mobile protons in bulk water through chemical exchange and/or dipole interactions (9, 23). The result is decreased sig-nal intensity on the magnetization transfer im-age, which may be quantitated by the magne-tization transfer ratio. The magnetization transfer ratio reflects structural variations in tis-sue. Low magnetization transfer ratios, corre-sponding to a decreased exchange between spin pools, are thus consistent with a break-down in macromolecular structure.
Dousset et al (10) found mildly reduced mag-netization transfer ratios (36.3% to 37.8%) in focal white matter lesions in guinea pigs with experimental allergic encephalomyelitis. On histologic evaluation these lesions were edem-atous without demyelination. In white matter lesions identified on T2-weighted images in pa-tients with multiple sclerosis, these investiga-tors found even lower magnetization transfer ratios with small to marked decreases and hy-pothesized that these reflected edematous le-sions without significant myelin loss and demy-elination, respectively (10). Gass et al (24) demonstrated lower average magnetization transfer ratio values in lesions identified on T2-weighted images in all subgroups of patients with multiple sclerosis (benign, progressive, and relapsing remitting) and found an inverse relationship between the lesion magnetization transfer ratio and disability (24). These authors suggested that reduced magnetization transfer ratios in multiple sclerosis lesions might corre-spond to varying degrees of demyelination and axonal loss, both of which are likely to result in functional disability. Tomiak et al (25) found that lesions identified on T2-weighted images of less than 1 year’s duration had higher average magnetization transfer ratios than older plaques and suggested that the different values may re-flect histologic changes over time (25).
subcat-egorized as isointense to white matter but hy-perintense to gray matter, hypointense to white matter, hypointense to gray matter, and ap-proaching the intensity of CSF (Fig 1). We found that magnetization transfer ratios were progressively lower as lesion hypointensity in-creased. Using regression analysis, we found a correlation between observed lesion T1 inten-sity values and magnetization transfer ratios, consistent with the proposed multisite ex-change model for magnetization transfer. In Mc-Connell’s two-site model (26), in which the time rate of change of the longitudinal magnetization of observable “a” spins is given by:
dMza/dt52(Mza2Moa/T1)2Mzakfor1Mzbkrev,
the T1 on the right side of this equation is the intrinsic T1 of material “a.” However, the ob-served T1 will reflect all processes that affect the return of magnetization to equilibrium, in-cluding exchange. If there is a net decrease in longitudinal magnetization recovery resulting from the exchange process, as might be the case if magnetization is held in saturation, the approach to equilibrium of the “a” magnetiza-tion will be less rapid. This will result in a longer observed T1, even though the intrinsic T1 is constant. The modulation of observed T1 is re-lated to the pseudo–first-order exchange con-stant, kfor, and therefore to the magnetization transfer effect. Comparing magnetization trans-fer experiments with materials of diftrans-ferent kfor magnitudes, the expectation is that magnetiza-tion transfer ratio will have a correlamagnetiza-tion with observed T1 values, consistent with our obser-vations.
From our understanding of magnetization transfer imaging together with results from pre-vious studies using magnetization transfer to evaluate multiple sclerosis, we speculate that lesions identified on T1-weighted images may represent varying degrees of demyelination, with the most hypointense lesions representing chronic, demyelinated plaques. We speculate that T1-weighted images may be better than T2-weighted images in indicating myelin loss. Little has been published on the appearance of lesions on T1-weighted images; however, other investigators also support the potential utility of T1-weighted images in evaluating patients with multiple sclerosis. Hiehle et al (11) showed lower magnetization transfer ratios for lesions hypointense to white matter on T1-weighted im-ages when compared with lesions that were
isointense. Shah et al (12) compared a T1-weighted gradient-echo technique and T2-weighted images in evaluating lesions in multi-ple sclerosis and found that the gradient-echo technique better identified lesions in the corpus collosum and pons. The improved contrast for lesion detection in these locations using the gra-dient-echo technique may be secondary to in-creased magnetization transfer effects.
Results recently obtained with MR spectros-copy also tend to support conclusions regarding a pathologic substrate obtained in the present study. Investigators have shown decreases both in N-acetyl aspartate as well as the N-acetyl aspartate–to– creatine ratio in chronic plaques (27–30). Spectra of active enhancing lesions have demonstrated increases in lactate, the choline-to-creatine ratio, and mobile lipid and cholesterol peaks (27, 28, 30, 31). Grossman et al (29) found an association between composite peaks at 2.1 to 2.6 ppm and lesion enhance-ment. Because these extra peaks are in a region in which g-aminobutyric acid, glutamate, and other amino acids resonate, the authors sug-gested that these peaks might represent myelin byproducts. Recently, Hiehle et al (32) noted a linear, inverse correlation between decreased magnetization transfer ratio and increased spectral composite peaks at 2.1 to 2.6 ppm in multiple sclerosis plaques identified on T2-weighted images, supporting the contention that extra peaks and very low magnetization transfer ratios may be good markers of demy-elination.
References
1. Grossman RI, Gonzalez-Scarano F, Atlas SW, Galetta S, Silber-berg DH. Multiple sclerosis: gadolinium enhancement in MR im-aging.Radiology1986;161:721–725
2. Jackson JA, Leake DR, Schneiders NJ, et al. Magnetic resonance imaging in multiple sclerosis: results in 32 cases.AJNR Am J Neuroradiol1985;6:171–176
3. Paty DW. Magnetic resonance imaging in demyelination. In: Kim SU, ed.Myelination and Demyelination, Implications for Multiple Sclerosis.New York: Plenum, 1987:259 –272
4. Armspach JP, Gounot D, Rumbach L, Chambron J. In vivo deter-mination of multiexponential T2 relaxation in the brain of patients with multiple sclerosis.Magn Reson Med1991;9:107–113 5. Larsson HBW, Frederiksen J, Petersen J, et al. Assessment of
demyelination, edema, and gliosis by in vivo determination of T1 and T2 in the brain of patients with acute attack of multiple sclerosis.Magn Reson Med1989;11:337–348
6. Larsson HBW, Frederiksen J, Kjaer L, Henriksen O, Olesen J. In vivo determination of T1 and T2 in the brain of patients with severe but stable multiple sclerosis.Magn Reson Med1988;7:43–55 7. Lacomis D, Osbakken M, Gross G. Spin-lattice relaxation (T1)
times of cerebral white matter in multiple sclerosis.Magn Reson Med1986;3:194 –202
8. Lundbom N. Determination of magnetization transfer contrast in tissue: an MR imaging study of brain tumors.AJR Am J Roentge-nol1992;159:1279 –1285
9. Wolff SD, Balaban RS. Magnetization transfer contrast (MTC) and tissue water proton relaxation in vivo.Magn Reson Med1989;10: 135–144
10. Dousset V, Grossman RI, Ramer KN, Schnall MD, Young LH, Gonzalez-Scarano F. Experimental allergic encephalomyelitis and multiple sclerosis: lesion characterization with magnetization transfer imaging.Radiology1992;182:483– 491
11. Hiehle JF, Grossman RI, Ramer KN, Gonzalez-Scarano F, Cohen JA. Magnetization transfer effects in MR-detected multiple sclero-sis lesions: comparison with gadolinium-enhanced spin-echo im-ages and nonenhanced T1-weighted imim-ages.AJNR Am J Neuro-radiol1994;16:69 –77
12. Shah M, Ross JS, VanDyke C, et al. Volume T1-weighted gradient echo MRI in multiple sclerosis patients.J Comput Assist Tomogr 1992;16:731–736
13. Jacobs L, Kinkel WR, Polachini I, Kinkel RP. Correlations of nu-clear magnetic resonance imaging, computerized tomography, and clinical profiles in multiple sclerosis. Neurology1986;36: 27–34
14. Isaac C, Li DKB, Genton M, et al. Multiple sclerosis: a serial study using MRI in relapsing patients.Neurology1988;38:1511–1515 15. Willoughby WE, Grochowski E, Lee D, et al. Serial magnetic
resonance scanning in multiple sclerosis: a second prospective study in relapsing patients.Ann Neurol1989;25:43– 49 16. Hallpike JF, Adams CWM, Tourtellotte WW. Multiple Sclerosis:
Pathology, Diagnosis, and Management.London: Chapman and Hall, 1983:203
17. Miller DH, Johnson G, Tofts PS, MacManus D, McDonald WI. Precise relaxation time measurements of normal-appearing white matter in inflammatory central nervous system disease. Magn Reson Med1989;11:331–336
18. Wehrli FW, McFall JR, Newton T. Parameters determining the appearance of NMR images. In: Mewton T, Potts DG, eds.Modern Neuroradiology.San Anselmo, Calif: Clavadel Press, 1983;2:81– 117
19. Bradley WG, Newton TH, Crooks LE. Physical principles of nu-clear magnetic resonance. In: Newton T, Potts DG, eds.Modern Neuroradiology. San Anselmo, Calif: Clavadel Press, 1983;2:15– 61
20. Kinkel WR, Jacobs L, Polachini I, Bates V, Heffner RR Jr. Subcor-tical arteriosclerotic encephalopathy (Binswanger’s disease): computerized tomographic, nuclear magnetic resonance, and clinical correlations.Arch Neurol1984;42:951–959
21. Tourtellotte WW, Parker JA. Some spaces and barriers in post-mortem MS. In: Lajtha A, Ford DH, eds.Progress in Brain Re-search. Brain Barrier Systems.New York: Elsevier, 1968;29:493– 522
22. Forsen S, Hoffman RA. Study of moderately rapid chemical ex-change reactions by means of nuclear magnetic double reso-nance.J Chem Phys1963;39:2892–2901
23. Eng J, Ceckler TL, Balaban RS. Quantitative 1H magnetization transfer imaging in vivo.Magn Reson Med1991;17:304 –314 24. Gass A, Barker GJ, Kidd D, et al. Correlation of magnetization
transfer ratio with clinical disability in multiple sclerosis. Ann Neurol1994;36:62– 67
25. Tomiak MM, Rosenblum JD, Prager JM, Metz CE. Magnetization transfer: a potential method to determine the age of multiple sclerosis lesions.AJNR Am J Neuroradiol1994;15:1569 –1574 26. McConnell HM. Reaction rates by nuclear magnetic resonance.J
Chem Phys1958;28:430 – 431
27. Matthews PM, Francis G, Antel J, Arnold DL. Proton magnetic resonance spectroscopy for metabolic characterization of plaques in multiple sclerosis.Neurology1991;41:1251–1256
28. Miller DH, Austin SJ, Connelly A, Youl BD, Gadian DG, McDonald WI. Proton magnetic resonance spectroscopy of an acute and chronic lesion in multiple sclerosis.Lancet1991;337:58 –59 29. Grossman RI, Lenkinski RE, Ramer KN, Gonzalez-Scarano F,
Cohen JA. MR proton spectroscopy in multiple sclerosis.AJNR Am J Neuroradiol1992;13:1535–1543
30. Larsson HBW, Christiansen P, Jensen M, et al. Localized in vivo proton spectroscopy in the brain of patients with multiple sclero-sis.Magn Reson Med1991;22:23–31
31. Narayana PA, Wolinsky JJ, Jackson EF, McCarthy M. Proton MR spectroscopy of gadolinium-enhanced multiple sclerosis plaques. J Magn Reson Imaging1992;2:263–270