359 | P a g e
MODELING AND PARAMETRIC OPTIMIZATION IN
COATED WIRE ELECTRIC DISCHARGE
MACHINING OF TOOL STEEL THROUGH
RESPONSE SURFACE METHODOLOGY
Rajeev Kumar
1, Saswat Das
2, Karishma Dutt
3,
Satpal Sharma
4, Raof Ahmad Khan
51,2,
Mechanical Engineering Department, IIMT College of Engineering, Greater Noida
3,4
School of Engineering, Gautam Buddha University, Greater Noida
5
Mechanical Engineering Department, Govt. College of Engineering and Technology, Jammu
ABSTRACT
A study has been made to optimize the process parameters of wire-EDM of tool steel using zinc coated wire. Electric Discharge Machining (EDM) has been used for machining of electrically conductive difficult materials. Wire EDM is a kind of EDM where a wire is used to act as the tool and due to erosion, machining takes place. Generally, Brass and Copper wires are effectively used for machining but it was found that the productivity and characteristics for coated wires had better results hence coated wires (zinc) will be used. Some authors used coated wires and claimed to receive a 25% re-cast layer. This present research investigates optimization, design of WEDM process performed on the Tool Steel EN8. The major performance characteristic that to be evaluated is Material Removal Rate (MMR). The corresponding parameters acting as the input are Current, Pulse on Time and Pulse off Time.RSM design called central composite design (CCD) has been utilized to plan the experiment and Response Surface Methodology is implied for developing experimental model. Analysis on machining characteristics of coated WEDM was made based on developed model. ANOVA test will be carried out as well to check the adequacy of developed regression models.
Keywords: WEDM, Coated Wire, Tool Steel EN31, Central Composite Design, Response Surface
Methodology
I. INTRODUCTION
WEDM is a thermoelectric process in which heat energy of a spark is used to remove material from the
work-piece using a wire, where both wire and work-work-piece are electrically conductive. The material is removed in the
form of debris by means of a series of recurring electrical discharges (created by electric pulse generators in
360 | P a g e
water). The dielectric serves some important functions viz, cools down the tool and work-piece, cleans orflushes away the inter-electrode gap and localizes the spark energy into a small cross-sectional area. Effective
flushing of dielectric removes products from the gap. An Ineffective flushing, results in low MRR and poor
surface finish. The effective flushing may increase MRR as much as by a factor of 10 or so [Koshy et al, 1993]. A spark is produced between the two electrodes and its location is determined by narrowest gap between the
two. The material erosion mechanism primarily makes use of electrical energy and turns it into thermal energy
through a series of discrete electrical discharges occurring between the electrode and work piece immersed in a
dielectric liquid medium [Tsai, H.C. 2003]. A constant gap between tool and work-piece is maintained with the
help of a computer controlled positioning system. This system is used to cut through complicated contours
especially in difficult to machine materials. This process gives a high degree of accuracy and a good surface
finish. Wire EDM has been employed for making dies of various types. It is possible of control tolerances very
effectively. This process is also used for fabrication of press tools and electrodes for use in other areas of EDM.
The wires generally used are of brass or copper of diameter about 0.5-0.30mm, but in recent times coated wires
are widely used, usually zinc coated over brass wire. The impact of coated wires was found to have a significant
effect. The productivity and surface roughness were obtained to be better than uncoated wires [Antar et al.
(2011)].Coated wires are stated to protect the core from thermal shock and also from wire rupture as well. Its
other effects were found on vibration, dumping effect, heat transfer and resistance which ultimately increased
the machining speed [Jatinder Kapoor (2010)]
.
Wire is discarded after it has been used once because thesparking takes place at its leading surface hence, it no longer remains round.
361 | P a g e
II. EXPERIMENTAL WORK
Experiments were conducted on SPRINTCUT WEDM in Noida Sec. 10.The material used for present
investigation is EN31 block of 25mm x 28.4mm x 11.6mm. The electrode used is a zinc coated brass wire of
0.25mm diameter and dielectric of distilled water. The machining was done for 5 minutes for each run and the
initial weight and final weight were noted in order to calculate the MRR (gm/min) using the following formula-
MRR= Initial weight- Final weight (1)
Time Taken
2.1 Design Of Experiments
The machining parameters for Tool steel EN31 as current (190-230amps), pulse on time (115-127), pulse off
time (42-44) and wire tension (1-5 kgf). The model to be created shall use CCRD experimental design where
standard error is kept the same for all points that are at the same distance from center of the region. It requires
five levels of all control factors for calculation of regression coefficients. The coded values for different levels
in CCRD are -2,-1, 0, 1, 2 as shown in table 1. The total number of runs required in CCRD is:
N = 2k+2k + nc, (2)
Where N stands for total number of runs, k is the number of variables which in this case in 4 and nc is the total
number of center points which in a standard CCRD matrix is 7. The total number of runs now selected is
calculated as: 24 + 2*4 + 7 = 31 and shown in table 2.
Table 1: Parameters with Levels
Factors Level 1 Level 2 Level 3 Level 4 Level 5
-1.682 -1 0 1 1.682
Ton (A) 115 118 121 124 127
Toff (B) 42 44 46 48 50
Ip (C) 190 200 210 220 230
2.2 Response Surface Methodology
It is a collection of statistical and mathematical techniques useful for developing, improving and optimizing
processes. The field of RSM consists of experimental strategy for exploring the space of the process or
independent variables, empirical statistical modeling to develop an appropriate approximating relationship
between yield and the process variables and optimization methods for finding values of the process variables
362 | P a g e
above mentioned machining criteria, second order polynomial response surface mathematical models can bedeveloped. In the general case, the response surface is described by an equation of the form:
Y = βo+ ∑βj xj + ∑βjjx2j + ∑∑βijxi xj (3)
Where Y is corresponding response, which in current research is on MRR, Ra, whereas the terms βo, βj, βij are
second order regression coefficients. The second term under the summation sign of this polynomial equation is
attributable to linear effect, whereas the third term corresponds to the higher-order effects; the fourth term of the
equation includes the interactive effects of the process parameters. Eq. (2) can be rewritten as:
Y = βo + β1X1 + β2X2 + β3X3 + β4X4 + β11X12 + β22X22+ β33X32 + β44X42 +….. (4)
The value of β, the regression coefficient, will be determined by least square method.
III. RESULTS AND DISCUSSION
Analysis were made using RSM to find the mathematical regression model for MRR and cutting speed using
the data that was accumulated while machining. Interactions of the process parameters were also noted and
studied. Using MINITAB 17 a mathematical model relating MRR to its process parameters as mentioned in
Table 2 with its symbols was obtained as follows;
For MRR,
MRR = 0.001195 + 0.000278 A - 0.000125 B + 0.000143 C - 0.000157 A*A - 0.000047 B*B
- 0.000071 C*C - 0.000074 A*B - 0.000039 A*C - 0.000003 B*C (1)
Where, A is Pulse On time (Ton), B is Pulse Off time (Toff) and C is Peak Current.
Investigations were made using RSM to find the mathematical regression model for MRR and SR using the data
that was accumulated while machining. Interactions of the input parameters were also noted and studied. Using
MINITAB 17 a mathematical model relating MRR to its input parameters as mentioned in table.2 with its
363 | P a g e
Table2. Response Values
For speed,
Speed = 1.6173 + 0.3343 A - 0.3698 B + 0.0785 C - 0.1605 A*A + 0.0074 B*B - 0.0810 C*C
- 0.1750 A*B - 0.1250 A*C + 0.0250 B*C (2)
When R2 approaches unity, the response model fits the actual data better. R2 for MRR was found to be 0.8150
and for SR it is 0.7121. Consequently the lack of fit also displays to be insignificant.
Run No
Coded Input Factors
Material
removal rate
(gm/sec.)
T
on(A)
(µs)
T
off(B)
(µs)
I
p(C)
(A)
Cutting Speed
(mm/min.)
1
-1
-1
-1
1.2
0.000417
2
1
-1
-1
2.3
0.000935
3
-1
1
-1
0.5
0.00014
4
1
1
-1
1.3
0.00106
5
-1
-1
1
1.3
0.000514
6
1
-1
1
2.3
0.001575
7
-1
1
1
1.1
0.000922
8
1
1
1
1.6
0.00099
9
-1.682
0
0
0.65
0.000526
10
1.682
0
0
1.7
0.001258
11
0
-1.682
0
2.2
0.001615
12
0
1.682
0
1.1
0.000793
13
0
0
-1.682
1.2
0.000989
14
0
0
1.682
2.9
0.001286
15
0
0
0
1.6
0.001355
16
0
0
0
1.6
0.001253
17
0
0
0
1.7
0.001222
18
0
0
0
1.7
0.001131
19
0
0
0
1.5
0.001096
364 | P a g e
3.1 Analysis of Material Removal Rate
MNITAB 17 was able to generate graphs that could help realize relationship between the responses and the
input parameters. Two parameters were taken at a time leaving the other two parameters to be constant. We
shall discuss the effects various parameters on MRR and cutting speed.
The effects of two process parameters or control factors on the response parameters are known as interaction
effect. In Interaction plot, the two variable change keeping extra two input parameters on the central value and
examine the response characteristics effect and the plot is known as the three-dimensional surface plot.
Table3. ANOVA Table for MRR
Source
DF
Adj SS
Adj MS
F-Value
P-Value
Model
9
0.000006
0.000001
11.66
0.000
Linear
3
0.000004
0.000001
25.52
0.000
Ton
1
0.000001
0.000001
20.94
0.001
T off
1
0.000000
0.000000
4.68
0.056
Current
1
0.000003
0.000003
50.93
0.000
Square
3
0.000000
0.000000
0.82
0.510
Ton*Ton
1
0.000000
0.000000
0.66
0.437
T off*T off
1
0.000000
0.000000
0.91
0.362
current*current
1
0.000000
0.000000
0.74
0.409
2-Way Interaction
3
0.000001
0.000000
8.64
0.004
Ton*T off
1
0.000000
0.000000
1.44
0.258
Ton*current
1
0.000001
0.000001
13.82
0.004
T off*current
1
0.000001
0.000001
10.64
0.009
ERROR
10
0.000001
0.000000
Lack-of-Fit
5
0.000001
0.000000
8.35
0.018
Pure Error
5
0.000000
0.000000
Total
19
0.000006
The fit summary recommended that the quadratic model is statistically significant for analysis of MRR. The
results of the quadratic model for MRR in the form of ANOVA are given in the table 3. The Analysis of
Variance for MRR Table 3 expresses that the pulse on time (A), the pulse off time (B) and Peak current (C),The
2-way interaction terms (Ton Toff, Ton IP, Toff IP) and the Square terms (Ton Ton, Toff Toff, IP Ip) was
365 | P a g e
From Fig. 3.1 shows the effect of interaction of peak current (Ip) and pulse on time (Ton) on MRR. TheMaterial removal rate increases with increase in peak current. Discharge energy increases by peak current to
assist the action of melting and vaporization thereby increasing the MRR. However, after a point the MRR
decreases with increase in peak current, this is due to the fact that with increase in Ip the debris formed is more
and larger in size which result in gap between the electrodes, short circuiting which tends to reduce MRR. From
Fig. 3.2 shows the effect of interaction of pulse on time (Ton) and pulse off time (Toff) on MRR. MRR
increased with Ton and decreased with Toff. Since pulse off time is the pause of among discharges, there is no
voltage between work piece and tool at that time so MRR decreases. While pulse on time increases the MRR
since voltage is present between work piece and electrode and electric discharge take place. It recognized that
MRR is relative to the energy consumed.
T off 0 Hold Values 2 - -1 0 1 1 0 0. 0 -0. 000
1 0 0. 0 -2 - -1 1 0 -1 -2 1 0.002 R R M t n e r r u c n o T urface P
S lot of MRR vs current, Ton
current 0 Hold Values
2 - -1
0 1
0.0005 0 1 0 0. 0 0.0 105
-2
- -1 -1
2 -1 1 0 -1 1 0 0020.
R R M ff o T n o T n o T , ff o T s v R R M f o t o l P e c a fr u S
Fig3.1. Interaction Effect of Peak
Current (Ip) and
Pulse on Time (Ton) on MRR Fig. 3.2
Interaction effect of Peak
Pulse off Time (Toff)
and Pulse on Time (Ton) on Material Removal
366 | P a g e
Ton 0Hold Values
2
- -1
0 1
.000 0 0.001
-0 . 0 02
2
- -1 -1
2 -1
1 0 1
-1 0
. 0 02
0 0 3 . 0
R R M
t n e r r u c
f f o T
urface Plot of
S MRR vs current, T off
Fig. 3.3 Interactions effect of pulse off time (Toff) and peak current (ip) on MRR
From Fig. 3.3, shows the effect of interactions of pulse off time (Toff) and peak current (ip) on MRR. The MRR
decreases with increase in the pulse off time values since pulse off time is the pause of among discharges, there
is no voltage between work piece and tool at that time so MRR decreases and increases with increase in the
Peak current values. If peak current setting is higher, larger is the discharge energy which ultimately leads to
increase MRR.
3.2 Optimization Plot
Optimal solution is calculate by Minitab and draws the plot. The starting point is serves as the optimal solution
for the plot. (Refer Table. 4). From the optimization plot it can be said that the maximum metal removal rate is
0.0012 mm3/min.
367 | P a g e
Table4. A maximum or minimum level is providing for each response characteristic, which has
to be optimized
.
Response Goal
Lower
Target
Upper
Weight
Importance
MRR
Maximum 0.00014
0.00214
1
1
Table5. Solution of table 4
ASR
Speed
MRR
Composite
Ton
T off
current
Fit
Fit
Fit
Desirability
1
0
0
0
2.14863
1.61830
0.0011783
0.418677
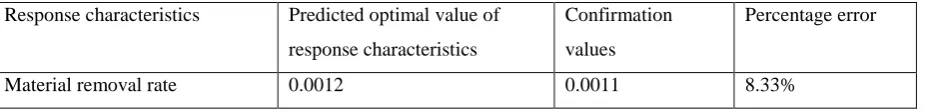
3.3 Confirmation Experiment
In the present study, RSM are derived from quadratic regression fit, so to verify their validity confirmation tests
are to be performed taking independent variables values within the range for which the formula were derived.
Table 6 shows the result of the confirmation runs and their comparisons with predicted design for MRR. It is
observed that the calculated error is small (within 10%). This confirms the reproducibility of experimental
conclusion.
Table 6 Confirmation test result and comparison with predicted result as per model.
Response characteristics Predicted optimal value of
response characteristics
Confirmation
values
Percentage error
Material removal rate 0.0012 0.0011 8.33%
IV. CONCLUSION
1. On the basis of the present experimental study, following conclusions can be drawn.
2. Wire-EDM of EN8 is feasible with zinc coated wire as electrode.
3. It shows that the Central composite design has a powerful tool for providing statistical-mathematical
models and experimental diagrams, to accomplish the experiments appropriately and economically
4. Pulse on time and peak current are the most important parameters affecting the MRR cutting speed, surface
roughness.
5. The second order regression model has obtained using RSM. It also predicts values for MRR, for different
input parameter values that are not use in the CCRD matrix.
6. The main influence on MRR is found to be Pulse on time and Pulse off time which increases and then
decreases after a certain point, even though significant influence of Current is witnessed over MRR but not
as great as Pulse on time and Pulse off time.
7. The MRR increased with Ton and the Ton has the most influence on the MRR.
368 | P a g e
REFERENCES
1. Koshy Phillip, Vain V.K. and Lal G.K. (1993), “Experimental Investigations Into Electric Discharge Machining With Rotating Disk Electrode”, Precision Engg, Vol. 15, pp. 6-15.
2. Tsai, H.C.; Yan, B.H.; Huang, F.H (2003): “EDM performance of Cr/Cu based composite electrodes”,
International Journal of Machine Tools & Manufacturing, Vol. 43, 3, pp.245–252.
3. M.T. Antar, S.L. Loo, D.K. Aspinwall, 2011, “Productivity and work piece surface integrity when WEDM aerospace alloys using coated wires” Journal of Procedia engineering, Vol. 19, pp.3-4.
4. Jatinder Kapoor, Dr. Sehijpal Singh, Dr. Jaimal Singh Khamba 2010 “Recent developments in wire electrodes for high performance WEDM” proceeding of world congress of engineers, Vol. II pp.2-7 5. Sameh S. Habib, 2009, “Study of the parameters in electrical discharge machining through response surface
methodology approach” Applied Mathematical Modeling, Vol. 33, Issue 12 pp. 4397-4407
6. Sreenivasa Rao, Venkaiah, 2013, “Review on Wire-Cut EDM Process”, International Journal of Advanced