Abstract: Tile tapping sound inspection is a process of construction quality control. Hollow sound, for instance, indicate low quality tessellation and thus voids underneath that could lead to future broken tiles. Hollow-sounding inspection was often carried out by construction specialists, whose skills and judgment may vary across individual. This paper elevates this issue and presents a Deep Learning (DL) classification method for computerized sounding tile inspection. Unlike other existing works in the area, where structural details were assessed, this study acquired tapping sound signals and analyzed them in a spectral domain by using Discrete Wavelet Transform (DWT) and Mel-frequency Cepstral Coefficients (MFCC). The dull versus hollow sounding tile were then classified based on these features by means of a Convolutional Neural Network (CNN). The experiments carried out in a laboratory tessellation indicated that the proposed method could differentiate dull from hollow-sounding tiles with very high accuracy up to 93.67%. The developed prototype can be used as guideline for devising a tiling inspection standard.
Keywords: Sounding tile, Discrete Wavelet Transform, Mel-frequency Cepstral Coefficients, Convolutional Neural Network
© Universiti Tun Hussein Onn Malaysia Publisher’s Office
IJIE
http://penerbit.uthm.edu.my/ojs/index.php/ijieThe International
Journal of
Integrated
Engineering
DWT/MFCC Feature Extraction for Tile Tapping Sound
Classification
Jantana Panyavaraporn
1*, Petcharat Limsupreeyarat
2, Paramate Horkaew
31Department of Electrical Engineering, Burapha University, Chon Buri, 20131, THAILAND 2Department of Civil Engineering, Burapha University, Chon Buri, 20131, THAILAND
3School of Computer Engineering, Suranaree University of Technology, Nakorn Ratchasima, 30000, THAILAND
*Corresponding Author
DOI: https://doi.org/10.30880/ijie.2020.12.03.016
Received 25 April 2019; Accepted 30 November 2019; Available online 27 February 2020
1.
Introduction
The growth rate of real estate business in Thailand has recently been escalating drastically, and as such contributed to great expansion in construction work of all tier contractors. Architectural work for building aesthetics such as tiling is one of the main components in residential building. Not only beauteous aspect of this work that concern the involved parties such as owner, contractor, and inspector, but its functional one is also of equally importance. However, limited supply of skilled craftsmen and experienced inspectors in the construction industry has so far led to numerous defect occurrences being reported. Especially for tiling quality inspection, inspectors normally examine tiling surface, layout pattern, tile spacing and leveling, as well as floor-tile bonding. Amongst these elements, the latter is the most important because inadequate bonding between tiles and floor may result in cracked and flaked off tiles. Eventually, these defects could lead to personal injury to those utilizing the affected area. In order to inspect the floor-tile bonding integrity, non- destructive evaluation such as the impact-acoustic method by tapping the tile surface with a small metal object such as a coin or a steel rod, is frequently implemented. Normally, an inspector would carefully listen to the tapping sound and identify the defect if they hear the lower-pitched sound, or hollow sound. This sound can indicate that there are some problems underneath the tessellation surface. For example, the tiles may have debonded from mortar bed. However, this acoustic assessment is rather subjective and much depends on experiences, skills, and judgments of an individual. Moreover, their proficiency differs, resulting in uncalibrated, non-standardized and unreliable quality inspection.
123
J Panyavaraporn et al., Int. J. of Integrated Engineering Vol. 12 No. 3 (2030) p. 122-130Existing works that studied nondestructive methods for debonded tiles inspection, for instances, include using ultrasonic echo and impact echo [1-2]. Nevertheless, both methods were not extensively implemented due to that fact that specific sensors must be suitably installed on the tile surface, which is difficult for large or high inspection area. Alternatively, Huang [3] presented a shearography method but it was expensive and highly prone to sensitivity in actual construction sites. Hung [4] has written extensive reviews on and comparison between the shearography and the active thermography methods. The latter was a surface thermal radiation measuring technique which required a controlled thermal radiation excitation to change the surface temperature. Besides the previously mentioned techniques, impact acoustics inspection was also investigated in bonding integrity of tessellation. With this approach, characteristics of acoustic signals from an examined surface tapped by a small metal object were analyzed. They were proved convenient and cost effectiveness for tile-wall bonding integrity assessment. Nonetheless, there were a few studies actually implementing such inspection system and elucidating the usefulness of this method [5-7].
MFCC has been successfully applied in both audio and speech recognition applications [8-9]. Norali [10] used MFCC for the feature extraction of EMG signal. Some other studies also combined MFCC with another signal analysis. Abdalla [11], for example, presented a speech recognition by using combined DWT and MFCC. Similarly, Mulimani [12] presented acoustic scene classification based on combined MFCC and Matching Pursuit (MP) features. Apart from sound analysis, MFCC was also applied to medical image [13]. Artificial and more recently Convolutional Neural Networks are machine learning (ML) algorithms. To date, there have been a number of studies that applied Neural Networks for general classification problems [11, 14] and especially in acoustic analysis [15-16]. Bozkurt [15], for example, proposed time-frequency features for CNN-based automatic heart sound classification. Hershey [16] presented an application of CNN architectures for large-scale audio classification.
In order to elevate the dependency on individual expertise and judgement, while resolving the standardized tiling quality inspection issue, advanced information technology (IT) could be adopted in implementing a computerized and automated tile inspection system. Therefore, this study proposes a novel approach for analyzing the acoustic signal of tile bonding integrity based on tapping sound by using DWT/MFCC feature and CNN classifier. The remaining of this paper is organized as follow. Section 2 discusses the characteristics of acoustic signal, and the detailed description of the proposed scheme. In Section 3, the experimental results and validations are reported and discussed. Finally, the concluding remark is made in Section 4.
2.
Material and Method
This paper proposed a novel method for tile tapping classification based on DWT/ MFCC feature extraction of acoustic signal and CNN classifier. The aim of this study was to differentiate between dull versus hollow sounding tiles. The tile tapping signals used in this study were acquired from tiling area at our laboratory. The proposed scheme consisted of 3 steps, which are (1) data preparation, (2) discrete wavelet transform (DWT) and Mel-frequency cepstral coefficients (MFCCs) based feature extraction, and (3) signal classification using convolutional neural network (CNN). Diagram in Fig. 1 outlines the proposed scheme, whose detailed descriptions are provided in the following subsections.
Fig. 1 - Diagram of proposed scheme
2.1
Data Preparation
The tapping sound signals involved in the following experiments were acquired from the tiling area in our laboratory, as shown in Fig. 2 (a). In Fig. 2(b), depicted the tile tapping device, whose speed (10 times per 30 seconds) was controlled by an electric motor, tapping at 9 predefined points per one tile. A total of 79 signals were sampled and
J Panyavaraporn et al., Int. J. of Integrated Engineering Vol. 12 No. 3 (2030) p. 122-130
124
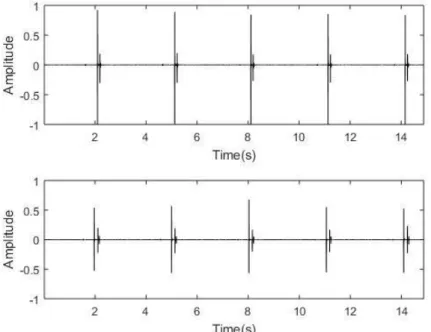
stored in .wav format. They were divided into 2 classes, namely (a) dull and (b) hollow sounding, each consisting of 46 and 33 signals, respectively. Examples of dull and hollow sounding tiles are illustrated in Fig. 3.
(a) (b)
Fig. 2 - (a) Tiling area in our laboratory; (b) Motorized control tile tapping device
Fig. 3 -Time domain representation of dull (top) and hollow (bottom) sounding tiles
2.2
Discrete Wavelet Transform
Discrete Wavelet Transform (DWT) is a linear signal transformation that operates on vectorized data. It separates signal into different frequency components. Fig. 5 shows 1-level wavelet decomposition. The 1-level DWT of input signal (x) was computed by cascading filters. Firstly, a sampled signal was passed through a low pass filter (LPF) with impulse response (g) and the resultant signal (y) was defined by a convolution:
∞
y
(
n)
=∑
x(
k)
⋅g(
n −k)
k =−∞ (1)
The signal x was decomposed simultaneously using a high-pass filter (h). As a result, the convoluted (filtered) signals contained both the approximation and detail coefficients given by low-pass and high-pass filters, respectively. Half of the frequency spectrum had however been removed from the signals. The output signals were thus subsampled by a factor of 2, as given by Eq. (2) and (3).
ylow
(
n)
=∑
x(
k)
⋅g(
2n −k)
k =−∞ (2)
1 +δk1
x
(
k)
=
∑
x(
n)
⋅W N N yhigh(
n)
=∑
x(
k)
⋅h(
2n −k)
k =−∞ (3)Fig. 4 – 1 level wavelet decomposition of a signal
2.3
MFCC Feature Extraction
The detailed analyses and description MFCC process were provided in [13], and summarized as follows:
Step 1: An input signal x(n) was first transformed into frequency domain by means of Fast Fourier Transform (FFT), given as follows: N −1 kn N (4) where W kn =e −j N 2π ; k = 0,1,..., N − 1 , n =0
x
(
k)
was the spectrum of the signal and N was signal lengthStep 2: The resultant frequency spectrum was filtered by using Mel-filter banks.
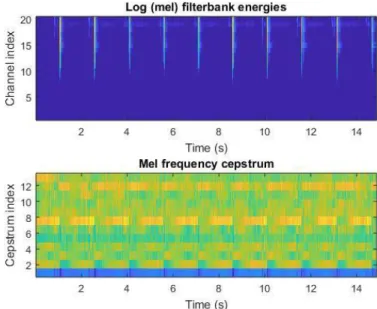
Step 3: The filter spectrum was then non-linear mapped onto a logarithmic scale as shown in Fig. 5.
Step 4: The mapped spectrum was finally transformed by Discrete Cosine Transform (DCT), as follows:
y
(
k)
=∑
x(
n)
⋅ 1 •cos2π N(
2n −1)(
k −1)
(5)n=0
Where y
(
k)
is the output signal or energy spectra and δk1 is the Kronecker delta.Fig. 5 - Example of log filter bank energy (top) and Mel-frequency cepstrum (bottom) of a hollow sound signal
The amplitudes of the resultant spectral, also called cepstral coefficients, were used to compose a feature vector for the CNN classification. However, higher order MFCCs coefficients were truncated, leaving only the first thirteen ones in this scheme. Moreover, to eliminate sample variations in each MFCC coefficient, mean and standard deviation (SD) of cepstral coefficients were calculated and used as their representatives.
∞
2
J Panyavaraporn et al., Int. J. of Integrated Engineering Vol. 12 No. 3 (2030) p. 122-130
126
2.4
Classification
Convolutional Neural Network (CNN) is one of renowned models in deep learning paradigm. The CNN learns to perform classification tasks from raw data, e.g., images, video, text, or sound, etc. Its primary favourable characteristic is an ability to directly ‘learn’ the underlying pattern without relying on any manual feature extraction. In summary, the CNN for deep learning has become increasingly popular due to three important reasons [17]:
- It eliminates the need for manual feature extraction, the features are instead learned directly by the CNN. - It yields state-of-the-art recognition results.
- It can be retrained for new recognition tasks, if new samples become available, enabling one to build on pre- existing networks.
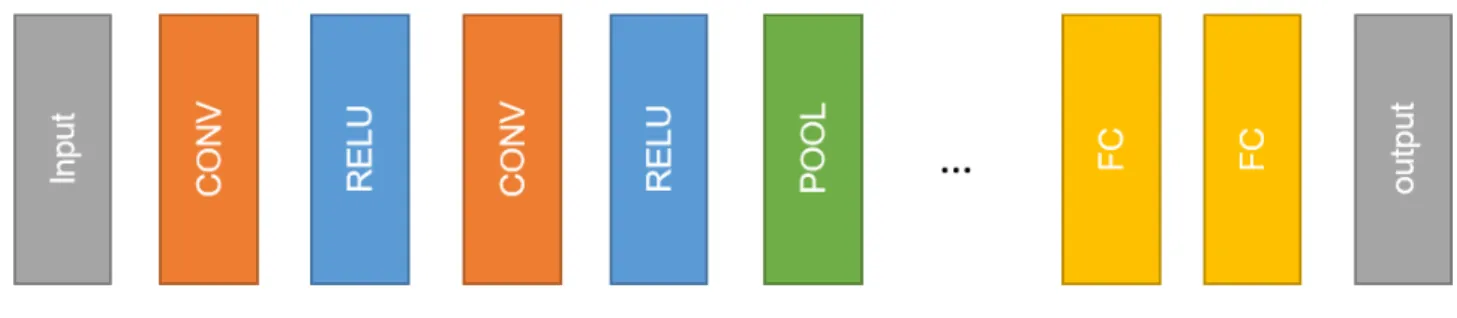
A typical CNN consists of multiple layers as shown in Fig. 6. The most common layers implemented in many studies are convolution (or CONV), rectified linear unit (or RELU), pooling (or POOL) and fully connected (or FC).
Fig. 6 - Layers configuration in a typical CNN
Functionalities of these constituting layers are given as follow:
• Convolution puts the input signal through a set of convolutional filters, each of which activates certain features
from the signal.
• Rectified linear unit allows for faster and more effective training by clamping, i.e., mapping negative values to
zero and maintaining positive values.
• Pooling simplifies the output signal by performing nonlinear down-sampling, hence reducing the number of
parameters that the network needs to learn.
• Fully Connected (FC) layer connects every neuron in one layer to every neuron in another layer. It is in
principle the same as the traditional multi-layer perceptron neural network.
In the proposed scheme, CNN was employed to classify hollow and dull sounding tile based on derived MFCC feature vectors, i.e., mean and standard deviations of extracted cepstral coefficients. In our experiment, 5 layers of CNN was configured as follows: Image Input Layer, ReLU Layer, Fully Connected Layer, Softmax Layer and Classification Output Layer.
3.
Results and Discussion
This section provided a detailed description of experimental setup and performance evaluation. The classification results derived from the proposed DWT/MFCC was benchmarked against those from MFCC [13]. Relevant discussions on the results are also provided.
3.1
Objective Evaluation
Firstly, for the numerical reports, three performance metrics were evaluated, i.e.,
• Accuracy (Ac) of the classification was defined as a ratio between the numbers signals being correctly
classified (as dull and hollow) and the total signals. It was defined by,
A
c=
n
N
where
n
is the number of correctly classified sample andN
is the total number of samples.(6)
• Specificity (also called true negative rate) measures the proportion of actual negatives that are correctly
identified as such. In this study, it was defined as the percentage of hollow-sounding tile that were correctly identified.
• Sensitivity (also called true positive rate or probability of detection) measures the proportion of actual positives that are correctly identified as such. Likewise, it was defined as the percentage of dull-sounding tile that were correctly identified.
3.2
Experimental Setup
The experiments reported herein were based on the model implemented on MATLAB. The acoustic signals used in the experiment were recorded from the tiling area at our laboratory. In this tessellation, bonding was intentionally made such that dull and hollow points were consisting with the tile mapping as shown in Fig 7. For each tile, the tapping was made nine times at predefined points. In this study, CNN was preferred as it is known for being reliable and not prone to overfitting. Since limited samples were tested, to objectively confirm its validity, the Leave-one-out cross-validation was carried out. The performance of different models that constructed features from mean, SD. and mean and SD, were assessed base on standard classifier evaluation metrics, i.e., accuracy (Acc.), sensitivity (Sen.) and specificity (Spec.).
Fig. 7 - Tiling area map
It is worth noting here that the flooring tessellation depicted in Fig. 7 experiment was restricted to single dimension (60×60 cm2). However, there are other but only limited variations sold in the market, e.g., 20×20, 30×30, and 40×40
cm2. It is therefore recommended that for each tile size, different acoustic model should be trained separately.
3.3
Benchmarking
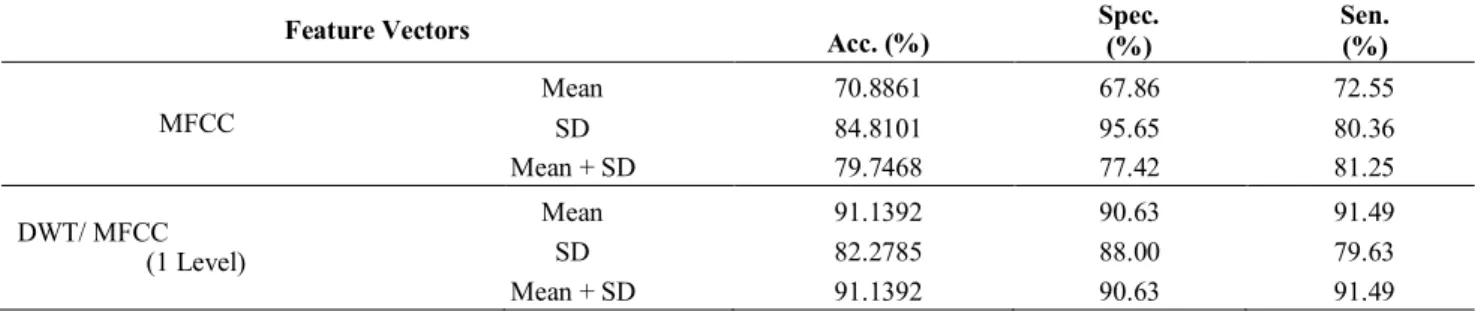
This paper proposed a novel feature extraction from acoustic tapping signal, by using combined DWT and MFCC. To validate the proposed method, the feature extraction results were compared against those obtained by using only MFCC as shown in Table 1. The experiment was completed by employing 1-level Haar wavelet decomposition. The results clearly indicated that the DWT/ MFCC feature gave higher classification accuracy than the MFCC one.
Table 1 Comparison between MFCC and DWT/MFCC in terms of accuracy, sensitivity and specificity
Feature Vectors Acc. (%) Spec. (%) Sen. (%)
Mean 70.8861 67.86 72.55 MFCC SD 84.8101 95.65 80.36 Mean + SD 79.7468 77.42 81.25 DWT/ MFCC (1 Level) Mean 91.1392 90.63 91.49 SD 82.2785 88.00 79.63 Mean + SD 91.1392 90.63 91.49
J Panyavaraporn et al., Int. J. of Integrated Engineering Vol. 12 No. 3 (2030) p. 122-130
128
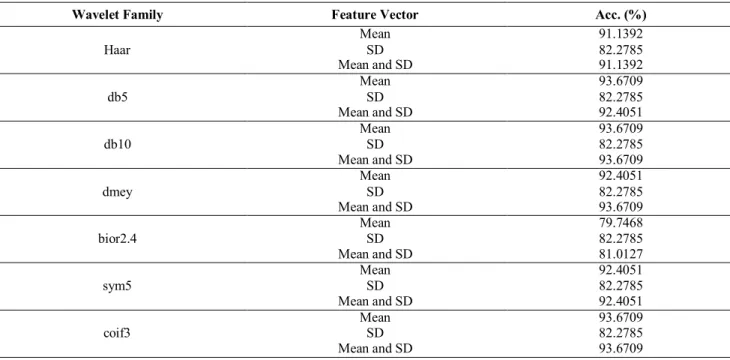
Fig. 8 shows the effect of different levels of wavelet decomposition on classification accuracy. It is evident from the graph that as the decomposition level increased, the accuracy decreased. Therefore, it was implied that the proposed one-level decomposition was the most optimal. In the literature, different basis functions, also known as wavelet families, were found implemented. They were Daubechies (dbN), Discrete Meyer (dmey), Biorthogonal (biorNr.Nd), Symlets (symN) and Coiflets (coifN). In these acronyms, N indicated the orders. Biorthogonal family had different decomposition (Nd) and reconstruction (Nr) order. Table 2 shows comparison of classification accuracy between different wavelet families. In this table, the classification accuracy was calculated using 1-level decomposition. It can be noted that the Daubechies, Coiflets or Discrete Meyer families performed better than the other wavelet families.
Fig. 8 - Comparison of the classification accuracy among different levels of wavelet decomposition Table 2 Comparison of the classification accuracy among different wavelet families (mothers wavelet)
Wavelet Family Feature Vector Acc. (%)
Mean 91.1392 Haar SD 82.2785 Mean and SD 91.1392 Mean 93.6709 db5 SD 82.2785 Mean and SD 92.4051 Mean 93.6709 db10 SD 82.2785 Mean and SD 93.6709 Mean 92.4051 dmey SD 82.2785 Mean and SD 93.6709 Mean 79.7468 bior2.4 SD 82.2785 Mean and SD 81.0127 Mean 92.4051 sym5 SD 82.2785 Mean and SD 92.4051 Mean 93.6709 coif3 SD 82.2785 Mean and SD 93.6709
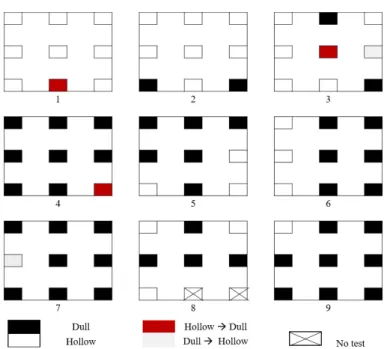
The confusion matrix of the proposed method using 1-level decomposition of Daubechies10 family wavelet is shown in Fig .9. Fig 10 shows the corresponding tiling map, recognized by the respective classification. In this figure, the red and grey points indicated incorrect assessments.
Actual class Dull Hollow Predicted
class Hollow Dull 44 3 30 2
129
4.
Summary
A novel computerized tapping sound classification scheme for computerized tile inspection was proposed. Inspired by the preceding success on classification based on MFCC features [13], an enhancement by incorporating DWT into feature extraction, i.e., DWT/ MFCC, were used. In addition, a recently emerging deep learning paradigm, called CNN was also employed as a classifier. The experiments reported herein demonstrates that the implemented system was able to classify dull and hollow sounding tile at high accuracy, sensitivity and specificity rates of 93.67%, 93.75% and 93.63%, respectively. It was also found that the wavelet families (bases) suitable for such application were Daubechies, Coiflets or Discrete Meyer. It was therefore anticipated that the proposed system could serve as a guideline for devising a standard for automated tiling inspection in future. Future investigation worth considered encompass investigation on model variations given different tile dimensions, thicknesses and materials, considering GridSearch to optimize hyperparameter, noise removal strategies, exhaustive comparison between different CNN realizations as well as other non-deep learning machines (e.g., SOM, SVM, K-Mean, etc.), and comparative experiments different combination of feature extraction and machine learning against the proposed DWT/ MFCC and CNN.
Fig. 10 - Tile map recognized by the proposed method with Daubechies10
Acknowledgement
The authors would like to acknowledge the Burapha University, Chon Buri and Suranaree University of Technology, Nakorn Ratchasima.
References
[1] Van Yang, S., Gu, L., & Gibson, R. F. (2001). Nondestructive of weak joints in adhesively bonded composite structures. Composite Structures, 51, 63-71.
[2] Mori, K., & Spagnoli. A. (2002). A new non-contacting non-destructive testing method for defect detection in concrete. NDT & E International, 35, 399-406.
[3] Huang, Y. H., & et al. (2009). NDT & E using shearography with impulsive thermal stressing and clustering phase extraction. Optics and Lasers in Engineering, 47, 774-781.
[4] Hung, Y. Y., & et al. (2009). Review and comparison of shearography and active thermography for nondestructive evaluation. Materials Science and Engineering: R: Reports, 64, 73-112.
[5] Luk, B. L., Liu, K. P., Tong, F. & Man, K.F. (2010). Impact-acoustics inspection of tile wall bonding integrity via wavelet transform and hidden Markov models. Journal of Sound and Vibration, 329, 1954-1967.
[6] Asano, M., Kamada, T., Kunieda, M., & Rokugo, K. (2003). Impact acoustics methods for defect evaluation in concrete. International Symposium Non-Destructive Testing in Civil Engineering.
[7] Tong, F., Xu, X.M., Luk, B.L. and Liu, K.P. (2008). Evaluation of tile - wall bonding integrity based on impact acoustics and support vector machine. Sensors and Actuators A: Physical, 144, 97-104.
[8] C. K. On, P.M. Pandiyan, & S.Yaacob (2006). Mel-frequency cepstral coefficient analysis in speech recognition. International Conference on Computing & Informatics, 1-5.
J Panyavaraporn et al., Int. J. of Integrated Engineering Vol. 12 No. 3 (2030) p. 122-130
130
[9] Al-Anzi, F. S., & AbuZeina, D. (2017). The Capacity of Mel Frequency Cepstral Coefficients for Speech
Recognition. International Norali, A.N. & et al. (2017). Human Breathing Classification Using Electromyography Signal with Features Based on Mel-Frequency Cepstral Coefficients. International Journal of Integrated
Engineering -Special Issue on Electrical Electronic Engineering, 9(4), 85-92.
[10] Abdalla, M. I., Abobakr, H. M., & Gaafar, T.S. (2013). DWT and MFCCs based Feature Extraction Methods for Isolated Word Recognition, International Journal of Computer Applications, 69, 21-26.
[11] Mulimani, M., & Koolagudi, S. G. (2016). Acoustic scene classification using MFCC and MP features. Detection and Classification of Acoustic Scenes and Events, Budapest, Hungary.
[12] Panyavaraporn, J., & Horkaew, P. (2018). Classification of Alzheimer’s disease in PET scan using MFCC and SVM. International Journal on Advanced Science Engineering Information Technology, 8, 1829-1835.
[13] Ismail, A. & et al. (2019). Improving Convolutional Neural Network (CNN) architecture (miniVGGNet) with Batch Normalization and Learning Rate Decay Factor for Image Classification. International Journal of Integrated Engineering, 11(4), 51-59.
[14] Bozkurt, B., Germanakis, L., & Stylianou, Y. (2018). A study of time-frequency features for CNN-based automatic heart sound classification for pathology detection. Computers in Biology and Medicine, 100, 132-143. [15] Hershey, S. & et al. (2017). CNN architectures for large-scale audio classification. IEEE International Conference
on Acoustics, Speech and Signal Processing, LA, USA.
[16] Convolutional Neural Network. retrieved on 10th Dec 2018 from http://www.mathworks.com/solutions/deep- learning/convolutional-neural-network.html”