CHOLERA PREVENTION AND CONTROL IN KENYA
Gretchen A. Cowman
A dissertation submitted to the faculty of the University of North Carolina at Chapel Hill in partial fulfillment of the requirements for the degree of Doctor of Public Health in the Department of Health Policy and Management in the Gillings School of Global Public Health.
Chapel Hill 2015
© 2015
ABSTRACT
Gretchen A. Cowman: Cholera Prevention and Control in Kenya (Under the direction of Harsha Thirumurthy)
Kenya experienced widespread cholera outbreaks in 1997-1999 and 2007-2010. The reemergence of cholera in Kenya in the first months of 2015 suggests that cholera remains a public health threat. This study employed a mixed methods approach to investigate the
successes and challenges of cholera prevention and control in Kenya through analysis of cholera surveillance data and key informant interviews. The goal of this study was to produce
information that will be useful to the Government of Kenya in establishing or strengthening policies and programs that effectively prevent and control cholera.
Key findings from analysis of cholera surveillance data indicate: (1) cholera has been recurrent in various geographic regions with differing climatic conditions, (2) cholera has affected some of the least densely populated rural areas as well as Kenya’s largest cities, and (3) cholera occurrence appears to be associated with open defecation, access to improved sanitation, access to improved water sources, poverty, and level of education.
large proportion of the population, (2) limited laboratory capacity to diagnose cholera, and (3) poor availability of intravenous fluids and oral rehydration solution.
To my mother, Norma Cowman, and my brother, Paul Cowman In memory of my father, Richard Cowman
ACKNOWLEDGEMENTS
I am grateful to those who provided guidance and support during my doctoral studies. From the Ministry of Health I am thankful to my co-investigator, Dr. Shikanga O-tipo, for his valuable contributions to this study. I am thankful to Dr. Ian Njeru and Dr. William Maina for their leadership support of this study and to David Mwangi and Annastacia Muange for
TABLE OF CONTENTS
LIST OF TABLES………..……….x
LIST OF FIGURES ... xi
LIST OF ABBREVIATIONS ... xii
CHAPTER 1: INTRODUCTION ... 1
Statement of the issue ... 1
Background ... 3
Environmental reservoirs and climatic factors ... 3
Risk factors and control measures ... 4
Cholera and the International Health Regulations ... 5
Cholera occurrence: Global and regional trends ... 6
Kenya ... 6
National policies and strategies relevant to cholera prevention and control ... 9
The research question and significance ... 13
CHAPTER 2: LITERATURE REVIEW ... 15
Cholera in Kenya from a global and continental perspective ... 16
Climate and ecology ... 17
Causative organism ... 21
Outbreak investigations ... 22
Influence of social and cultural factors ... 27
Review of surveillance data ... 31
Discussion ... 34
CHAPTER 3: METHODS ... 39
Theoretical framework ... 39
Quantitative investigations ... 41
Variables and data sources ... 42
Data management and analysis ... 47
Key informant interviews ... 49
Study population ... 50
Data collection procedures ... 51
Data management and analysis ... 52
Ethical considerations ... 54
CHAPTER 4: RESULTS ... 56
Quantitative investigations ... 56
Key findings ... 57
Descriptive statistics ... 58
Geographic patterns of cholera occurrence ... 59
Relationship between cholera occurrence and development and demographic indicators .. 64
Key informant interviews ... 71
Descriptive analysis ... 71
Key findings ... 72
Other considerations ... 97
CHAPTER 5: DISCUSSION ... 103
Cholera and water ... 103
Cholera and sanitation... 104
Cholera in refugee settings ... 107
Cholera and poverty ... 108
Implications for case management... 108
Limitations of the study ... 109
CHAPTER 6: POLICY IMPLICATIONS AND THE PLAN FOR CHANGE ... 112
Contextual parameters, resources, and key players ... 113
Devolution, a key contextual parameter ... 114
The Global Health Security Agenda, a key contextual parameter ... 115
Recommendations ... 116
The plan for change ... 126
Conclusion ... 133
APPENDIX A: DISTRICTS, COUNTIES, PROVINCES, AND CONSTITUENCIES ... 135
APPENDIX B: KEY INFORMANT INTERVIEW GUIDE ... 141
APPENDIX C: RECRUITMENT LETTER FOR KEY INFORMANT INTERVIEWS ... 145
APPENDIX D: INFORMED CONSENT FORM ... 146
APPENDIX E: TRENDS IN CHOLERA INCIDENCE IN SELECTED COUNTIES OF KENYA, 2004-2013 ... 150
APPENDIX F: SCATTERPLOTS OF CUMULATIVE CHOLERA INCIDENCE VERSUS DEVELOPMENT AND DEMOGRAPHIC INDICATORS ... 151
APPENDIX G: LIST OF KEY INFORMANTS PARTICIPATING IN INTERVIEWS ... 153
LIST OF TABLES
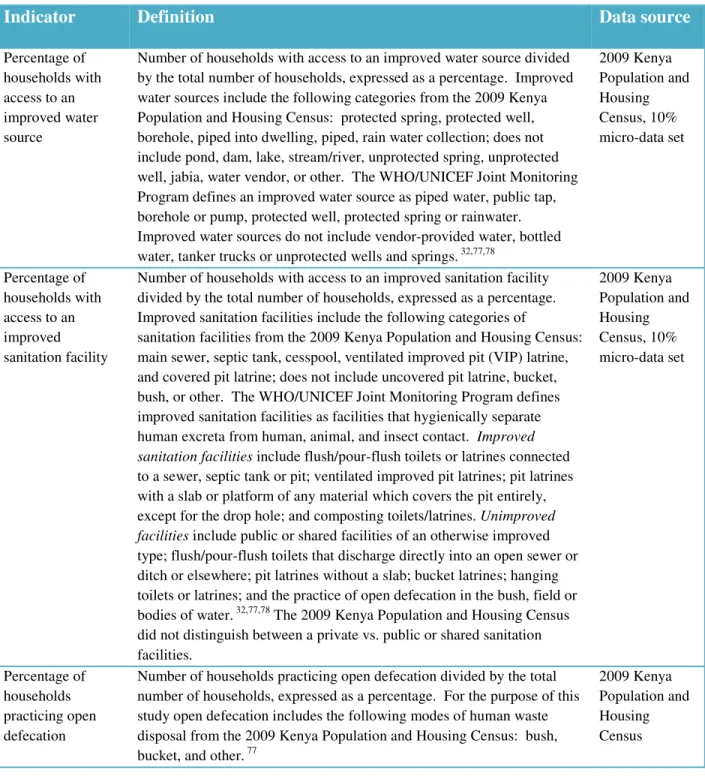
Table 1. Key health and socioeconomic indicators, Kenya ... 7 Table 2. Development and demographic indicators with their definitions
and data sources ... 44 Table 3. Range of values, Pearson’s correlation coefficient, and P-values of
development and demographic indicators included in the regression analysis ... 65 Table 4. Results of zero-inflated poisson regression, Kenya, 2008-2013, n=137 districts ... 67 Table 5. Correlation of cholera case-fatality rate with selected development
and demographic indicators, Kenya, 2008-2013, n=50 districts ... 70 Table 6. Participant profile by type of organization for key informant interviews ... 72 Table 7. Key findings from key informant interviews ... 73 Table 8. Summary of perceived successes, challenges, and recommendations
LIST OF FIGURES
Figure 1. Map of Kenya ... 6
Figure 2. Counties of Kenya ... 12
Figure 3. Ecological model of factors influencing cholera occurrence and death ... 40
Figure 4. Cholera incidence in Kenya, 2004-2013 ... 58
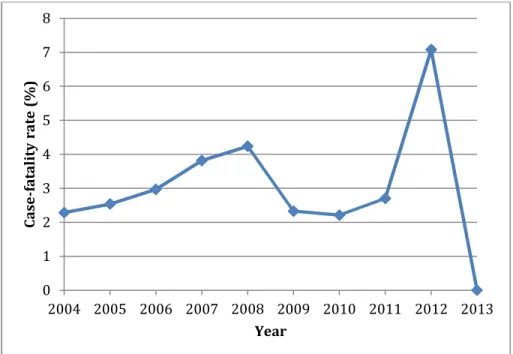
Figure 5. Cholera case-fatality rate in Kenya, 2004-2013 ... 59
Figure 6. Cholera incidence in Turkana County, Kenya, 2004-2013 ... 60
Figure 7. Cholera incidence in Busia County, Kenya, 2004-2013 ... 60
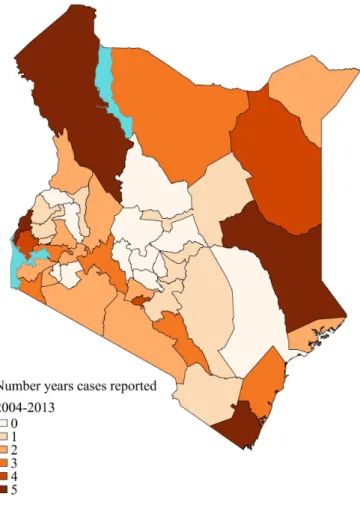
Figure 8. Number of years in which cholera cases were reported in Kenya by county, 2004-2013 ... 62
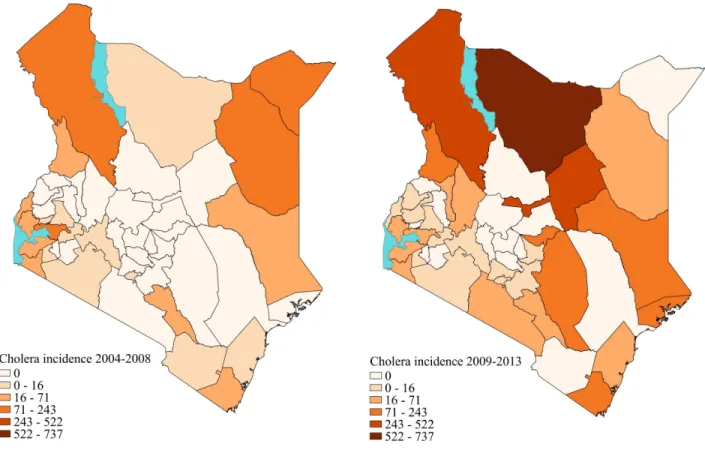
Figure 9. Geographic patterns of cholera occurrence in Kenya, 2004-2008 and 2009-2013 ... 64
LIST OF ABBREVIATIONS
CDC Centers for Disease Control and Prevention CFR case-fatality rate
CHW community health worker
CLTS Community Led Total Sanitation DRC Democratic Republic of Congo
DSRU Disease Surveillance and Response Unit
EAIDSNet East African Integrated Disease Surveillance Network HIV Human Immunodeficiency Virus
ICC inter-agency coordinating committee
ICT information and communication technology IDSR Integrated Disease Surveillance and Response IHR International Health Regulations
IRB Institutional Review Board
IV intravenous
JMP Joint Monitoring Program
KEMSA Kenya Medical Supplies Authority
KIHBS Kenya Integrated Household Budget Survey KNBS Kenya National Bureau of Statistics
MDG Millennium Development Goal
MOH Ministry of Health
NOAA National Oceanic and Atmospheric Administration OCV oral cholera vaccine
ODF open defecation free ORS oral rehydration solution ORT oral rehydration therapy
ProMED Program for Monitoring Emerging Diseases
SES socio-economic status
SLIPTA Stepwise Laboratory Improvement Process Towards Accreditation SLMTA Strengthening Laboratory Management Towards Accreditation SWAP Safe Water and AIDS Project
UN United Nations
UNHCR United Nations High Commissioner for Refugees UNICEF United Nations Children’s Fund
USAID United States Agency for International Development VIP ventilated improved pit
WASH water, sanitation and hygiene
WESCOORD Water and Environmental Sanitation Coordination WHO World Health Organization
WHO AFRO World Health Organization African Regional Office WSP Water and Sanitation Program
CHAPTER 1: INTRODUCTION
Statement of the issue
Cholera is an epidemic-prone disease of global significance that has a prominent role in the history of public health. John Snow, considered by many to be the father of modern
epidemiology, is well known for his work in identifying drinking water from the Broad Street pump as the source of a cholera outbreak in London in 1851. Since John Snow’s time, much has been learned about the causative agent, the mode of transmission, and methods of preventing the spread of cholera. This infectious disease has been virtually eliminated from developed
countries due to improved water and sanitation infrastructure, but deadly cholera outbreaks still occur in many low-income countries including Kenya.
Globally, there was a continual increase in the number of cholera cases reported to the World Health Organization (WHO) between 2007 and 2011. 1 In 2011 the World Health Assembly issued resolution 64.15 recognizing that cholera is not being sufficiently addressed and calling for renewed global efforts in cholera prevention and control. 2 A 58% decline in the number of cholera cases reported to WHO globally in 2012 and a further decline of 47% in 2013 may suggest some progress in the global response to this disease. 3,4
Statistics (KNBS) population projections). 6,7 Incidence is defined as “the occurrence of new cases of disease that develop in a candidate population over a specified time period.” 8 This 71% decrease may suggest improved cholera prevention and control in more recent years. Between 2011 and 2013 there were few cases of cholera reported in Kenya, and these cases were limited to a relatively small geographic area in northeastern Kenya. This may reflect success in cholera prevention and control efforts or perhaps this may be explained by others factors such as climatic conditions. This study investigates the successes and challenges of cholera prevention and control efforts in Kenya.
An understanding of past successes and current challenges is important to informing future cholera prevention and control efforts in Kenya. This topic was explored through key informant interviews with individuals engaged in cholera prevention and control efforts in Kenya. This study also examined cholera surveillance data to investigate:
• The geographic distribution of cholera occurrence in Kenya and whether there have been changes in this distribution over time
• The relationship between cholera occurrence and development and demographic indicators related to water, sanitation, education, income, and urbanization
for the design of programs to reduce the burden of cholera. This study investigated the relationship between selected development indicators and cholera occurrence in Kenya.
This study aimed to identify best practices in Kenya that should be maintained and that may be of relevance to other countries that are combating cholera. This study also aimed to identify areas for improvement and proposed solutions. The goal of this study was to produce information that will be useful to the Government of Kenya and its partners in establishing or strengthening policies and programs that effectively prevent and control cholera.
Background
Cholera is a diarrheal disease caused by the bacteria Vibrio cholerae. The infectious agent is acquired through consumption of contaminated water or food. The source of
contamination is usually the feces of an infected person. Most cases are asymptomatic or exhibit only mild diarrhea; however, severe cases are characterized by sudden onset of profuse, watery diarrhea, nausea, and vomiting. Severe symptoms lead to rapid dehydration, which can result in death within hours if left untreated. The most common method of treatment is administration of oral rehydration solution (ORS); more severe cases may require intravenous rehydration and antibiotics. 9
Environmental reservoirs and climatic factors
Vibrio cholerae is known to persist in brackish waters, coastal waters and estuarine
satellite remote sensing of environmental conditions to develop an early warning system for cholera outbreaks is based upon the emerging knowledge about links between ocean
temperatures, phytoplankton growth, and cholera occurrence. In the Great Lakes region of East and Central Africa, Bompangue et al. observed that cholera occurrence increased during years of El Niño events. 13
Risk factors and control measures
Cholera spreads rapidly in environments where there is lack of access to safe drinking water, inadequate sanitation, poor hygiene, and crowded living conditions. 9 Outbreaks are often associated with man-made and natural disasters that result in large-scale population movements and overcrowded refugee camps. 9 Studies have found associations between cholera occurrence and access to improved water, access to improved sanitation, socioeconomic status, and infant mortality rate. 14-17
not considered to be effective after an outbreak has started, unless the vaccination campaign is targeted at other well defined, high risk populations not yet affected by the outbreak. 18
Cholera and the International Health Regulations
Cholera has a prominent role in the historic development of international agreements to prevent cross-border spread of infectious diseases. The International Sanitary Conventions that arose in the 1800s are the earliest precursor to the modern-day International Health Regulations. The first International Sanitary Convention in 1851 was prompted by the need to control the spread of epidemic cholera in Europe. 19 International efforts to control the spread of infectious diseases were later formalized in the 1951 International Sanitary Regulations, which required mandatory reporting of cholera, yellow fever, plague, small pox, typhus, and relapsing fever cases. The International Sanitary Regulations were replaced in 1969 by the International Health Regulations (IHR), which continued to mandate reporting of cholera, yellow fever, and plague cases.
There were major revisions to the IHR in 2005 aimed at improving prevention of the international spread of disease in a manner that avoids unnecessary interference with
international trade and travel. 20 The 2005 revisions greatly expand the range of diseases covered by the regulations by requiring notification to WHO of “all events which may constitute a public health emergency of international concern”. 20 The IHR 2005 removed mandatory reporting of cholera cases, although many cases will still be reported under the criterion of a public health emergency of international concern. The IHR 2005 requires member states to develop,
Cholera occurrence: Global and regional trends
The world is currently experiencing the 7th cholera pandemic. The pandemic began in Indonesia in 1961, spread to the Asian mainland in 1963, reached Africa in 1970, and spread to Latin America in 1991. 9 The disease is now endemic in several African countries. Between 2007 and 2011 there was a continual increase in the number of cholera cases reported to WHO. 1 In 2011 WHO recorded 589,854 cholera cases globally, including 7,816 deaths, reported by 58 countries. 1 In 2012 the global number of reported cases declined by 58% to 245,393 including 3,034 deaths. 3 In 2013 the number of reported cases declined by an additional 47% to 129,064 including 2,102 deaths. 4 There is uncertainty in how well these figures represent reality, however, as vast under-reporting of cholera is suspected, and WHO estimates the actual global burden of disease to be 3-5 million cases annually. 2
Between 2001 and 2009 African countries accounted for 93% - 98% of all reported cholera cases worldwide. This percentage decreased to 32% - 48% between 2010 and 2013 due to a large outbreak in Haiti. 1,4 In 2009 several
countries in Africa, including Kenya, experienced large cholera outbreaks. A total of 217,333 cholera cases were reported from Africa in 2009. 21 The number of reported cases in Africa declined to 56,329 in 2013. 4
Kenya
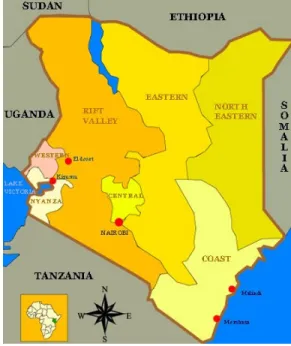
Kenya is located along the equator on the coast of East Africa and shares borders with Tanzania, Uganda, Sudan, Ethiopia, and Somalia
Figure 1. Map of Kenya
(Figure 1). The climate is characterized by slight seasonal variations in temperature and conditions ranging from tropical on the coast, cool in the highlands, and arid or semi-arid in much of the interior. Kenya has two rainy seasons that typically occur from April to June and from October to December. Lake Victoria is located in the western part of the country and supports a number of fishing communities. There are large refugee camps at Dadaab in the northeast of the country near the border with Somalia and at Kakuma in the northwest of the country near the border with Sudan. Kenya has a population of 41.6 million (2011 figure). 23 Key health and socioeconomic indicators are provided in Table 1 with a comparison to global averages and averages for the WHO African region (excludes Morocco, Tunisia, Libya, Egypt, Sudan, and Somalia). 24
Table 1. Key health and socioeconomic indicators, Kenya
Indicator Kenya Global average Africa average
Life expectancy at birth (years), 2011
58 for males 61 for females
68 for males 72 for females
55 for males 58 for females Infant mortality rate (per 1000 live
births), 2011
48 37 68
Under 5 mortality rate (per 1000 live births), 2011
73 51 107
Per capita government expenditure on health (PPP int. $), 2010
29 599 73
Per capita total expenditure on health (PPP int. $), 2010
72 1,017 154
Number of nurses and midwives (per 10,000 population), 2005-2012
7.9 29 9.1
Number of doctors (per 10,000 population), 2005-2012
1.8 13.9 2.5
Population using improved drinking water sources (%), 2011
61 89 64
Population using improved sanitation facilities (%), 2011
29 64 34
Literacy rate among adults aged ≥15 years (%), 2005-2011
87 84 63
Per capita gross national income (PPP int. $), 2011
Kenya has routinely reported cases of cholera to WHO since 1971. The largest recorded cholera epidemic in Kenya began in 1997 and lasted through 1999, with more than 50,000 cases notified to WHO. 25 This epidemic is believed to have started along Lake Victoria near the Tanzania border. Between 2000 and 2007 the number of cases reported to WHO annually ranged from 0 to 1,206 (with cases reported each year except 2003). Another large epidemic occurred between 2008 and 2010, with 17,704 cases notified to WHO during this period. Cholera was widespread in the country affecting at least 7 out of 8 provinces. In 2011 there was a dramatic drop in the number of notified cases to 74 in comparison to 3,188 cases in 2010. 6 This downward trend continued with no cases reported to WHO in 2012 and 2013. 3,4
Accurate identification of cholera cases can be a challenge. A typical identifying
symptom is watery diarrhea, but a number of enteric pathogens other than V. cholerae can cause watery diarrhea, especially in children under 5 years of age. 26 Laboratory confirmation is therefore critical to accurately identify cholera outbreaks. Laboratory capacity and networks are weak in many African countries, including Kenya. The standard case definition for cholera in Kenya is:
Suspected case: If there is no cholera epidemic, any patient aged 5 years or more presenting with acute, profuse, effortless, watery diarrhea (3 or more times within 24 hours). If there is a cholera epidemic, a suspected case is any person aged 2 years and above with acute watery diarrhea, with or without vomiting.
Confirmed case: A suspected case in which Vibrio cholerae O1 or O139 has been isolated in the stool, or has been epidemiologically linked to a confirmed case. 26 Kenya’s case definition differs from WHO’s standard case definition for cholera which states:
A case of cholera should be suspected when:
• In an area where the disease is not known to be present, a patient aged 5 years or more develops severe dehydration or dies from acute watery diarrhea.
• In an area where there is a cholera epidemic, a patient aged 5 years or more develops acute water diarrhea, with or without vomiting.
patient with diarrhea. 27
National policies and strategies relevant to cholera prevention and control
Kenya has a number of health-related laws, policies, and strategies with relevance to cholera prevention and control. The legal and regulatory framework for public health in Kenya is established in the Public Health Act Chapter 242. This act was initially passed by parliament in 1921 and has been subject to multiple amendments over the years.
The legal and regulatory framework for the water and sanitation sector in Kenya is established in the Water Act of 2002. In 2007 the Ministry of Health issued the National Environmental Sanitation and Hygiene Policy. This policy sets the ambitious goal of access to “hygienic, affordable, functional, and sustainable toilet and hand washing facilities” in “every school, institution, household, market, and other public place” by 2015. 28 In 2007 Plan Kenya introduced the Community Led Total Sanitation (CLTS) approach in selected rural communities. This approach aims to mobilize communities to eliminate open defecation and promotes hygiene practices like hand washing. 29 In 2010 the Ministry of Public Health and Sanitation, in
partnership with UNICEF and SNV, pilot tested CLTS in 6 districts in Western Kenya. 30 The Ministry subsequently adopted CLTS as its strategy for eliminating open defecation and launched a campaign in 2011 to declare Kenya open defecation free (ODF) by 2013. This campaign was re-launched in 2012, reportedly due to lack of progress since the initial campaign launch. 31
With respect to MDGs related to water and sanitation, Kenya has made more progress in access to improved water than sanitation. The WHO/UNICEF Joint Monitoring Program (JMP) defines an improved water source as piped water, public tap, borehole or pump, protected well, protected spring or rainwater. 32 Between 1990 and 2012 the percentage of the population that
defined as facilities that hygienically separate human excreta from human, animal, and insect contact. This includes flush/pour-flush toilets or latrines connected to a sewer, septic tank or pit; ventilated improved pit latrines; pit latrines with a slab or platform of any material which covers the pit entirely except for the drop hole; and composting toilets/latrines. 32 Only modest
improvements have been seen in Kenya with respect to sanitation. The percentage of the
population using improved sanitation facilities increased from 25% in 1990 to 30% in 2012. The percentage of the population practicing open defecation decreased from 19% in 1990 to 13% in 2012. 33
At the 2012 Sanitation and Water for All High Level Meeting convened by UNICEF, the Government of Kenya made the following commitments 34:
1. Harmonize water and sanitation monitoring tools
2. Sustain a budgetary allocation increment of 40% per year in the water subsector 3. Engage in dialogue with partners to support urban sanitation programs
4. Include hand washing with soap and household water treatment in current ODF Rural Kenya 2013 campaign
5. Improve knowledge management, networking, harmonization and evidence based advocacy for increased resource allocation to sanitation among others, through better coordination led by the Interagency Coordination Committee
6. Allocate adequate resources to implement the ODF Rural Kenya 2013 campaign
Kenya’s 2013 progress update on these commitments indicates “good progress” on commitments 2, 3, 5, and 6, and “slow progress” on commitments 1 and 4. 34
strategy in the National Health Sector Strategic Plan II. The community strategy aims to enhance community access to health care and to strengthen household and community
participation in health and health-related development issues. A cornerstone of this strategy is community health workers (CHWs), who provide primary health care services at household and community level. 35,36
Kenya adopted the WHO African Regional Office (WHO AFRO) Integrated Disease Surveillance and Response (IDSR) strategy that was introduced in 1998 as a means of improving disease surveillance and response to epidemics. By 2002 Kenya had formally issued IDSR Technical Guidelines to guide district-based, national surveillance for priority diseases in accordance with the IDSR strategy. Published studies from other African countries document improvements in surveillance and response as a result of implementation of this strategy. 37,38 Kenya is also implementing the International Health Regulations (IHR) 2005, which calls upon all countries to strengthen surveillance and response capacities. The goal of both IDSR and IHR 2005 is to strengthen national surveillance and response capacity.
and sanitation strategy. This 5-year plan includes a budget estimate of $12.6 million for implementation.
There have been significant changes in the administration of health, water, and sanitation services since the plan was written in 2011. Prior to March 2013 national ministries had a prominent role in coordination of these services through provincial government structures. The country was divided into 8 provinces: Coast,
Northeastern, Eastern, Central, Rift Valley, Western, Nyanza, and Nairobi (Figure 1). Initially the provinces
were composed of 46 administrative districts plus the City of Nairobi. The number of districts varied over time, rising to 254 in 2009. In March 2013 as part of implementation of Kenya’s new constitution, 47 county governments were established with boundaries matching those of the original 46 districts plus Nairobi at independence (Figure 2). Responsibility for administration and delivery of health, water, and sanitation services has been devolved to these county
governments. Another change that has taken place since development of the current cholera prevention and control plan is that the Ministry of Public Health and Sanitation, which took the lead in development of the plan, has since been merged with the Ministry of Medical Services to create one Ministry of Health.
Since 2011 Kenya has experienced a dramatic decline in the number of reported cholera cases. This raises some intriguing questions. Can this be attributable to particular interventions, policies, or strategies like increased access to improved drinking water sources, the ODF Rural Kenya campaign with its CLTS approach, the community strategy, IDSR, or the country’s
cholera prevention and control plan? Or have the climatic conditions simply not been favorable to foster an outbreak in the past few years? This study will solicit expert opinion on the role that interventions, policies, and strategies have had on cholera prevention and control in Kenya.
The research question and significance
Much is known about the general mechanisms of cholera transmission and effective interventions for prevention and control of this disease. Despite the vast body of knowledge on cholera, including studies specific to cholera occurrence in Kenya, prevention and control of this disease remains a challenge in many countries. The question persists of how to translate the scientific understanding of cholera into effective policies and strategies that can be successfully implemented in limited resource settings to protect the population from cholera.
There is no published literature investigating the successes and challenges of policies and strategies related to cholera prevention and control in Kenya. This study seeks to identify policies and strategies that have successfully supported cholera prevention and control and to identify opportunities for strengthening such efforts in Kenya. This information is intended to support the Government of Kenya’s efforts in reducing the burden of this disease.
The main research question for this study is: What are the successes and challenges of cholera prevention and control in Kenya? Supporting sub-questions that were investigated are:
• What is the geographic distribution of cholera occurrence in Kenya, and have there been
changes in this distribution over time?
• What is the relationship between cholera occurrence and development and demographic
The specific aims of this study are to:
1. Qualitatively describe the perceived successes and challenges of cholera prevention and control in Kenya as identified by key informants from the Kenyan government and other organizations supporting cholera activities in Kenya. The specific topic areas of
investigation include interventions, policies and strategies, data for decision-making, communication and coordination, Kenya’s cholera prevention and control plan, and devolution.
2. Describe the geographic patterns of cholera occurrence in Kenya by analyzing trends in cholera occurrence and endemic status over time by geographic region.
3. Demonstrate whether or not there is an association between cholera occurrence and selected development and demographic indicators measured at district level.
CHAPTER 2: LITERATURE REVIEW
The literature review was designed to capture published, peer-reviewed research articles on cholera in Kenya and additional articles of relevance from the East Africa region. A search was conducted in PubMed and Global Health on June 16, 2013 using the following search string: cholera AND (kenya OR east africa). The search was saved in PubMed, and automatic
notification was set up for identification of any new articles detected by these search terms. The initial search returned 226 citations in PubMed and 191 citations in Global Health. Subsequent PubMed notifications added 24 more citations by February 15, 2015 when the literature review was completed. An additional 2 articles with a global or Africa-wide scope were identified through review of the global cholera literature. Upon removing duplicates, 364 unique citations remained. After reviewing abstracts, 42 citations were selected for a review of the full article. The criteria used for inclusion of an article in the review were: 1) the article describes a research study on cholera and 2) Kenya is included in the geographic scope of the study OR the
geographic setting is in a nearby East African country and the theme of the article suggests potential relevance to Kenya. A review of full articles yielded 29 articles for inclusion in the literature review. The following information was extracted from each article into a standard template:
• Title, authors, journal, year of publication
• Geographic scope
• Type of study design
• Timeframe
• Independent variables
• Data sources
• Key findings
Review of the published literature indicates that the epidemiology of cholera in Kenya is likely influenced by complex interactions among multiple environmental and human factors. The results of the review are organized into the following thematic areas: cholera in Kenya from a global and continental perspective, climate and ecology, causative organism, outbreak
investigations, influence of social and cultural factors, interventions, and review of surveillance data.
Cholera in Kenya from a global and continental perspective
The published literature includes informative articles that review cholera outbreaks worldwide and Africa-wide. Griffith et al. analyzed cholera outbreak reports in ProMED-Mail, an online forum for the sharing of outbreak information administered by the International Society for Infectious Diseases, over the period 1995 to 2005. 40 Out of 1,798 cholera postings, they identified 632 unique outbreaks worldwide. Outbreaks in East Africa accounted for 20.1% of the total number of outbreaks recorded but only 7.6% of the total number of cases reported. The researchers mapped the number of outbreak reports and number of cholera cases at sub-national level in Africa. The maps indicate that several provinces in Kenya were in the second highest of five ranges of number of outbreak reports, and Nyanza Province in western Kenya was in the mid-range for number of cholera cases reported, while other provinces in Kenya were in the low range for number of cholera cases in comparison to other African countries. The most commonly identified risk factors for cholera outbreaks in East Africa, in order of number of times cited in outbreak reports, were refugee settings, water source contamination,
Gaffga et al. compared median incidence, edemicity (number of years a country reported cholera cases over a specified period of time), and cholera case-fatality rate (CFR) for African countries during the period 2000 to 2005. 6,41 The median incidence for Kenya was 25 cases per 1,000,000 people, which falls within a mid-range category in the study. Kenya had reported cases of cholera in 5 out of the 6 years within the date range studied. 6 Kenya’s mean CFR was 3.3% (meaning 3.3% of cholera cases died), which was above the 2.4% overall CFR for Africa during this period and well above the maximum CFR of 0.4% seen in all parts of the world outside Africa since 2002.
Climate and ecology
It was mentioned in Chapter 1 that V. cholerae is typically found in brackish waters, coastal waters and estuarine environments. There is a growing body of evidence that V. cholerae is associated with fresh water lakes in the Great Lakes region of Africa. 13,42,43 This region
includes lakes Victoria, Tanganyika, Kivu, Edward and Albert in Kenya, Tanzania, Uganda, the Democratic Republic of Congo (DRC), Rwanda, and Burundi.
implementation of these control measures. Earlier cases of cholera had been identified upstream along the Rusizi River that connects Lake Kivu to Lake Tanganyika. The authors concluded that extensive use of the Great Lakes for transportation and for drinking and bathing promotes the rapid spread of cholera in the region. It is noted, however, that the short duration of cholera epidemics and long periods between them in this region suggest that the fresh water lakes do not provide a very favorable environment for the growth of V. cholerae.
In 1999 Shapiro et al. raised the question of whether Lake Victoria in western Kenya is an environmental reservoir for cholera. 43 In a case-control study conducted between June 1997 and March 1998, the researchers found that drinking water from Lake Victoria was associated with an increased risk of cholera. Analysis of the geographic patterns of residence of patients with diarrhea indicated that cholera patients were more likely to live in a village bordering Lake Victoria than diarrhea patients with other pathogens. The authors suggest that Lake Victoria may be an environmental reservoir for cholera, with water hyacinth potentially providing a suitable environment for growth, and that cholera may become endemic in western Kenya.
Feikin et al. investigated the hypothesis that cholera is associated with water hyacinth in Lake Victoria. 44 The researchers found a statistically significant temporal association between water hyacinth coverage in Winam Gulf of Lake Victoria and annual number of cholera cases in bordering Nyanza Province in western Kenya between 1994 and 2008. No association was found between the number of cholera cases and annual rainfall or average annual air
cholerae,and they suggest that water hyacinth in East African Lakes might support amplification or maintenance of V. cholerae.
Bompangue et al. note that the African Great Lakes region has emerged as one of the most active areas of cholera outbreaks in Africa. 13 From the ProMED-Mail website the authors identified 252 cholera outbreaks in the Great Lakes countries between 1999 and 2008. Of the outbreaks, 63.5% occurred in lake areas, and only 12% occurred in coastal areas. More detailed data from the Democratic Republic of Congo indicated an association between the presence of lakes and roads and the risk of cholera.
A number of researchers have investigated potential links between cholera outbreaks and El Niño events, temperature, and rainfall. El Niño is a warming of surface waters in the Central Pacific of 0.5°C greater than normal. This temperature anomaly tends to occur at intervals of 2 to 7 years and typically lasts for 9 months to 2 years. 46 In East Africa, El Niño events often result in higher than normal rainfall accompanied by floods.
Olago et al. studied climatic factors influencing cholera outbreaks in the Lake Victoria basin. 47 The study focused on the following three sites located on the shores of Lake Victoria: Kisumu, Kenya; Kampala, Uganda; and Biharamulo, Tanzania. Climate, hydrology, and cholera data were analyzed over the period 1978 to 1999. In comparing climate data with WHO cholera data for the region, the authors concluded that regional cholera outbreaks were associated with warm and wet El Niño years. The authors suggest that unusually high temperatures along with high rainfall resulting in flooding are required to precipitate regional cholera outbreaks.
suggest that there is a link between El Niño climatic events and the occurrence of cholera in Uganda.
In 2006 Anyamba et al. reported on an advisory from the National Oceanic and Atmospheric Administration (NOAA) of El Niño climate conditions for the period November 2006 to January 2007. 49 It was anticipated that this would result in above average rainfall in equatorial East Africa, and the authors warned of increased risk of cholera in East Africa as a result of flooding in dry land areas.
Bompangue et al. investigated the role of climatic conditions with respect to outbreaks and the persistence of cholera in the African Great Lakes region during the period 1978-2008. 13 The authors found that there were 7 El Niño events during this time period, and all but one corresponded in time with a large increase in cholera cases in the region. They observed varying seasonal patterns with rainfall being associated with increased cholera in some areas. The researchers concluded that cholera in the Great Lakes region is associated with El Niño events and that a few lakeside areas in the region play a critical role in maintaining endemic cholera.
In contrast, Feikin et al. found no association between the annual number of cholera cases in Nyanza Province in western Kenya and annual rainfall or average annual temperature during the period 1994 to 2008. 44 Although this study did not focus on the relationship between cholera and El Niño events, the authors claim that there was no temporal synchrony between flooding associated with El Niño events and large cholera outbreaks in Kenya in 1997 and 2008. The authors explain that the 1997 outbreak began before flooding occurred, and the 2008 outbreak began nearly a year after the flooding.
1974 to 2005. 50 This study does not specifically discuss Kenya, but relevance of the findings to Kenya can be inferred from the country’s geographic location on the equator. The findings of this study indicate that countries near the equator tend to experience more frequent cholera outbreaks. There are no distinct seasonal patterns of cholera occurrence near the equator, but seasonal patterns are evident at higher latitudes in both hemispheres. The authors suggest that larger, macro-level climatic factors, such as El Niño and climate change, likely influence the occurrence of cholera.
Causative organism
The types of V. cholerae causing human illness that have been identified in Kenya are V. cholerae O1, biotype El Tor, serotypes Ogawa and Inaba. Scrascia et al. studied genetic
characteristics of 80 strains of V. cholerae isolated during the widespread outbreaks in 1998-1999. 51 Of the total, 57 samples were serotype Ogawa and 23 were serotype Inaba. Ribotype patterns could be classified into two groups: 19 strains from 4 outbreaks in Northeastern Kenya by the Somali border were of one type, and 61 strains from 25 outbreaks around the country were of another type. This evidence led the authors to conclude that the cholera that spread
throughout the country was of a common clonal origin while the strains causing the 4 outbreaks along the Somali border bear a clonal relationship to strains in Somalia.
the genetic characteristics of clinical and environmental V. cholerae samples collected from various parts of the country between 2005 and 2010. 53 The researchers found that all clinical samples and some environmental samples were O1 El Tor serotype Inaba. The O1 El Tor Inaba isolates were clonally related to strains in other parts of the world. In addition the O1 El Tor Inaba isolates were of two distinct types that the authors suggest may have entered Kenya independently.
Outbreak investigations
A number of cholera outbreak investigations in Kenya are described in the published literature, and these investigations provide insight into who is affected, where, when, and how the disease spreads. The study by Shapiro et al. was previously discussed with respect to Lake Victoria being a potential reservoir of V. cholerae. 43 The researchers conducted a case-control study to analyze risk factors associated with a cholera outbreak in Nyanza Province, western Kenya between June 1997 and March 1998. During this period 14,275 cholera cases, including 547 deaths, were reported by health facilities in Nyanza. The case-fatality rate was 4%. An analysis of 31 stool samples positive for V. cholerae O1 biotype El Tor indicated that 30 isolates were serotype Ogawa and one was serotype Inaba. Multivariate analysis of risk factors indicated a statistically significant association between increased risk of cholera and the following:
drinking water from Lake Victoria or from a stream, attending a funeral feast, and sharing a meal with a person with watery diarrhea.
were treated for cholera, and 4 died. 83% of cases were refugees and 17% were Kenyans from the host community. The highest attack rate was located in a section of the refugee camp known as Kakuma 2. V. cholerae O1 biotype El Tor serotype Inaba was isolated from 33 patients. The authors conducted a case-control study with 90 cases and 170 matched controls. Storing water in the home in a sealed or covered container was found to be protective against cholera while being a recent arrival to the camp and sharing a latrine with 3 or more households was found to be associated with increased risk for cholera. These associations were found to be statistically significant in multivariate analysis.
Mugoya et al. reported on the spread of cholera across Kenya in 2005. 55 They identified 5 distinct cholera outbreaks between January and June 2005. Four outbreaks occurred in towns along major highways, and one outbreak occurred in Kakuma refugee camp as previously mentioned, which is linked to Nairobi by daily flights. The researchers investigated whether the outbreaks were epidemiologically linked. During this period 990 suspected cases were reported, including 25 deaths. 51% of the cases were children and adolescents. Cases were fairly widely dispersed in each of the outbreak locations. Cases did not differ significantly by sex. All V. cholerae isolates were O1 biotype El Tor, serotype Inaba, and isolates were genetically similar.
In one location not treating drinking water and storing water in wide mouth containers were found to be statistically significant risk factors in multivariate analysis. In another location attending a funeral, eating food at a funeral, and eating ugali (the staple food) outside the home were found to be significantly associated with elevated risk for cholera. The authors suggest that the genetic similarity of V. cholerae isolates, temporal clustering, and transportation links
throughout an African country has been rarely reported, and they highlight the possible emerging potential of cholera to spread via transportation systems.
Mahamud et al. describe an outbreak in Kakuma refugee camp in 2009 that resulted in 224 cases and 4 deaths. 57 Among the cases were 163 refugees and 61 Kenyan nationals from the surrounding community. The outbreak began in September and lasted through December 2009. This event was in the midst of the large outbreak across Kenya that Mohamed et al. had reported on. The most recent outbreak in Kakuma prior to this one was in April 2005 (described in the studies by Schultz et al. and Mugoya et al.). In the 2009 outbreak, V. cholerae O1, biotype El Tor, serotype Inaba was isolated from 42% of 104 stool samples collected. The researchers noted that the region Kakuma 2, which had the highest percentage of unusable latrines (because they were full), also had the highest cholera attack rate of 9.5 cases per 1,000 persons in
Loharikar et al. investigated characteristics of two adjacent districts that experienced different case-fatality rates during the epidemic that affected most parts of Kenya in 2009. 58 During this year, the CFR in East Pokot was 11.7% compared to 1.0 % in Turkana South. Both districts are located in the arid northwest region of Kenya and are comprised of nomadic and semi-nomadic populations. The researchers surveyed households, health facilities, and local shops in each district. The household survey investigated community knowledge, attitudes, and practices with respect to cholera. In Turkana South, 81% of household participants correctly identified that drinking bad water causes cholera compared to 53% of participants in East Pokot. A much higher percentage of participants in Turkana South (95%) reported treating their
drinking water compared to participants in East Pokot (10%). A higher percentage of participants in Turkana South (34%) reported availability of oral rehydration solution (ORS) compared to participants in East Pokot (10%). The average travel time to a health facility was 2 hours in Turkana South compared to 31 hours in East Pokot. Availability of cholera treatment medications was very limited in local shops in both districts. Overall, 77% of health facilities surveyed reported shortages of ORS or intravenous fluids at some time during 2009. The authors concluded that poor access to healthcare and prevention supplies together with limited
knowledge of cholera prevention and treatment in East Pokot compared to Turkana South likely contributed to the higher case-fatality rate in this county.
handle a cholera outbreak. The surveillance system was weak, the district laboratory lacked the capacity to detect V. cholera, health care workers lacked training on cholera, and there was a shortage of oral rehydration and intravenous fluids. As a result of these challenges, there was delayed response to the outbreak. The authors surmise that the high case-fatality rate associated with this outbreak was likely due to poor case management, inadequate skills among health care workers, weaknesses in the surveillance system, and poor management support.
Cummings et al. conducted a case-control study during a cholera outbreak in 2010 among semi-nomadic pastoralists in northeastern Uganda to identify risk factors for cholera. 60 This region borders on northwestern Kenya, which also supports semi-nomadic pastoralist
populations. The authors noted that semi-nomadic pastoralists transitioning to a more sedentary lifestyle are subject to new risk factors for diarrheal diseases due to the introduction of crowded conditions that they did not previously experience. In this study the following risk factors were significantly associated with cholera disease in multivariate analysis: residing in the same household as a cholera case, eating roadside food, not disposing of children’s feces in a latrine, drinking un-chlorinated water, and childhood age. The authors highlighted the role of village health teams, comprised of community members, in surveillance, education, and response.
Influence of social and cultural factors
insecurity, and the semi-permanent nature of much of the housing. Lack of access to safe water and improved sanitation facilities affected many of the households in the study area. Weakness of disaster management systems in the region is discussed with the conclusion that government management of cholera outbreaks has been reactive rather than proactive.
The researchers also found that cholera cases were often mismanaged in health facilities. Many patients who died did not receive intravenous fluids or did not receive the correct type or
quantity of fluids. Between January and April 2008 hospitals experienced serious shortages of staff and supplies as a result of disruptions from the violence and protests. This study showed that passive, facility-based surveillance underestimated the number of cholera cases and number of deaths during this cholera outbreak in Kenya. The authors conclude that post-election violence contributed to the extraordinarily high case-fatality rate in western Kenya.
Nyambedha et al. studied community ideas about cholera in urban and rural western Kenya in order to understand the social and cultural factors that influence cholera transmission, prevention, and control and these communities. 62 Interviews of community residents were conducted between March and May 2010 in an urban informal settlement in the city of Kisumu and in Kakum Kombewa, a rural site in Siaya District. Both locations are in Nyanza Province, which borders Lake Victoria. Interview participants were adults aged 18 to 65 with 190 urban and 189 rural participants. During the interview, participants were read a vignette describing a person with typical symptoms. 73% of urban participants and 78% of rural participants
identified the described symptoms as cholera. The most frequently cited causes of cholera in both communities were drinking contaminated water, living in a dirty environment, and lack of latrines. Urban participants more frequently mentioned a dirty environment, and rural
discuss the potential for effective public health interventions at health facility level based on this apparent trust in the healthcare system.
In neighboring Tanzania, Penrose et al. studied factors associated with risk of cholera in the capital city, Dar Es Salaam. 63 Approximately 65% of Dar Es Salaam households are in informal areas (often referred to as slums). The researchers found cholera risk to be significantly associated with living in informal housing, high population density, and low income level. Although the literature review did not reveal similar studies in Kenya’s urban slums, it is reasonable to expect similar conditions.
Interventions
Conroy et al. describe the protective effect of solar disinfection of drinking water. 64 In 1996 the researchers had published the results of a case-control study in Kajiado District, Kenya demonstrating reduction in diarrheal diseases in children less than 6 years of age by use of solar disinfection of drinking water. Solar disinfection was achieved by leaving drinking water on the roof of the house in clear plastic 1.5 L bottles. The study area was affected by a cholera outbreak between November 1997 and January 1998. In a study of this outbreak, the researchers found statistically significant reduced incidence of cholera in children less than 6 years of age in the households using solar disinfection of drinking compared to households that were not using solar disinfection.
areas where the intervention was carried out and 365 households in comparison areas where SWAP did not carry out activities. Overall, the researchers found a high level of awareness of cholera symptoms, and more than 60% of participants were aware that cholera can be prevented by treatment of drinking water. Less than 40% of participants, however, identified hand washing as a method of prevention. The researchers also found low awareness in both groups that there had been a cholera outbreak in the area in the past year. Although hygiene knowledge and water treatment practices were higher among participants who had attended a cholera event, only 26% of participants in the intervention areas had attended an event. Also, household water treatment practices appeared to be low in both groups, with residual chlorine detected in only 17% of study households in the intervention areas and 14% of study households in the comparison areas. The researchers highlighted challenges in community mobilization for cholera events, hand-washing education, and sustained behavior change.
Review of surveillance data
although serotype Ogawa was also isolated. A detailed analysis of cases from 2009-2010 showed little difference in sex distribution of cases with 51% male and 49% female. During the same time period the young were disproportionately affected, with children under the age of 15 accounting for 42% of cases. The authors point out that almost no cases of cholera were reported in the second half of 2010 and in 2011, and they suggest that additional research is needed to ascertain what may have led to this dramatic decline.
Bwire et al. conducted a similar review of national cholera surveillance data in Uganda over the period 2007-2011. 66The researchers found that during this period there were a total of 7,615 reported cholera cases with 181 deaths (CFR, 2.4%). Outbreaks were most common in communities along lakes and rivers, refugee camps, and large urban informal settlements. The highest cholera incidence occurred in 2008 following heavy rainfall and flooding in eastern Uganda. An analysis of the demographics of reported cases in 2011 indicated that 1.6 times more men than women were affected by cholera, and the majority of cases occurred in the age group 15-45 years (61.2%). The authors caution, however, that this information is based on data from only one year when a relatively small number of cases occurred (230 cases). The
researchers observed no consistent seasonal patterns of cholera occurrence over the time period studied. Overall, between 2007 and 2011, there was a decline in the number of reported cases. The authors suggest this decline might be attributable to prevention and control efforts carried out by the Ugandan government and development partners including:
• Health education
• Improved surveillance and case management, including use of village health teams for case identification
• Promotion of good sanitation and hygiene practices
The authors also note that the Ugandan government takes a multi-sectoral approach to cholera prevention and control led by the MOH and involving several other government ministries and partner agencies.
Muyembe et al. reviewed national cholera surveillance data in the Democratic Republic of the Congo over the period 2000-2011. 67 The researchers found that the highest annual incidence rates occurred in the eastern provinces of the country bordering the Great Lakes and concluded that cholera is highly endemic around the lake areas. The authors discussed the Congolese government’s plan to eliminate cholera in the country, with a focus on 7 endemic areas bordering the lakes. The plan calls for strengthening of surveillance, case management, and coordination, as well as improved water and sanitation infrastructure.
Stoltzfus et al. investigated the relationship between cholera occurrence in Kenya and various climatic, environmental, and demographic factors. 68 This study covered the time period 1999-2009, and the unit of analysis was 69 districts of Kenya. Cholera surveillance data was obtained from the Kenya Ministry of Health, and rainfall and temperature data were obtained from the Kenya Meteorological Department. Data for environmental and demographic factors came from the 2005-2006 Kenya Integrated Household Budget Survey. The authors
between cholera and rainfall was complex. The researchers found that increased rainfall between April and June was associated with decreased risk of cholera, while increased rainfall between October and December was associated with increased risk of cholera. The researchers found no association between cholera risk and population density, % of population living below the poverty line, or % of population using unsafe sanitation facilities.
Discussion
A review of the published literature on cholera in Kenya and East Africa raises a number of interesting topics for discussion. There is a body of evidence that cholera is associated with fresh water lakes in the Great Lakes region of Africa. Are the lakes an environmental reservoir for V. cholerae, or is water simply serving as a vector for transmission? Feikin et al found an association between cholera cases and water hyacinth coverage in Lake Victoria and suggested that this plant may promote growth or maintenance of V. cholerae in the aquatic environment. 44 A fresh water reservoir for V. cholerae would be a bit surprising since V. cholerae is more commonly associated with brackish, estuarine, and coastal waters. It is interesting to note, however, that while Kenya and Tanzania both have extensive coastlines, the published literature suggests that cholera outbreaks have occurred more frequently in inland lake areas than coastal areas in the region. Are lakes a more suitable environment for V. cholerae than coastal areas in East Africa? Or is there more human exposure to contaminated water in the lake regions compared to coastal regions? There is insufficient information in the literature to draw
V. cholerae. This idea may also have some relation to the observation by Griffith et al. that
although East Africa accounted for 20.1% of the number of cholera outbreaks reported in
ProMED-Mail between 1994 and 2005, it accounted for only 7.6% of the total number of cases.40 This might suggest a larger number of small outbreaks in the region compared to other areas, or it might mean better capability to detect small outbreaks in this region compared to other regions experiencing cholera outbreaks.
Three studies in this review identified an association between El Niño climatic events and cholera occurrence. 13,47,48 Two of the studies included data from Kenya in the analysis, while one study focused on Uganda. None of the studies focused exclusively on Kenya in drawing conclusions. Feikin et al. suggest that there was no temporal synchrony between El Niño flooding and large cholera outbreaks in Kenya in 1997 and 2008. 44 More research is needed to understand whether there are climatic drivers of cholera outbreaks in Kenya. It is reasonable to expect that climatic conditions are more likely to influence cholera occurrence in communities that lack protection against cholera, such as improved water and sanitation facilities and access to medical care. If there is sufficient evidence to conclude that El Niño events create a favorable environment for the spread of cholera in East Africa, an analysis of cholera occurrence during El Niño years might provide an indication of the progress or lack of progress in implementation of measures for the prevention and control of cholera.
suggesting that the large number of cholera cases arising across Kenya in 2009 and 2010 resulted from near simultaneous emergence of cholera from endemic foci across the country. 56 These two different models of spread would require different approaches to control. For example, in
considering proactive administration of cholera vaccine for prevention of outbreaks, targeting a limited number of geographic areas where cholera has historically initially emerged may be effective if the first model of disease spread is valid, while vaccination in multiple locations across the country might be necessary for effective prevention if the second model of spread is valid.
Much of the available information on cholera in Kenya comes from studies conducted in Nyanza Province in western Kenya. This province borders Lake Victoria, and Feikin et al. pointed out that Nyanza accounted for 38.7% of cholera cases in Kenya between 1994 and 2008, while the population of Nyanza Province comprises only 15.3% of the country. 44 This suggests a higher burden of cholera in Nyanza compared to other parts of the country and might be the reason for more published studies from this region. However, an understanding of what has occurred in other regions of the country is essential to fully understanding cholera in Kenya. It is interesting that Mohamed et al. found a 10-fold higher cholera attack rate in the arid and semi-arid region of northern Kenya than in the lake region of western Kenya during the period January 2009 to May 2010. 56 This might suggest a more recent shift in geographic patterns of
occurrence. Outside of Mohamed’s report and articles on 2005 and 2009 outbreaks in Kakuma refugee camp, the literature is silent on outbreak investigations in other parts of northern Kenya.
uncovered containers, lack of access to improved sanitation facilities, sharing communal latrines, not disposing of children’s feces in a latrine or toilet, not washing hands with soap, presence of a cholera case in the household, attending a funeral, childhood or adolescent age, and living more than 5 km from the nearest health facility. There is mixed information in the literature on the risk of exposure from food, but this likely reflects different dynamics of individual outbreaks. There is no clear indication in the literature of a difference in risk by sex.
Shikanga et al. demonstrated vast under-reporting of cholera cases and cholera deaths during a 2008 outbreak in western Kenya as a result of cases not presenting to health facilities. 61 The researchers found previously unidentified cases and deaths by active community case finding. It has long been recognized that it is likely there is vast under-reporting of cholera globally and that rural residents face challenges with accessing health facilities in many
countries. This study quantified the problem in western Kenya during a challenging time marked by political violence in the country.
Who are the vulnerable populations in Kenya? Is everyone living near Lake Victoria at risk? The literature suggests that both refugee populations and the general population experience outbreaks. What proportion of cases occurs in refugee populations? Understanding the relative burden of cholera in refugee populations and the general population is useful in designing an appropriate prevention and control strategy for the country. Also, what proportion of cases occurs in urban populations versus rural populations? This does not come out clearly in the literature, and this is important for designing effective strategies and targeting appropriate populations.
The literature is noticeably silent on governmental policies and strategies for cholera prevention and control. A keyword search with the terms “cholera AND (policy OR strategy) AND africa” returned few articles, and very few of those cited touched on government policy or strategy. The few articles with most relevance were related to cholera vaccination. Slightly more information is available if the search is expanded beyond cholera to “diarrhea”. This dissertation examines perceived successes and challenges of governmental policies and strategies with relevance to cholera prevention and control in Kenya.
A limitation of this literature review is that the review captured only studies published in peer-reviewed journals. It is likely that there are unpublished outbreak reports held by
CHAPTER 3: METHODS
This descriptive study employed a mixed methods approach to investigate the successes and challenges of cholera prevention and control in Kenya, to analyze geographic patterns of cholera occurrence over time, to investigate the relationship between cholera occurrence and selected development and demographic indicators, and to make recommendations for enhanced prevention and control.
Quantitative methods were used to:
• Describe the geographic patterns of cholera occurrence over time
• Analyze the relationship between development and demographic indicators and cholera occurrence and case-fatality rate
Qualitative methods were used to:
• Describe the perceived successes and challenges of cholera prevention and control in Kenya as identified by key informants from the Government of Kenya and other organizations supporting cholera activities in Kenya
The quantitative and qualitative components of this study were carried out concurrently.
Theoretical framework
that are useful in thinking about cholera prevention and control include the importance of peoples’ interactions with their physical and socio-cultural environments and the existence of multiple levels of influence on health behavior and health outcomes. McLeroy et al. described five levels of influence affecting health behaviors: individual, interpersonal, organizational, community, and policy factors. 70
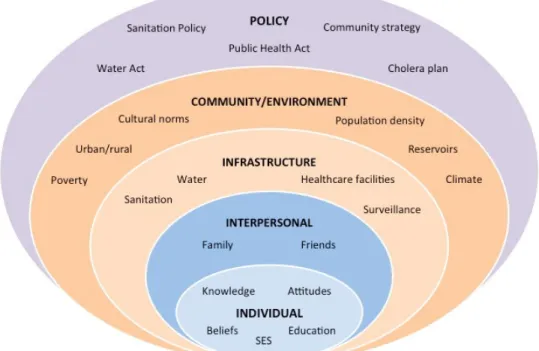
Drawing upon the concepts of McLeroy’s ecological perspective on health promotion programs, a model of factors affecting cholera occurrence and death at various levels of influence is proposed in Figure 3.
Figure 3. Ecological model of factors influencing cholera occurrence and death
educational status; and individual behaviors are likely influenced by socio-economic status (SES). At the interpersonal level, interactions with family and friends can influence risk of cholera. At the infrastructure level, key factors affecting risk include availability of safe drinking water, improved sanitation facilities, and healthcare facilities as well as the existence or absence of a cholera surveillance system. The community/environment level refers to both the human and natural environment. Within the human environment, there is the influence of social and cultural norms, poverty, urban and rural conditions, and population density. Influential factors within the natural environment include climate and the presence or absence of environmental reservoirs for V. Cholerae. At the policy level, in the Kenyan context, key policies and national strategies include the Public Health Act, Water Act, National Environmental Sanitation and Hygiene Policy, community health strategy, and the Multi-sectoral Cholera Prevention and Control Plan.
This is not an exhaustive list of factors influencing cholera occurrence and cholera deaths but serves to illustrate the concept that an individual’s risk of acquiring cholera or dying from cholera is influenced by multiple factors operating at various levels of influence. Some factors may be viewed as operating at more than one level (i.e. poverty may be viewed as an individual factor or a community factor), and influence may occur in more than one direction (i.e. policy may influence community factors and vice versa). This study recognized the complex nature of factors affecting cholera outcomes by investigating a range of factors at various levels of
influence.
Quantitative investigations
between development and demographic indicators and cholera occurrence and case-fatality rate. The first investigation looked at cholera incidence in each of the 47 counties of Kenya over the 10-year time period 2004-2013. The unit of analysis, the county, reflects the current political and administrative structure of government in Kenya. The second investigation used Pearson’s correlation coefficient and zero-inflated poisson regression analysis for a cross-district
comparison of cholera occurrence and case-fatality rate to selected development and
demographic indicators. The time period for this analysis was 2008-2013, which represents three years of widespread cholera outbreaks in Kenya and three years of few, isolated outbreaks. A smaller unit of analysis, the district, was used. This investigation was based on the geographic boundaries of the 158 administrative districts in the 2009 Kenya Population and Housing Census.
Variables and data sources
These investigations were carried out in collaboration with the Kenya Ministry of Health (MOH), Disease Surveillance and Response Unit (DSRU), which maintains national cholera surveillance data. This surveillance data flows from health facilities to the MOH through reporting structures established by the Integrated Disease Surveillance and Response (IDSR) strategy. The dependent variables of interest for this study were number of cholera cases, cholera incidence, and case-fatality rate. Information on cholera morbidity and mortality was obtained from the following data sources provided by the DSRU:
1) Spreadsheet of aggregate numbers of cholera cases and deaths in Kenya for the years 2004-2010 by district and year
2) De-identified line lists with dates and locations of cholera cases and deaths in Kenya for the years 2008-2010 and 2012-2013