Proceedings of the 55th Annual Meeting of the Association for Computational Linguistics (Short Papers), pages 478–483 Vancouver, Canada, July 30 - August 4, 2017. c2017 Association for Computational Linguistics
Proceedings of the 55th Annual Meeting of the Association for Computational Linguistics (Short Papers), pages 478–483 Vancouver, Canada, July 30 - August 4, 2017. c2017 Association for Computational Linguistics
Twitter Demographic Classification Using Deep Multi-modal Multi-task
Learning
Prashanth Vijayaraghavan∗
MIT
Cambridge, MA, USA
Soroush Vosoughi∗
MIT
Cambridge, MA, USA
Deb Roy
MIT
Cambridge, MA, USA
Abstract
Twitter should be an ideal place to get a fresh read on how different issues are playing with the public, one that’s poten-tially more reflective of democracy in this new media age than traditional polls. Poll-sters typically ask people a fixed set of questions, while in social media people use their own voices to speak about what-ever is on their minds. Howwhat-ever, the de-mographic distribution of users on Twitter is not representative of the general pop-ulation. In this paper, we present a de-mographic classifier for gender, age, po-litical orientation and location on Twitter. We collected and curated a robust Twit-ter demographic dataset for this task. Our classifier uses a deep modal multi-task learning architecture to reach a state-of-the-art performance, achieving an F1-score of0.89,0.82,0.86, and0.68for
gen-der, age, political orientation, and location respectively.
1 Introduction
While the most ambitious polls are based on stan-dardized interviews with a few thousand people, millions are tweeting freely and publicly in their own voices about issues they care about. This data offers a vibrant 24/7 snapshot of people’s response to various events and topics.
However, the people using Twitter are not rep-resentative of the general US population ( Green-wood et al.,2016). Therefore, if one is to use Twit-ter to understand the public’s views on various, it is essential to understand the demographic of the users on Twitter. A robust demographic classifica-tion algorithm can also be utilized for detecclassifica-tion of
∗
The first two authors contributed equally to this work.
non-human account, especially in the context of bots involved in the spread of rumors and false in-formation on Twitter (Vosoughi,2015).
In this paper, we present a state-of-the-art de-mographic classifier for Twitter. We focus on four different demographic categories: (a) Gender, (b) Age, (c) Political Orientation and (d) Location. We implement different variants of the deep multi-modal multi-task learning architecture to infer these demographic categories.
2 Features
Our deep multi-modal multi-task learning mod-els (DMT-Demographic Modmod-els) use features ex-tracted from the users’ Twitter profile (such as name, profile picture, and description), the users following network and the users historical tweets (what they have said in the past). Below, we ex-plain how these features are extracted and used.
2.1 Name
The name specified by users in their profile is mainly used for gender prediction. We used three datasets for gender associations of common names:
• We used the data from US Census Bureau data which contains male and female1 first names along with frequency of names for the sample male and female population with re-spect to 1990 census.
• We obtained yearly data for the 100 most popular female and male names between 1960 and 2010 and calculate the overall fre-quency of a name being used in each list.
• We also have a list of European names and popular first from other countries associated 1https://www2.census.gov/topics/genealogy/1990surnames/
with gender information2.
Using the above datasets, we associate each name with a vector of size 2 representing the prob-ability that the name occurs in male list and female list based on frequency available in the datasets.
2.2 Following Network
Network Features can be a signal in prediction of some of the demographic parameters. But it is dif-ficult to utilize the complete list of followers and following information of each and every user due to curse of dimensionality. Therefore, we build an binary vector of sizeNdimfor each user with each index of the vector representing a popular Twitter profiles associated with age, political orientation or location and the value (1, 0) represents if the user is following the profile or not. These profiles are short-listed based on the following techniques:
• We search for user accounts on Twitter for task specific keywords like teenager, 80s, 90s for Age prediction; Democrat, Republican for political orientation and state names for location prediction.
• We take advantage of the data collected from our earlier work (Vijayaraghavan et al.,2016) in processing news stories, classifying named entities into various categories and mapping them to Twitter handles. We use the political personalities mapped onto Twitter to the list of twitter profiles that can potentially act as a signal for our prediction tasks.
Sample Twitter handles associated with each of the tasks are given in Table1. For gender, the han-dles were too generic, so we expect that there are inherent latent features that can contribute towards gender prediction based on the shortlisted Twit-ter handles. We experiment with one or two fully-connected layers and compress the information to aNemb-sized vector.
2.3 Profile Description
The profile description can be really useful to pre-dict all the demographic parameters. Since, GRU is computationally less expensive than LSTM and performs better than standard RNN, we use a gated recurrent network (GRU) (Cho et al.,2014;Chung et al.,2014). At each time stept, GRU unit takes a
2
https://hackage.haskell.org/package/gender-0.1.1.0/src/data/nam dict.txt.UTF8
word embeddingxtand a hidden statehtas input. The internal transition operations of the GRU are defined as follows:
zt=σ(W(z)xt+U(z)ht−1+b(z)) (1)
rt=σ(W(r)xt+U(r)ht−1+b(r)) (2)
˜
ht=tanh(W xt+rt·Uth−1+b(h) (3)
ht=zt·ht−1+ (1−zt) ˜ht (4)
whereW(z), W(r), W ∈IRdh×di,U(z), U(r), U ∈ IRdh×dh and·is an element-wise product. The
di-mensions dh and di are hyperparameters repre-senting the hidden state size and input embedding size respectively. In our experiments, we represent the description as a (a) vector using GRU’s final hidden state i.e. the hidden state representation (re-ferred asDF ∈IRdh) at the last time step (b) ma-trix using all the time steps of hidden state, repre-sented asDM ∈IRL×dh, whereLis the sequence length of the user description.
2.4 Profile Picture
Age and gender prediction can exploit the features extracted from profile picture. We extract dense feature representation from the image using the In-ception architecture (Szegedy et al., 2015). Since we deal with multiple tasks, we experiment with two different layers (pool3 and mixed10)
repre-sentations from the Inception architecture. The output vector sizes are IV = 2048 and IM =
64×2048respectively.
2.5 Tweets
Finally, we also use tweets for our multitask learn-ing problem. In our experiments, we restrict it to user’s recent K tweets. The list of tweets, each of which is word sequence (Si = [wi1, w2i, ..., wNi ]), are encoded using a positional encoding scheme as used in (Sukhbaatar et al., 2015). (For a more sophisticated encoding of the tweets, one can use the Tweet2Vec by Vosoughi et al. (Vosoughi et al.,
2016), however the algorithm requires a massive training dataset, which might not be available to everyone) For the positional encoding scheme, the sentence representation is computed by
Pi =
N
X
j=1
Task Sample Twitter Handles
Age @80s Kidz, @The1980sGirl, @60s70sKids, @IL0VEthe80s, @90syears, @The90sLife Pol-Orien @realDonaldTrump, @HillaryClinton, @youngdemocrat, @GOP, @NancyPelosi Location @california, @UWBadgers, @UtahGov, @UMichFootball, @PureMichigan
Table 1: Sample Twitter handles used to create the network features for each task.
N is the maximum number of words in a sentence andljis a column vector with structure
lpj = (1−j/N)−(p/q)(1−2j/N) (6)
where p is the embedding index and q is the
di-mension of the embedding. The tweet representa-tion obtained from the posirepresenta-tional encoding sum-marizes the word tokens in the sentence. We ex-plore tweet features as (1) a vector by summing up all the K-tweet embeddingsTq∈IRq, (2) a ma-trix by concatenating all the K-tweet embeddings
TKq ∈IRK×q
3 DMT-Demographic Models
Some of the latent information from one task can be useful to predict another task. Therefore, we propose three variants of deep modal multi-task learning demographic models to leverage the multi-modal nature of data. Figure 1 gives an il-lustration of our proposed models. In this section, we explain the single task output layer followed by the various models.
3.1 Vanilla DMT-Demographic Model
This model takes vector features extracted from various user details (explained in section 2) repre-sented byDF, Tq, Nemb, IV for description, tweet, network and image features respectively. The fea-ture vectors are concatenated and passed through a connected layer. The output of the fully-connected layer is a compressed latent feature vec-tor of sizeh. This shared latent vector is given to
a task-specific output layer explained in Section4. For gender prediction task, name features are con-catenated with latent vector before feeding it to the output layer.
3.2 Attention-based DMT-Demographic Model
All the modalities do not contribute equally to each of our tasks. Hence, for each task, we con-catenate the weighted modal feature representa-tions obtained through attention mechanism and then pass it through a fully-connected layer to get
a latent feature vector. Formally, the extracted fea-tures vectors represented byDF, Tq, Nemb, IV are concatenated to get a matrixM ∈IRd×4 where d
is the dimension of each feature. If the extracted features are not of the same dimensiond, then we
introduce a fully-connected layer and transform it to a d-sized vector. The attention over different modal features are computed as follows.
α=sof tmax(W(2)tanh(W(1)M+b(1)) +b(2))
(7) where α ∈ IR1×d. We multiply each of the
fea-ture vectors by their correspondingαvalue to get
a weighted feature representation. These weighted representation are concatenated before passing it through a fully-connected layer. The latent vec-tor obtained from the fully connected layer is now task-specific and not shared between tasks. The la-tent vector is given to a task-specific output layer.
3.3 Hierarchical Attentionbased DMT -Demographic Model
This model is a slight variant of the previous model. In this model, we introduce another level of attention mechanism over the extracted features. The main intuition behind this approach is to have more attention on individual features based on their importance for a task. For example, certain words like ’male’,’husband’ in user’s description might be more suitable for gender prediction than any other task. So we weigh such words higher than the other words in the description during gender prediction task. However, these weights might not be applicable for a location prediction task. Hence, we implement a hierarchical attention mechanism that has task-specific weighted feature extraction followed by task-specific attention over the modalities. The rest of the architecture is sim-ilar to the attention-based model.
This model uses the matrix representation as-sociated with each of the features like descrip-tion (DM), tweets (TKq) and profile picture (IM). However, the network features (Nemb) remain
dimen-Concatenate FC
Description
DF
Tweets
Tq
Profile Picture
IV
Network Feature
Nemb
FC
Description
DF
Tweets
Tq
Profile Picture
IV
Network Feature
Nemb
X X = {A, L, P, G}
Description
DM
Tweets
TKq
Profile Picture
IM
Network Feature
Nemb
Attention Attention Attention Attention
FC X
X = {A, L, P, G}
[image:4.595.80.520.61.227.2]Attention X X = {A, L, P, G}
Figure 1: Illustration of variants of the DMT-Demographic Model. Left: Vanilla DMT-Demographic Model; Center: Attention-based Demographic Model; Right: Hierarchical Attention-based DMT-Demographic Model.
sions of weight parameters are feature-specific. For the sake of convenience, let β(F) be the
weights similar toα associated with a featureF.
For each feature F, we perform a weighted sum over the extracted representation matrix to obtain a vector representation. LetM(F) denote the
ma-trix representation of an extracted feature F, then the vector representationV(F)of the feature F can
be computed as follows.
V(F) =
rF
X
r=1
β(rF)Mr(F) (8)
whererF is the maximum number of rows in the representation matrix M(F) associated with
ture F. These vector representations of all the fea-tures are fed to layers similar to attention-based DMT model.
It is important to note that all the models incor-porate name features with the final latent vector representation for gender prediction task.
4 Output Layer
Given a specific taskA, we feed the latent feature
vectorh(A), obtained after applying any of the
ex-plained models, to a softmax layer depending on the classification task. So the task-specific repre-sentations are fed to task-specific output layers.
˜
y(A)=sof tmax(W(A)h(A)+b(A)), (9)
where y˜(A) is a distribution over various
cate-gories associated with taskA.
For each taskA, we minimize the cross-entropy
of the predicted and true distributions.
L(A)(˜y(A), y(A)) =
N
X
i=1
C(A) X
j=1
yij(A)log(˜yij(A))
(10) where yij(A) andy˜ij(A) are the true label and prediction probabilities for taskA,N denotes the
total number of training samples and C(A) is the
total number of classes associated with the task A. Thus, the parameters of our network are optimized for global objective function given by:
η= X
A∈X
L(A)(˜y(A), y(A)) (11)
where X={Age, Location, Political Orientation, Gender}
5 Data Collection & Evaluation
Task Test Data Size MajorityClassifier (%)
Gender 9,960 53%
Age 6,580 43%
[image:5.595.311.521.60.397.2]Pol-Orien 5,255 52% Location 16,956 9%
Table 2: Task-specific details of test data.
data: (a) latitude, longitude from geo-tagged user tweets, (b) Location field in user profile informa-tion. The various categories associated with each of the tasks are: (a) Gender: M,F (b) Age: < 30, 30−60,>60(c) Political Orientation: Democrat,
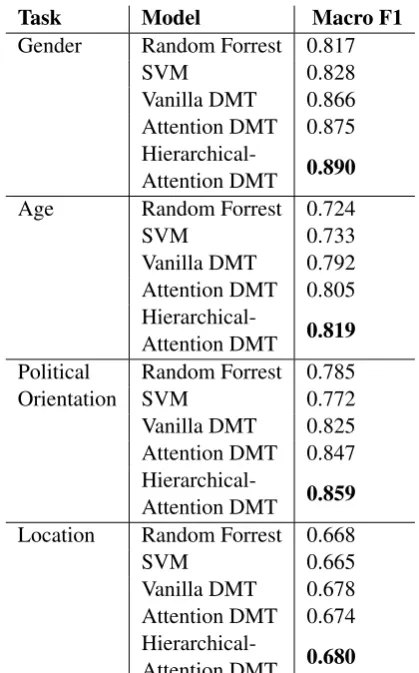
Republican (d) Location: All states in USA. In order to avoid selection bias in the dataset collected, we introduce some noise in the training set by randomly removing the terms (from tweet or description) used for shortlisting the user pro-file. The total size of the training set is 50,859. We evaluate our models on task-specific annotated (mechanical turk) data or data collected based on different phrase indicators from user’s tweet or scription that was not a part of training set. The de-tails of the test set are given in Table2. The macro F1-score of different DMT-Demographic models (plus two baseline non-neural network based mod-els) on the test data can be seen in Table 3. Hierarchical-Attention model performs well ahead of the other two models for almost all the tasks. However, the performance of all the models fall flat for location prediction task. Location-specific feature augmentation can be explored to improve its performance further.
6 Related Work
The main distinctions of several of these models with DMT-Demographic models are that (a) most previous literature use only tweet content analy-sis to predict demographic information (Nguyen et al., 2013) while our model leverages different modals of user information including profile pic-ture, (b) though some of the works use interest-ing network information they do not leverage other user details as potential signals (Colleoni et al.,
2014;Culotta et al.,2015), (c) many of the models involve a lot of feature engineering like extracting location indicative words for geolocation predic-tion, etc. (Han et al.,2014;Sloan et al.,2015), (d) our model learns shared and task-specific layer pa-rameters as we handle the demographic prediction
Task Model Macro F1
Gender Random Forrest 0.817
SVM 0.828
Vanilla DMT 0.866 Attention DMT 0.875
Hierarchical-Attention DMT 0.890 Age Random Forrest 0.724
SVM 0.733
Vanilla DMT 0.792 Attention DMT 0.805
Hierarchical-Attention DMT 0.819 Political Random Forrest 0.785 Orientation SVM 0.772 Vanilla DMT 0.825 Attention DMT 0.847
Hierarchical-Attention DMT 0.859 Location Random Forrest 0.668
SVM 0.665
Vanilla DMT 0.678 Attention DMT 0.674
Hierarchical-Attention DMT 0.680
Table 3: Task-specific Macro F1-score for differ-ent DMT-Demographic models.
problem as a multi-task learning problem using different modalities like image (profile picture), text (tweets and user description) and network fea-tures (following).
7 Conclusion
In this paper, we presented a state-of-the-art demo-graphic classifier for identifying the gender, age, political orientation and the location of users on Twitter. We also collected and curated a novel Twitter demographic dataset and explored differ-ent variants of deep multi-modal multi-task learn-ing architectures, settllearn-ing on the Hierarchical-Attention DMT as the top performing model, achieving an F1-score of0.89,0.82,0.86, and0.68
for gender, age, political orientation, and location respectively.
[image:5.595.82.284.62.144.2]References
Kyunghyun Cho, Bart Van Merri¨enboer, Dzmitry Bah-danau, and Yoshua Bengio. 2014. On the properties of neural machine translation: Encoder-decoder ap-proaches. arXiv preprint arXiv:1409.1259. Junyoung Chung, Caglar Gulcehre, KyungHyun Cho,
and Yoshua Bengio. 2014. Empirical evaluation of gated recurrent neural networks on sequence model-ing. arXiv preprint arXiv:1412.3555.
Elanor Colleoni, Alessandro Rozza, and Adam Arvids-son. 2014. Echo chamber or public sphere? predict-ing political orientation and measurpredict-ing political ho-mophily in twitter using big data. Journal of Com-munication64(2):317–332.
Aron Culotta, Nirmal Ravi Kumar, and Jennifer Cutler. 2015. Predicting the demographics of twitter users from website traffic data. InAAAI. pages 72–78. Shannon Greenwood, Andrew Perrin, and
Maeve Duggan. 2016. Demographics
of social media users in 2016. http: //www.pewinternet.org/2016/11/11/
social-media-update-2016/. Accessed:
2017-01-07.
Bo Han, Paul Cook, and Timothy Baldwin. 2014. Text-based twitter user geolocation prediction.Journal of Artificial Intelligence Research49:451–500. Dong-Phuong Nguyen, Rilana Gravel, RB Trieschnigg,
and Theo Meder. 2013. ” how old do you think i am?” a study of language and age in twitter . Luke Sloan, Jeffrey Morgan, Pete Burnap, and
Matthew Williams. 2015. Who tweets? deriving the demographic characteristics of age, occupation and social class from twitter user meta-data. PloS one
10(3):e0115545.
Sainbayar Sukhbaatar, Jason Weston, Rob Fergus, et al. 2015. End-to-end memory networks. InAdvances in neural information processing systems. pages 2440–2448.
Christian Szegedy, Vincent Vanhoucke, Sergey Ioffe, Jonathon Shlens, and Zbigniew Wojna. 2015. Re-thinking the inception architecture for computer vi-sion.arXiv preprint arXiv:1512.00567.
Prashanth Vijayaraghavan, Soroush Vosoughi, and Deb Roy. 2016. Automatic detection and categorization of election-related tweets. In Tenth International AAAI Conference on Web and Social Media. Soroush Vosoughi. 2015. Automatic detection and
ver-ification of rumors on Twitter. Ph.D. thesis, Mas-sachusetts Institute of Technology.
Soroush Vosoughi, Prashanth Vijayaraghavan, and Deb Roy. 2016. Tweet2vec: Learning tweet embeddings using character-level cnn-lstm encoder-decoder. In