Quantitative Analysis of Ras Oncogene Isoforms Using
Decision Tree and Support Vector Machine
Sinhye Hwang
*, Sujin Jang, Dongwon Lee, Taeseon Yoon
Department ofNatural Science, Hankuk Academy of Foreign Studies, Yongin, Republic of Korea.
* Corresponding author. Tel.: 82 10 3224 3165; email: [email protected] Manuscript submitted January 5, 2015; accepted September 10, 2015. doi: 10.17706/ijcce.2016.5.4.286-293
Abstract: Ras isoform plays a significant functional role in cell growth, cell cycle progression, cytoskeletal changes, apoptosis, and senescence. Mutated Ras gene causes cell proliferation. These genes are found in various kinds of cancer, thus it has been considered that mutated Ras is oncogenic. Ras oncogenes have three isoforms, which are K-Ras, N-Ras and H-Ras. For three decades, there has been active research on Ras gene, but quantitative analysis on each isoform is unknown. For the research, our goal is to compare and contrast each Ras isoform for deeper understanding. We seek for any possibilities of relations between the results and functional role of each isoform by using two types of data-mining technologies; Decision tree and Support Vector Machine. The results show that all three Ras isoforms are fairly alike, especially in the case of K-Ras and N-Ras. Decision tree shows that position 2,3,9,10 act as significant parts in each Ras Isoform. We want to point out that this is the first time to conduct quantitative classification of Ras Isoforms.
Key words: Ras isoform, K-Ras, N-Ras, H-Ras, cancer, decision tree, support vector machine (SVM).
1.
Introduction
Ras proteins are members in a class of proteins called small GTPase, which act as a role of cellular signal transduction. When Ras proteins are activated by incoming signals, they are involved in cell growth, differentiation and survival [1]. They convert a molecule called GTP into another molecule called GDP. Ras proteins act as a switch. They must be turned on by attaching to GTP in order to transmit signal. Then, they are turned off when they convert the GTP to GDP. Ras genes code these Ras proteins. There are three Ras gene isoforms: K-Ras, N-Ras and H-Ras [2]. When Ras genes are mutated, they become oncogenic. Ras oncogene sends permanent signalling to Ras proteins leading to cell proliferation, eventually resulting in cancer. Although the incidence varies, mutated Ras genes are found in various tumor types. To name some mutated cases, there are adenocarcinomas of the pancreas (90%), the colon (50%), the lung (30%), thyroid tumors (50%), and myeloid leukemia (30%) [3]. Mutated Ras genes are found mostly in codon 12, 13, 59 and 61.
of expression, intracellular processing, and subcellular location displayed by the fully processed, mature protein products of the different Ras gene isoforms [4]. Even though each Ras isoform displays high degree of sequence homology and share common sets of upstream effectors and downstream activators, series of experiments and observations suggest that each has functional specificity [4].
1.1.
K-Ras (Kristen Ras Sarcoma Viral Oncogene Homolog)
K-Ras mutations are found in colorectal cancer in 40 to 45% in codon 12 and 13. Among the three isoforms, K-Ras shows the highest frequency of mutations in human tumors. K-Ras mutations occur at very high frequency in pancreatic, colon, or lung cancer, whereas N-Ras and H-Ras mutations are extremely uncommon in those tumors;
1.2.
N-Ras (Neuroblastoma Ras Viral (v-Ras) Oncogene Homolog)
High rate of N-Ras mutations is found in hematopoietic tumors and in malignant melanomas, whereas the rate of K-Ras or H-Ras mutations in the latter tumors is insignificant. N-Ras mutations occur in a high percentage of acute leukemias, whereas H-Ras and K-Ras mutations are much less common there (Fernandez-Medarde and Santos, current journal issue).
1.3.
H-Ras (Harvey Rat Sarcoma Viral Oncogene Homolog)
H-Ras mutations have been reported in melanoma, bladder, thyroid, and mammary carcinoma; it has been reported that the H-Ras oncogene exhibits consistently greater transforming ability than oncogenic N-Ras or K-Ras when tested in a range of fibroblast-based transformation assays [5], [6]. There are a few unanswered questions regarding Ras gene studies; current studies on Ras isoforms have not succeeded in complete classification yet. In addition, there is not much known about quantitative characterization, of the degree of functional specificity or overlapping displayed by each Ras oncogenes in the various cell lineages and tissues where they are all present and simultaneously expressed [7]. We set out our purpose of making a quantitative approach to classify and compare each Ras isoform using a few methods of data mining, which are decision tree and support vector machine (SVM). We conducted our experiments with 9, 13, 17 Window for reliable results. Window refers to the number of amino acids we sliced from the genome sequence of each Ras Isoform. In our previous research, we conducted our experiments using sequence of Rattus norvegicus neuroblastomara's oncogene isoforms (K-Ras, N-Ras, H-Ras transcript variant 1, 2). [8] Then, with using the result of Apriori, we compared the frequency of each amino acid in item sets which satisfy the minimum support. In this paper, We replaced the origin of genome sequence from Rattus norvegicus neuroblastoma to Homo sapiens. When we compared the results, they were noticeably different. Frequent sets in each Window are distinct which we will explain further in Results. We acquired the genome sequence from National Center for Biotechnology Information (NCBI).
2.
Materials and Methods
2.1.
Decision Tree
rule is defined according to data structure and the purpose of analysis. Next step is spreading branches. Remove the branches that have a high risk of classification error or inappropriate induction rule. Then, evaluate the feasibility and establish interpretation and prediction model.
2.2.
Support Vector Machine
Support vector machines (SVM) are supervised learning machines used for classification and regression data between two classes. ‘Class’ means a type of data. SVM include associated learning algorithms that analyze data and recognize patterns. When a pair of data sets is given, SVM construct hyperplanes to separate the data. Among many hyperplanes, SVM tries to find the one that can classify the data sets efficiently. The most accurate hyperplane produces the largest margin between the nearest data point of any class, so called as functional margin. Larger margin leads to lower generalization error of the classifier. When given a set of data, SVM separates the data into training and testing sets. To acquire the higher accuracy, the training of the models needs to be repeated several times while the components of each data set(training data set and test data set are changed, which is called cross-validation [9]. Initially, linear SVM was used for separation, but it was soon realized that few data could be separated with linear method [10], [11]. Therefore, non-linear method (kernel functions) was applied to SVM to solve the problem. Nonlinear kernels allow SVM to produce the maximum-margin hyperplane in a transformed feature space (n-dimensional vector space of numerical feature that represents the object). The transformation may be nonlinear and the transformed space may be high dimensional. Accordingly, although the classifier is a hyperplane in the high-dimensional feature space, it may be nonlinear in the original input space.
Here are some commonly used nonlinear kernel:
Normal kernel:
k
x
,
y
x
Ty
c
(1)Sigmoid kernel (also regarded as hyperbolic tangent kernel):
x
,
y
tanh(
ax
y
c
)
k
T
(2)Radical basis function kernel (RBF kernel, also regarded as Gaussian kernel):
2 22
exp
)
,
(
y
x
y
x
k
(3)Polynomial kernel: T d
c
y
ax
y
x
k
(
,
)
(
)
(4)3.
Experiments
3.1.
Assumption
According to our previous study on comparison of Ras isoforms of Rattus Norvegicus Neuroblastoma, we assumed that H-Ras and N-Ras have more sequences in common than with K-Ras.
3.2.
Decision Tree
in Ras. We experimented for 9 Windows, 13 Windows and 17 Windows in order to find more reliable rules. According to Fig. 1, the value had no balance since the length of K-Ras was too long when we used the initial length of sequence. Therefore all of the result converged to K-Ras and we duplicated the N-Ras for 3 times and the H-Ras for 10 times, of which the amount is same with K-Ras.We picked out the Rules after comparing the frequency, N/A, and R/C. The N/A, Number of Appearance, means the number of particular Rules shown in Fold 1 to 10 using Microsoft Excel function. Since we counted the Folds except including itself, the Rules in amino acid were counted 9 times in the case of N-Ras, 10 times in H-Ras.
Fig. 1. Length of Ras isoforms Ras, and 9 times in K-Ras.
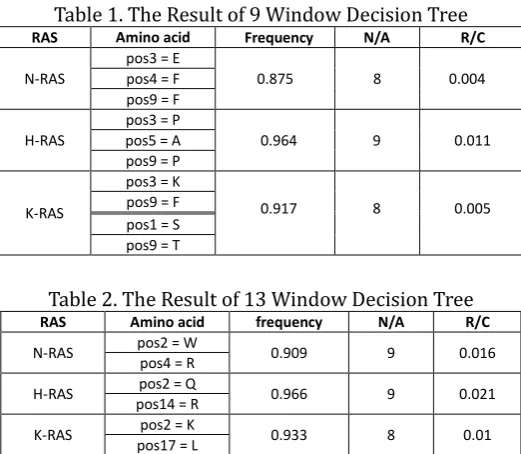
The R/C, Ras specified coverage, is the entire Rule-particular Rule ratio resulted from Ras gene which encompasses particular Rules. Finally, in the case of frequency, we applied N/A preferentially in deducting typical Rule because the error bound of it was lower than that of N/A. For example, in H-Ras, pos3=P, pos5=A, pos9=P came out 9 times out of 10 trials and R/C is 9/783=0.011. The Rule in Table 2 shows the value of which the frequency is the biggest of the Rules which the N/A is 9. In Table 1, a lot of amino acids are located in pos3 and pos9 and we could infer that these amino acids play a significant role in extinguishing Ras genes. Also even though 9 Window was the smallest length of the sequence, we could expect that H-Ras has very systematic sequence as its frequency is 0.964 and it appeared 9 times.
Table 1. The Result of 9 Window Decision Tree RAS Amino acid Frequency N/A R/C
N-RAS
pos3 = E
0.875 8 0.004
pos4 = F pos9 = F
H-RAS
pos3 = P
0.964 9 0.011
pos5 = A pos9 = P
K-RAS
pos3 = K
0.917 8 0.005
pos9 = F pos1 = S pos9 = T
Table 2. The Result of 13 Window Decision Tree RAS Amino acid frequency N/A R/C
N-RAS pos2 = W 0.909 9 0.016
pos4 = R
H-RAS pos2 = Q 0.966 9 0.021
pos14 = R
K-RAS pos2 = K 0.933 8 0.01
pos17 = L
0 500 1000 1500 2000 Num ber o f a m ino a cids
Length of Ras Isoforms
N-Ras
H-Ras
Table 2 shows the result of decision tree with 13 Window. Due to the regularity of H-Ras in 13 Window and since many amino acids appeared in pos10, we could infer that H-Ras plays a significant role in Ras gene distribution.
Table 3 shows the result of decision tree with 17 Window. Because 17 Window has the longest length of sequence, we can guarantee its accuracy among 3 Windows. Identically, H-ras showed the most regularity and the amino acid located in pos2 seems to be important in Ras gene distribution.
Table 3. The Result of 17 Window Decision Tree RAS Amino acid frequency N/A R/C
N-RAS pos7 = D 0.857 7 0.006
pos10 = N
H-RAS pos2 = Q 0.967 9 0.016
pos10 = A
K-RAS pos6 = C 0.889 7 0.007
pos10 = _
Overall, the experiment displayed the result clearly. Although the length of K-Ras was the longest of all, 1797 Rules in N-Ras, 783 Rules in H-Ras, and 1364 Rules in K-Ras were came out. And we thought that this was the result of duplicating the length of Ras genes to make them as the same length of K-Ras. However, because we extended them maintaining their ratios using certain function, it doesn’t seem to affect the result largely.
3.3.
Support Vector Machine
3.3.1.
SVM multiclass
During the experiment with SVM, multi-class support vector machine (SVMmulticlass) was used, which uses the multi-class formation [12]. Among all the results, it is clear that the numbers of support vectors were the lowest with RBF kernel, compared to those with normal and polynomial kernel. In addition, average loss was recorded lowest in all Windows with RBF kernel. Average loss indicates the discordance with the kernel. Thus, high percentage of average loss means poor separation of the data sets. By applying the characteristics of each kernel to this result values, it can be inferred that the overall structure of the Ras isoforms have nonlinearity.
3.3.2.
SVM
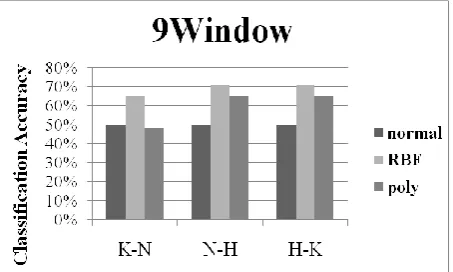
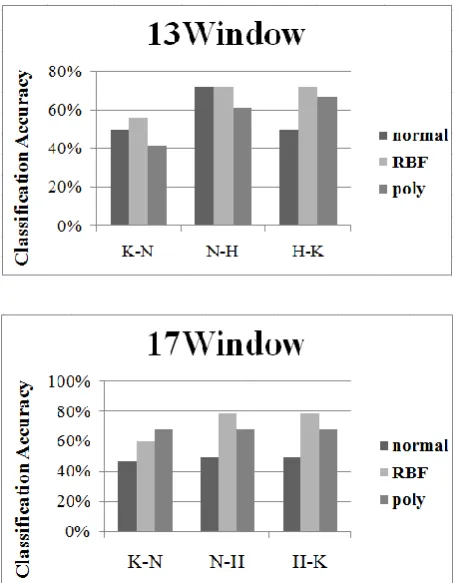
Fig. 2. Results of SVM by 9 window, 13 window, 17 window.
Fig. 2 shows the relationship between two Ras isoforms. Their genome sequences were analyzed by 9 Window, 13 Window and 17 Window. The y-axis in the graphs (Fig. 2) indicates classification accuracy between two isoforms using three kernel functions; normal, RBF and polynomial. High classification accuracy rate means that the couple is able to be divided easily, meaning that the two isoforms are not similar. Among all the functions, the accuracy rates in all couples are the highest when RBF function was used. This validates the unique characteristics of RBF function, presenting that the sequence of each Ras isoform is quite similar to the shape of Gaussian function, therefore “non-linear”. In all the results, it is clearly shown that the classification accuracy of K-Ras and N-Ras is lower than that of the others. The result shows that K-Ras and N-Ras have similar amino acids in common than H-Ras.
4.
Conclusion
The result of decision tree shows that amino acids in position 2, 3, 9, 10 are significant in distinguishing each Ras Isoform. Moreover, we discovered 1797 rules in N-Ras which had the shortest sequence in experiment although frequency, N/A and R/C pointed H-Ras has the most regular rules. We can infer that this is the result of amplifying length of N-Ras and H-Ras which we should make up for next paper. Experiments done by SVM multiclass show that all the Ras isoforms have non-linear dispersion since RBF. In addition, the results of SVM demonstrate K-Ras and N-Ras resemble each other more than H-Ras. In this paper, we concentrated on comparing three Ras Isoforms. Since we conducted three experiments individually, it was hard to find demonstrate relationship among the tools. Therefore, we would like to develop a unifying tool of three experiments to acquire better accuracy, which will be the groundwork for analyzing genome sequence of various biological data. Finding their functional roles will devote to the target therapy of cancers developed by each Ras isoform.
[1] Jhun, B. H. (June 2005). Molecular biological characteristic of oncogenic Ras. Korean Bone & Joint Tumor
Soc., 11(1).
[2] Prior, I. A., Lewis, P. D., & Mattos, C. (2012). A comprehensive survey of Ras mutations in cancer. American Association for Cancer Research.
[3] Bos, J. L. (1989). Ras oncogenes in human cancer: A review. American Association for Cancer Research. [4] Castellano, E., & Santos, E. (2011). Functional specificity of Ras isoforms so similar but so different. Centro de Investigación del Cáncer-IBMCC (CSIC-USAL), University of Salamanca, Campus Unamuno, Salamanca, Spain.
[5] Cheng, C.-M., Li, H., Gasman, S., Huang, J., Schiff, R., & Chang, E. C. (December 2010). Compartmentalized Ras proteins transform NIH 3T3 cells with different efficiencies.
[6] Maher, J., Baker, D. A., Manning, M., Dibb, N. J., Roberts, I. A. (1995). Evidence for cell-specific differences in transformation by N-, H- and K-Ras. Oncogene, 11(8), 1639-1647.
[7] Naz, R., Ahmad, K., & Kaplane, P. (1992). Expression and function of Ras proto-oncogene proteins in human sperm cells. Journal of Cell Science.
[8] Hwang, S. H., Jang, S. J., Cho, M. S., Lee, D. W., & Yoon, T. (2014). Original comparison of Rattus Norvegicus Neuroblastoma’s mutated Ras isoforms using Apriori algorithm. Proceedings of 4th
International Conference on Environment and BioScience.
[9] Hsu, C.-W., Chang, C.-C., & Lin, C.-J. (2003). A Practical Guide to Support Vector Classification (Technical Report). Department of Computer Science and Information Engineering, National Taiwan University. [10]Aizerman, M. A., Braverman, E. M., & Rozonoer, L. I. (1964). Theoretical foundations of the potential
function method in pattern recognition learning. The Journal of Automation and Remote Control, 25, 821-837.
[11]Boser, B. E., Guyon, I. M., & Vapnik, V. N. (1992). A training algorithm for optimal margin classifiers.
Proceedings 5th Annual ACM Workshop on COLT (pp. 144-152).
[12]Duan, K.-B., & Keerthi, S. S. (2005). Which is the best multiclass SVM method? An empirical study.
Proceedings of the Sixth International Workshop on Multiple Classifier Systems: Vol. 3541 (pp. 278-285).
Springer-Verlag Berlin.
Sinhye Hwang was born in Seoul, Kore, in 1997. She is a student in science major of Hankuk Academy of Foreign Studies. She is interested in medical science and applying bioinformatics to analyzing genome sequence of genes. Although it was hard to approach medical science in an innovative way, she didn’t give up, kept working and succeeded in reaching the conclusion. Her previous work is “Original comparison of Rattus Norvegicus Neuroblastoma’s mutated Ras isoforms using Apriori algorithm,”in Proc. of ICEBS 2014.
Dongwon Lee was born in Republic of Korea. He is good at badminton, playing flute, and solving math problems. He entered HAFS in 2013 and started to write a paper that he studied and researched. He kept writing about genes with 3 fellow students, he is currently working on a paper, concerning Ras isoforms.
Taeseon Yoon was born in Seoul, Korea, in 1972. He got a Ph.D. degree in computer education from the Korea University, Seoul, Korea, in 2003.