2018 International Conference on Applied Mechanics, Mathematics, Modeling and Simulation (AMMMS 2018) ISBN: 978-1-60595-589-6
Prediction Research of Heating Load in Residential Area
Based on BP Neural Network
Rui LI and Bo FU
*Key Laboratory of Heating, Gas, Ventilation and Air Conditioning Engineering, Beijing University of Civil Engineering and Architecture, Beijing100044, China
*Corresponding author
Keywords: Heating system, Heating load forecasting, Neural network.
Abstract. This paper analyzed the influence factors of heating load in residential area. The BP neural network algorithm was used for forecast, and BP neural network structure were built. The input sample was outdoor temperature, outdoor wind speed, indoor heat coefficient and heat supply in the last few days. The network structure output was heating load value on the day. Besides, the heating load of a residential district was predicted and verified by day unit and hour unit heating load, and the error of heating load forecasting with different methods were compared. The result shows that the regulation of heating load changes in residential area is periodic. the accuracy of heating load forecasting using hours as a unit is higher than using the day as a unit.
Introduction
In the northern cities and towns of China, heating mainly way is central heating and heating energy consumption accounts for the largest proportion of building energy consumption, Therefore, the research on heating energy saving is especially important in China's building energy saving.The key of realizing energy saving and improving heat users comfort is the proper amount of heat supply in the heating system, and the basis for achieving proper heating is load forecasting[1]. At present, the prediction methods of heat load mainly include energy consumption simulation prediction method[2], gray prediction method, time series method, and regression analysis method. The grey prediction method is an adaptive model that can change parameters without changing the structure. It has strong adaptive ability to random nonlinear interference, and the model lacks resistance to accidental factors. Time series method is used for predictions with small load changes and slow response to sudden changes in weather. Regression analysis is essential for the accurate selection of independent variables, and the independent variables are used to predict response variables. The prediction accuracy of the existing prediction models is not high enough, and the model adaptive ability is poor when the fluctuation of the heat supply is large[3]. With the improvement of energy-saving requirements of heating systems and the rapid development of intelligent science and technology, the accuracy requirements of heat load prediction of heating systems are becoming more and more high[4], and artificial neural networks are increasingly used to heat load forecasting of heating systems[5]. By selecting appropriate network topology and network parameters, neural networks can achieve complex image relationships that are difficult to represent with mathematical models[6-7]. Literature[8-11] concluded that neural networks can predict heating load, but there are few discussion about neural network input parameters and sample selection.
Influencing Factor
Meteorological Factors
Hao Youzhi[12] analysis of load autocorrelation, partial autocorrelation and cross-correlation shows that the load on the day has a strong correlation with the load of the previous days. The input parameters of the thermal load forecast are the loads of the previous days. Does not include outdoor temperature.
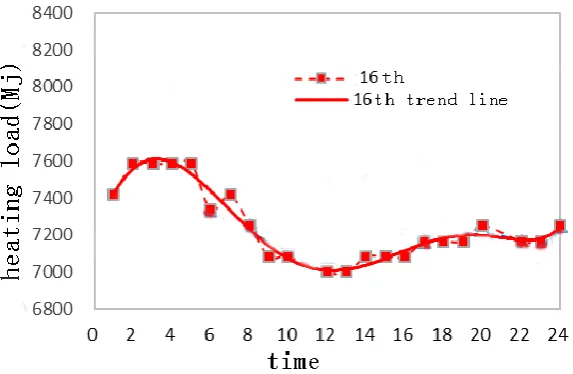
[image:2.595.146.457.257.415.2]Collecting the sample data of the heating system in a residential area in January 2018, and analyzing the data on the typical day of the 16th, the heating load is affected by the outdoor temperature(refer with: Fig. 1), it can be seen that when the outdoor environment temperature is low, the heating load is small; when the outdoor environment temperature is high, the heating load is large. Therefore, the heating load is greatly affected by the outdoor temperature and is a necessary input parameter for heating load prediction.
Figure 1. Typical day 16 heating and outdoor temperature change curves.
[image:2.595.311.507.642.777.2]System factor
[image:2.595.87.295.642.782.2]Figure 2, Figure 3, Figure 4 (refer with: Fig. 2,Fig. 3,Fig. 4) is a heat supply load trend curve drawn according to the heat supply data of a residential district heating system for 24 hours on January 3, January 11, and January 16, 2018, which is drawn on Wednesday, Thursday and Tuesday, not weekends, so the residential heat features are similar. As can be seen from Figure 2, Figure 3, Figure 4, the minimum heating load for these three days is basically between 10:00 and 16:00 during the day, and the highest heating load is between 1:00 and 3:00 during the night. It can be seen that due to the influence of outdoor temperature changes during the day and day and night, the thermal load change law of the residential district heating system has obvious periodicity, which shows that the highest heat load occurrence time and the lowest heat load occurrence time are similar. However, on January 3, January 11, and January 16, the trend of the heating load change trend line is different 24 hours a day. It can be seen that the factors affecting the heating load of the residential area are affected by in addition to the outdoor temperature, it is also affected by system factors such as heating load in the previous days, heat conditions, and building characteristics .
Figure 4. 16th hourly heating comparison curves.
Random Factor
Erik Dotzauer[13] and Peder Bacher[14] added user's personal behavior in the study of influencing factors. By establishing a thermal load forecasting model, it was found that the change of user behavior patterns has a great impact on thermal load forecasting.
[image:3.595.109.489.429.512.2]Through the investigation of the thermal conditions and personnel behavior patterns of residential areas, this paper divides the user's heat into three periods (7:00~16:00, 16:00~22:00, 22:00~7:00), The heat conditions are different on weekdays, weekends and holidays, The thermal coefficients are shown in Tables 1 and 2.
Table 1. Thermal coefficient for working day.
period 7:00~16:00 16:00~22:00 22:00~7:00
Hours 9 6 9
[image:3.595.109.487.539.640.2]Load factor 0.9 0.9 0.7
Table 2. Thermal coefficient for weekends and holidays.
period 7:00~16:00 16:00~22:00 22:00~7:00
Hours 9 6 9
Load factor 0.5 0.9 0.7
Neural Network Structure
Figure 5. 7-6-1BP neural network structure thermal load prediction model.
Simulation Test
Collecting heat load data of a residential district heating system in a city from January 1 to January 31, 2018, 740 sets of data hourly, 540 sets of data as training samples, and 200 sets of data as predictive samples; 31 sets of data daily, 20 sets of data as training samples, and 11 sets of data as predictive verification samples. Due to the development of heating system metering systems and data acquisition technology and the increasingly of the heating system operation data, it is necessary to analyzed and compared the reasonable input samples and determined the appropriate forecasting unit according to the actual heating requirements. Using MATLAB as the platform, the heating load was predicted by 7-6-1BP neural network.
Heating Load Forecast Daily
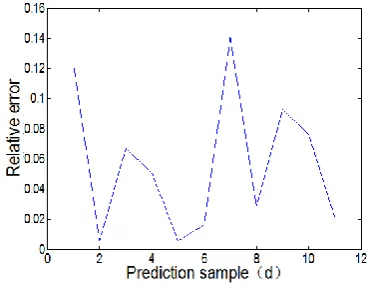
Using the 7-6-1 BP neural network structure, 20 sets of daily heating load data were trained, and 11 sets of data were used for prediction and verification, and the comparison curves and relative error results of actual values and predicted values were obtained. Figure 6(refer with: Fig.6) is 7-6-1 network structure daily thermal load predictive value and actual value comparison curve. Figure 7(refer with: Fig.7) is 7-6-1 network structure daily forecasting sample relative error curve.
[image:4.595.85.291.463.610.2] [image:4.595.322.506.468.612.2]
Figure 6. 7-6-1 network structure daily thermal load Figure 7. 7-6-1 network structure daily predictive value and actual value comparison curve. forecasting sample relative error curve.
Forecast the heating load on a daily basis, It can be seen from Figure6 (refer with: Fig.6)and Figure7(refer with: Fig.7)that when the 7-6-1 neural network structure is adopted, most of the predicted values are close to the test value, the maximum relative error is 14%, and the minimum relative error is 0.2%. Therefore, when the heating load is predicted in daily units, if the number of input samples is small, the accuracy of the prediction result is low.
Heating Load Forecast Hourly
network structure hourly thermal load predictive value and actual value comparison curve. Figure 9(refer with: Fig.9) is 7-6-1 network structure hourly forecasting sample relative error curve.
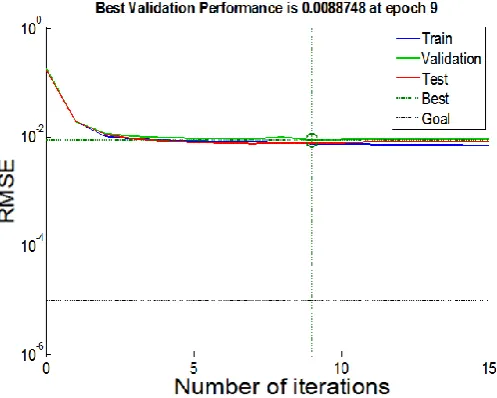
Forecast the heating load on a hourly basis, It can be seen from Figure 8 (refer with: Fig.8) and Figure 9(refer with: Fig.9)that when the 7-6-1 neural network structure is adopted, The difference between the predicted value and the test value is smaller than the difference between the heating load forecast in days, and the prediction accuracy is improved. The 7-6-1 network structure hourly predictive sample training error curveis shown in Fig. 10(refer with: Fig.10). The average relative error of the 7-6-1 BP neural network structure heating load prediction is shown in Table 3.
[image:5.595.316.525.188.332.2][image:5.595.67.292.189.333.2]
Figure 8. 7-6-1 network structure hourly thermal load Figure 9. 7-6-1 network structure hourly predictive value and actual value comparison curve. forecasting sample relative error curve.
[image:5.595.170.419.383.582.2]Figure 10. 7-6-1 network structure hourly predictive sample training error curve. Table 3. Average relative error table.
7-6-1 neural Network Structure
Hourly 2.6%
Daily 5.7%
[image:5.595.158.436.624.704.2]Summary
This paper analyzes the factors affecting the heating load of residential areas and the method of predicting heating load. The 7-6-1 BP neural network structure was established for prediction, and the heating load of a residential area was predicted and verified by the heating load in days and hours. Comparing the errors in heating load forecasting, the conclusions are as follows:
(1) The heating load of residential area is greatly affected by outdoor temperature, and heat load change has obvious periodicity. It shows that the daily maximum heating load occurrence time and the lowest heat load occurrence time are similar in heating period. However, the shape of the heating load change trend line is different 24 hours a day, so there are many factors affecting the heating load of the residential area.
(2) The main factors affecting the heating load in residential areas are outdoor temperature, wind speed, heat consumption and heating load value in the previous days. If the number of input samples is sufficient, the accuracy of heating load forecasting will be improved.
(3) According to the simulation test and actual verification of the heating load forecast in the residential area, under the premise that the amount of data meets the requirements, the accuracy of the heating load forecast in hours is higher than the accuracy of the heating load forecast in days.
Acknowledgement
This research was financially supported by Ministry of Housing and Urban-Rural Development Science and Technology Plan Project (2015-K1-021), Thank you for your help and teachers.
References
[1] Ma Xiaoxiao, Tian Qi, Wang Meiping. Prediction of heat source operation load of central heating system considering temperature attenuation of pipe network[J]. Science Technology and Engineering, 2017, 17(19): 78-83.
[2] Zhang Xiaotong, Liu Jinxiang, Chen Xiaochun, et al. Sensitivity analysis and prediction method of influencing factors of cold (heat) load of regional buildings[J]. Journal of Building Science, 2013, 29(08): 77-82.
[3] Kang Shengwen. Comparison of two thermal load prediction methods[J]. District Heating, 2004(2): 22-24.
[4] Zhang Jingbo, Guo Ling, Wang Zhaoxia, Liu Ling. Thermal load forecasting model of heating system based on BP neural network optimized by genetic algorithm[J]. Journal of Sichuan Armament Society, 2014, 35(04): 152-156.
[5] Ding Shifei, XuXinzheng, Zhu Hong. Studies on optimization algorithms for some artificial neural networks based on genetical gorithm(GA)[J]. Journal of computers, 2011, 6(5):939-946.
[6] Hu Zhihua, Qian Huanquan, Zhang Haipeng, et al. Cost-optimal calculation for ice-storage system using neural network[J]. Journal of Thermal Science, 2002, 11(2):138-143.
[7] Wu Anxu, Lin Xiangdong, Jiang Changsheng, et al. Seismic comprehensive forecast based on modified project pursuit regression[J]. Earthquake Science, 2009, 22(5): 563-574.
[8] Liu Jian, Yang Yong, Qiu Qinggang. Predicting heat supply load of thermal power station based on particle swarm neural network[J]. Energy Conservation, 2008, 311(6):27-30.
[10] Wang Dongya, Zhang Lin, Zhao Guocai. Application of neural network genetic algorithm in heating load forecasting[J]. Journal of Liaoning Technical University, 2005, 24(Supplement):161-163.
[11] Liu Tong, Hao Xuejun. Multivariate analysis of heating load characteristics of hotel buildings[J]. Journal of Beijing Institute of Civil Engineering and Architecture, 2008, 24(2): 5-9.
[12] Hao Youzhi, Li Deying. Short-term prediction of heat load in heating metering system based on neural network[J]. HVAC, 2003, 33 (6): 105-107.
[13] Dotzauer E. Simple model for prediction of loads in district-heating systems[J]. Applied Energy, 2002, 73(3-4):277-284.