1029
HEART SOUND ANALYSIS USING LABVIEW
1N.RUBAN, 2GUNEET PAL SINGH ARNEJA, 2KAPIL BANSAL, 1MATHEW M NOEL
1Prof., School of Electrical Engineering, VIT University, Vellore, INDIA
2
Students, School of Electrical Engineering, VIT University, Vellore, INDIA
E-mail: [email protected], [email protected], [email protected],
ABSTRACT
This paper presents an algorithm to separate the heart sounds, using LabVIEW. The proposed algorithm reads the audio sample signals in .wav format and converts them into a 2-dimentional array. The values stored in this 2-dimentional array and the values of both the separation coefficients are finally fed into the last phase of the algorithm which leads to the separation of heart sounds. After separation, the S1 and S2 signal can be processed in parallel or independently to infer more accurate results. This user friendly technique of separating heart sounds makes it easy for the medical professionals to interpret heart disorders and to further make a better diagnosis.
Keywords: Heart sounds, S1, S2, separation coefficients, Virtual Instrument (VI), National
Instruments-Data Acquisition (NI-DAQ), LabVIEW.
1. INTRODUCTION
The heart is divided into four chambers namely atrium and ventricles. The upper two chambers are known as atria while the lower two chambers are known as ventricles. Heart muscles squeeze the blood from chamber to chamber. During this squeezing process, the valves help the blood to keep flowing smoothly in and out of the heart. This is done by automatically opening of valves to let blood in from chamber to chamber and closing to prevent the backflow of blood [1]. Slapping of the valves leaflets is not enough to generate heart sounds. Heart sounds are the composite sounds produced by myocardial systolic and diastolic, hoist valve, blood flow and cardiovascular vibration impact, and contain a great deal of physiological and pathological information regarding human heart and vascular.
Research on diagnosis of cardiac abnormalities using wavelet technique has been carried out from past few years, due to its good performance in analyzing the signals that presents non stationary characteristics. This technique has eventually become a powerful alternative when compared to the traditional Fourier Transform (FT) [1] [2]. However, despite of its effectiveness, this technique faces two major drawbacks; redundancy and impracticality [3]. This paper presents a method
which helps in eliminating the drawbacks of the techniques proposed earlier.
Fig.1 shows the normal heart sounds, composed of four different sounds, namely S1, S2, S3 and S4. The pumping action of a normal heart is audible by the 1st heart sound (S1) and 2nd heart sound (S2). During systole, the AV valves are closed and blood tries to flow back to the atrium, causing back bulging of the AV valves. But the taut chordae tendineae (cord-like tendons that connect the papillary muscles to the tricuspid valve and the mitral valve in the heart) stop the back bulging and causes the blood to flow forward. This leads to vibration of the valves, blood and the walls of the
ventricles which is presented as the 1st heart sound
[4]. During diastole, blood in the blood vessels tries to flow back to the ventricles causing the semilunar valves to bulge. But the elastic recoil of the arteries cause the blood to bounce forward which vibrates the blood, the walls and the ventricular valves which is presented as the 2nd heart sound [4]. The
3rd heart sound (S3) is heard in the mid diastole due
1030 S1 is composed of components M1 and T1. Normally T1 succeeds M1 slightly. But if M1 occurs slightly before T1, then the patient likely has an abnormal conduction of the right side of the heart such as a right bundle branch block. Similarly S2 is also composed of components A2 and P2. Normally P2 succeeds A2 during inspiration when a spilt of S2 occurs [6]. A wide split of S2 can be associated with many different cardiovascular conditions, such as right bundle branch block and pulmonary stenosis. Thus to diagnose the abnormalities in the heart sounds, they are separated and studied individually.
Fig.1 Heart sounds [7]
2. METHODOLOGY
2.1 Sample Data Collection
Data used in this study are five heart sound recordings, which included two normal heart sounds (one containing S1, S2 and the other containing S1, S2 and S3) and three abnormal heart sounds (caused by aortic insufficiency, mitral stenosis and ejection click, respectively).
Table 1 shows some of the common
abnormalities of heart (further taken as sample signals) and their effects. Both the normal and abnormal heart sound signals are collected and acquired using LabVIEW.
TABLE 1 Abnormalities Of Human Heart
Abnormality Effect
Aortic insufficiency
Heart valve disease that deals
with the weakening or
ballooning of the aortic valve, preventing the valve from closing tightly which leads to backflow of blood from aorta into left ventricle [8].
Mitral stenosis Heart valve disorder in which the mitral valve does not open fully, restricting the blood flow [9].
Ejection click A sharp, clicking sound arising
from near the heart is caused by
sudden swelling of a
pulmonary artery, abrupt
dilation of the aorta, or forceful opening of the aortic cusps [9].
2.2 Data Acquisition
The heart sounds are recorded with the ultrasound probe and the signal is acquired using NI-DAQ. LABVIEW offers various ways to read audio files in WAV format. “Programming | Graphics & Sound | Sound | Files” palette is used to retrieve an audio signal as a 1-D array from a .wav file, and also to save a 1-D array that represents an audio signal to a .wav file. The Snd Read Wave File sub VI accepts a filename for an audio file in .wav format and returns a waveform data type. It reads mono or stereo files, and also determines information such as the audio signal’s sampling frequency and its total number of samples. The sample files used for the study are of type-mono 16bit.[10]
Fig.2 Retrieve An Audio Signal From A .Wav File
The array retrieved from the wave file is indexed using the total number of samples. ‘Build waveform’ is used to generate waveform from this array. The time interval between the data points in the waveform is set as 1. The audio file is viewed as a waveform in the waveform graph.
2.3 2-D Array Generation
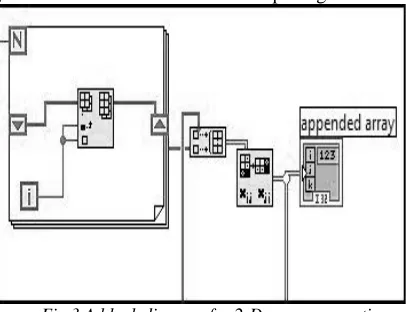
[image:2.612.314.521.414.572.2]1031 the count (N) terminal. The iteration i terminal provide the current loop iteration count, which ranges from 0 to n-1. Here, the value of n is retrieved from the ‘array size’ (as shown in Fig.2). ‘Insert into array’ function is used to insert the elements into an array of size n and i value is fed to the index input of the function. When an array is wired to this function, the function resizes automatically to display index inputs for each dimension in the array. After the For Loop is created, shift registers are used to pass the values from one iteration to the next.
[image:3.612.92.295.356.512.2]‘Build array’ function receives array inputs from mono 16-bit port of Snd Read Wave File.vi (as shown in Fig.2) and from the output of the insert array function (as shown in Fig.3). This function concatenates two 1-dimentional array inputs and forms a 2-dimentional array. Transpose 2-D array rearranges the elements of 2D array such that 2D array [i,j] becomes transposed array [j,i]. The 2-D array is created to know for what x-axis values, the y-axis values are needed in the output signal.
Fig.3 A block diagram for 2-D array generation
2.4 Separation of Signal
An algorithm is designed to separate heart sounds in the sample signals, so that the abnormalities can be diagnosed easily when these signals are studied separately. A Flat Sequence, two For Loops and two Case Structures are used in this algorithm. The Flat Sequence is divided into two identical frames, one of which is shown in Fig.4. The total numbers of values in an array (retrieved from ‘array size’, shown in Fig.2) are divided by 2 and are fed into for loops of both the frames of the flat sequence. Frames in the Flat Sequence structure execute in order, when all data wired to the frame are available. The data leave each frame as the
frame finishes executing. The separation
coefficients y and y’ (used in both the frames) have unique values for every sample signal. The values
of y and y’ for five different sample signals are mentioned in Table 2.
The iteration values are divided by the separation coefficient and quotient is further divided by a constant value, 2. Finally, the resultant remainder is compared with values 0 or 1. A Case Structure is used to evaluate both the situations. The value wired to the selector terminal of the Case Structure determines which case to execute. There are many cases available under Case Structure but only two cases, True and False, are used here.
TABLE 2 Separation Coefficients
Signal Separation
coefficient ( y)
Separation coefficient ( y’) Normal heart
sound signal (S1,S2)
3800 4200
Normal heart sound (S1,S2,S3)
8800 8600
Aortic insufficiency
4000 4000
Mitral stenosis 4000 3900
Ejection click 4400 4400
1032 Fig.4 Flat Sequence Used For Separation
2.5 Final Output
Till this step, the output obtained was in the form of an array which needs to be converted into a waveform. The algorithm shown in Fig.5 fulfills the purpose. The output of Flat Sequence (shown in Fig.4) acts as input for the Reshape Array function which is further wired to the Build Waveform function. Build Waveform creates a new waveform based on the components wired. The time interval between data points in the waveform is set as 1. Finally, the output waveform (containing separate heart sound signals) is viewed in the front panel.
Fig.5 Final Output
3. RESULTS AND DISCUSSION
Following are the outputs of five different sample signals that were selected initially. Fig.6 shows a switch, presently in ‘off’ position due to which only one part of heart sound signal is viewed in the waveform graph of the front panel. If the position of the switch is changed from ‘off’ to ‘on’, the other part of the heart sound signal can be viewed in the second waveform graph. The x and y-axis values of both the waveform graphs are adjusted according to the array size. Fig.6 also shows two knobs which represents separation
coefficients y and y’. A file path of each sample signal is given in the ‘wave file path’ in front panel. Both the file path and the values of separation coefficients need to be specified prior to simulation. It can be clearly observed from these results that, algorithm used for separating heart sounds has worked successfully for all the sample signals.
The heart sound is recorded with the ultrasound probe and the signal is acquired using NI-DAQ. A basic filter operation is performed and the signal with the major frequency component of interest is passed through the algorithm with the separation
coefficients. The S1 and S2 sound components are
separated from the signal. Signals for three different heart abnormalities are collected and the separation coefficients are finely tuned for those signals. The algorithm is able to detect and separate
the S1 and S2 components of those abnormal signals
as well.
Fig.6 (a) Normal heart sound (S1, S2)
1033 Fig.6 (c) Aortic Insufficiency
Fig.6 (d) Mitral Stenosis
Fig.6 (e) Ejection Click
4. CONCLUSION
The primary objective of the separation of heart sounds is to bring about improvements in monitoring and diagnosis of cardiac abnormalities.
The potential usefulness of any kind of method used for separating heart sounds rests on its ability to perform efficiently with less computational speed. Irregularity of the heart sound signals along any of the axis makes the task challenging. Thus, a user friendly algorithm is proposed in this paper, in which the values of separation coefficients to separate the heart sounds can be set, depending upon the nature of the signal. This method did not add any of the noticeable artifacts or clicks in the signal which is reconstructed. This proposed technique has shown promising results, both in case of normal and abnormal heart sound signals.
REFRENCES:
[1] M. A. R. Santos, M. N. Souza, “Detection of first and second cardiac sounds based on time frequency analysis”, 2001 proceedings of the 23rd annual EMBS international conference, October 25-28, Istanbul, Turkey.
[2] D. Kumar, P. Carvalho, M. Antunes, P. Gil, J. Henriques, L. Eug´enio , “A New Algorithm for Detection of S1 and S2 Heart Sounds”, IEEE transaction,2006.
[3] Taner Topal, Hüseyin Polat, İnan Güler,
“Software Development for the Analysis of
Heartbeat Sounds with LabVIEW in
Diagnosis of Cardiovascular Disease”, Journal of Medical Systems, Volume 32, Issue 5, October 2008.
[4] T E Ayoob Khan, Dr. P Vijayakumar, “Separating Heart Sound from Lung Sound Using LabVIEW”, International Journal of Computer and Electrical Engineering, Vol.2, No.3, June, 2010.
[5] Chunmei Dan, Wei he, Jing Zhou, and Xiaoqing Li, “Playing and Acquiring Heart
Sounds and Electrocardiogram
Simultaneously Based on LabVIEW”,
Automation Congress, 2008. WAC 2008. World, Sept. 28 2008-Oct, Hawaii. pp1-4. [6] M.S. Obaidat, “Phonocardiogram Signal
Analysis: Techniques and Performance
Comparison”, Journal of Medical Engineering & Technology, v. 17, pp. 22 1-227, 1993. [7] www.enotes.com
[8] B Al-Naami, J Chebil, B Trabsheh, H Mgdob,
“Developing custom signal processing
algorithm with LabVIEW FPGA and compact RIO to detect the aortic stenosis disease”, Computers in Cardiology 2006;33:193-196. [9] www.ncbi.nlm.nih.gov
![Fig.1 Heart sounds [7]](https://thumb-us.123doks.com/thumbv2/123dok_us/8917457.962531/2.612.314.521.414.572/fig-heart-sounds.webp)