© 2016 IJSRSET | Volume 2 | Issue 3 | Print ISSN : 2395-1990 | Online ISSN : 2394-4099 Themed Section: Engineering and Technology
Seismic Comparison of Commercial Building between Equivalent Static
Analysis and Response Spectrum Analysis
Prof. N. N. Shinde1 , Prasad R. Gayaki2
1 N. N. Shinde, Professor, Civil Engineering Department, PLIT Engineering College Buldana, Maharashtra, India 2 P. R. Gayaki, Student at PLIT Engineering College Buldana, Maharashtr, India
ABSTRACT
Earthquake is very severe problem nowadays. As the commercial building are having large amount of rush daily so such type of the building should be earthquake resistant. We are going to study the behaviour of commercial building against seismic load. A comparison is done using ETABS software in different seismic zones using response spectrum method and equivalent static analysis method, then it is finally concluded that which method is effective and economic. Different parameters are compared using graphical and tabular form.
Keyword: - ETABS, Equivalent Static Analysis, Response Spectrum Analysis, Commercial Building
I.
INTRODUCTION
As earthquake has become a severe problem nowadays it is important to protect buildings and structures from the effect of the earthquake. As we all know the commercial buildings are having large amount of rush daily as compared to the residential building. So the safety of the public is required. So such type of structures should be earthquake resistant so that there should not be any loss to the structure as well as to human life. So we are going to study the analysis of commercial building in different seismic zones using response spectrum method and equivalent static analysis method.
II.
METHODS AND MATERIAL
2.Objectives
A- To study the effect of earthquake of different seismic zones on commercial building using ETABS software. B- To study that which of method is effective and economic for seismic analysis.
3. Building Description
The analysis is done on R.C. moment resisting frame structure. The floor wise plan layout of the building is
shown in Figure 3.1, 3.2 and 3.3. The building taken is the shopping mall which carries G+5 stories. The size of the structure is 55X33.4m. Height is 4m for each storey. The details of all middles are mentioned below. Other relevant data is tabulated in table.
Model I: Building in earthquake zone II Model I: Building in earthquake zone III Model I: Building in earthquake zone IV Model I: Building in earthquake zone V
Table 1. Modelling Data Selected
Structure size 55 X 33.4m Total height 25 m Storey height 4.0 m Parapet wall 1.0 m Foundation depth 1.0 m Primary beam size 300mmX600mm Secondary beam size 300mmX450mm Size of columns 300mmX750mm Thickness of slab 150mm External wall thickness 230mm Earthquake zone II,III, IV & V Type of soil Medium Live load at staircase,
lobby and passage area
5.0 kN/m2
Density of brick masonry
4. Modelling of building
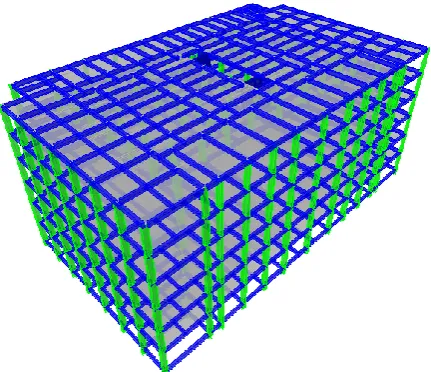
The model is analysed using the ETABS 9.7.4. Brick wall load is uniformly distributed over beams. In the modelling, material is considered as an isotropic material. The 3D model generated in ETABS is shown in figure.
Figure1. Model of building generated in ETABS
5. Analysis of building
The code recommends following method of analysis. 1. Equivalent static analysis
6. Load combinations used
For the analysis, following seven load combinations specified by the IS 1893: 2002 as per clause 6.3.1.2 are used.
1. 1.5 (DL ± LL) 2. 1.2 (DL + LL ± EL) 3. 1.5 (DL ± EL) 4. 0.9 DL ± 1.5EL
III.
RESULTS AND DISCUSSION
Equivalent static and response spectrum analysis is carried out on all the models. The results are presented in the form of graphs. Results in the tabular form are given in appendix.
7.1 Equivalent Static Analysis
Equivalent static analysis is performed on all the models. Loads are calculated and distributed as per the code IS1893:2002 and the results obtained are compared with
respect to the following parameters. The results are presented in the form of tables and graphs.
7.1.1 Lateral displacement
A graph is plotted taking floor level as the abscissa and the displacement as the ordinate, for different models in the transverse and longitudinal direction as shown in figures below. The lateral displacement values in tabular form for longitudinal direction and for transverse direction are given in tables below.
Table 2: Displacement values in longitudinal direction (ESA)
Storey/Model Z-II Z-III Z-IV Z-V 5 15.1 24.1 36.2 54.3 4 12.9 20.6 30.9 46.3 3 10.2 16.3 24.4 36.6 2 7.3 11.7 17.5 26.3 1 4.6 7.4 11.1 16.6
Table 3: Displacement values in transverse direction (ESA)
Storey/Model Z-II Z-III Z-IV Z-V 5 22.5 35.9 53.9 80.8 4 19.1 30.6 45.9 68.8 3 15.2 24.3 36.5 54.7 2 10.8 17.4 26 39 1 6.4 10.2 15.3 23
Figure 3: Displacement profile in transverse direction (ESA)
It is seen that there is increment in lateral displacement in longitudinal as well as transverse direction for increasing in seismic zones from II to V. For model II (EQZ-III) increment in lateral displacement is up to 90% as compared with model I (EQZ-II) in both longitudinal and transverse direction. For model III (EQZ-IV) increment in lateral displacement is up to 185% as compared with model I (EQZ-II) in both longitudinal and transverse direction. For model IV (EQZ-V) increment in lateral displacement is up to 325% as compared with model I (EQZ-II) in both longitudinal and transverse direction. Also it is observed that from zone II to zone III this increment is 60% whereas from zone III to zone IV and from zone IV to zone V it is 50%. This shows that consideration of proper seismic zone highly influence the analysis and design of structure.
7.1.2 Drift
A graph is plotted taking floor level as the abscissa and the storey drift as the ordinate for different models in the transverse and longitudinal direction as shown in figures below. The storey drift values in tabular form for longitudinal direction and for transverse direction are given in tables below.
Table 4 : Storey drifts values in longitudinal direction (ESA)
Storey/
Model Z-II Z-III Z-IV Z-V
Allowab -le limit
Re m-ark 5 2.256 3.608 5.412 8.116 16 OK 4 2.696 4.312 6.464 9.7 16 OK
3 2.88 4.612 6.916 10.37
6 16 OK
2 3.024 4.836 7.256 10.88
4 16 OK 1 2.632 4.212 6.316 9.472 16 OK
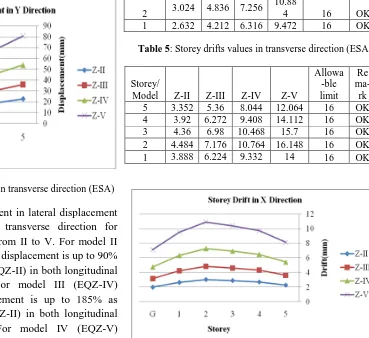
Table 5: Storey drifts values in transverse direction (ESA)
Storey/
Model Z-II Z-III Z-IV Z-V
Allowa -ble limit
Re
ma-rk 5 3.352 5.36 8.044 12.064 16 OK 4 3.92 6.272 9.408 14.112 16 OK 3 4.36 6.98 10.468 15.7 16 OK 2 4.484 7.176 10.764 16.148 16 OK 1 3.888 6.224 9.332 14 16 OK
Figure 4: Storey drift profile in longitudinal direction(ESA)
Figure 5: Storey drift profile in transverse direction (ESA)
both longitudinal and transverse direction. Also it is observed that from zone II to zone III this increment is 60% whereas from zone III to zone IV and from zone IV to zone V it is 50%.
7.1.3 Bending moment in columns
The maximum bending moments in the columns in longitudinal and transverse direction are shown in figure. The Bending moment values in bottom storey column in longitudinal and transverse direction are given in table.
Table 5: Bending moment values in bottom storey column in longitudinal and transverse direction (ESA)
Direction/Model Z-II Z-III Z-IV Z-V Longitudinal 63.34 101.35 152.03 228.04
Transverse 78.1 125 187.45 281.18
Figure 6: Comparison of maximum bending moment in longitudinal and transverse direction (ESA)
Bending moment is one of the important parameter for designing of any structure. For comparison purpose here bending moment of bottom storey is considered. It is seen that there is increment in bending moment in bottom storey columns in longitudinal as well as transverse direction for increasing in seismic zones from II to V. For model II (EQZ-III) increment in bending moment is up to 60% as compared with model I(EQZ-II) in both longitudinal and transverse direction. For model III (EQZ-IV) increment in bending moment is up to 145% as compared with model I(EQZ-II) in both longitudinal and transverse direction. For model IV (EQZ-V) increment in bending moment is up to 267% as compared with model I(EQZ-II) in both longitudinal and transverse direction. Also it is observed that from zone II
to zone III this increment is 60% whereas from zone III to zone IV and from zone IV to zone V it is 50%.
7.1.4 Base Shear
A graph is plotted between different building models and the base shear as shown in figure. The Base shear values in longitudinal and transverse direction are given in table.
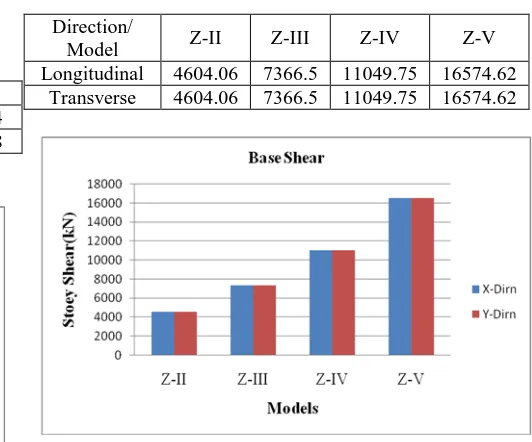
Table 6: Base shear values in longitudinal and transverse direction (ESA)
Direction/
Model Z-II Z-III Z-IV Z-V Longitudinal 4604.06 7366.5 11049.75 16574.62
Transverse 4604.06 7366.5 11049.75 16574.62
Figure 7: Base Shear in longitudinal and transverse direction (ESA)
It is seen that there is increment in base shear in longitudinal as well as transverse direction for increasing in seismic zones from II to V. For model II (EQZ-III) increment in base shear is up to 60% as compared with model I (EQZ-II) in both longitudinal and transverse direction. For model III (EQZ-IV) increment in base shear is up to 140% as compared with model I (EQZ-II) in both longitudinal and transverse direction. For model IV (EQZ-V) increment in base shear is up to 260% as compared with model I (EQZ-II) in both longitudinal and transverse direction. Also it is observed that from zone II to zone III this increment is 60% whereas from zone III to zone IV and from zone IV to zone V it is 50%.
7.1.5 Storey Shear
values in tabular form for longitudinal direction and for transverse direction are given in tables below.
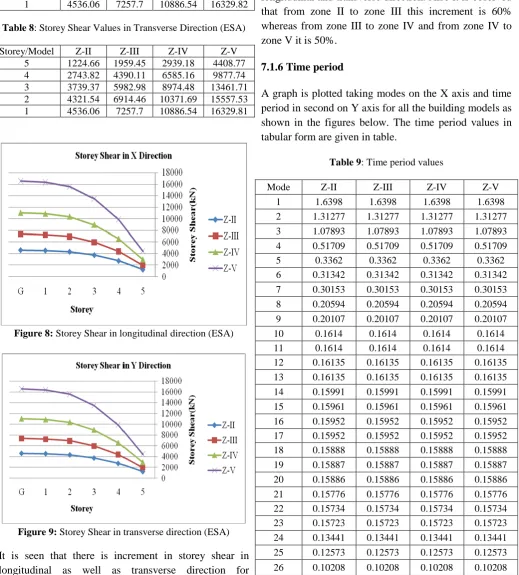
Table 7: Storey Shear Values in Longitudinal Direction (ESA)
Storey/Model Z-II Z-III Z-IV Z-V 5 1224.66 1959.45 2939.18 4408.77 4 2743.82 4390.11 6585.16 9877.74 3 3739.37 5982.98 8974.48 13461.72 2 4321.54 6914.46 10371.69 15557.53 1 4536.06 7257.7 10886.54 16329.82
Table 8: Storey Shear Values in Transverse Direction (ESA)
Storey/Model Z-II Z-III Z-IV Z-V 5 1224.66 1959.45 2939.18 4408.77 4 2743.82 4390.11 6585.16 9877.74 3 3739.37 5982.98 8974.48 13461.71 2 4321.54 6914.46 10371.69 15557.53 1 4536.06 7257.7 10886.54 16329.81
Figure 8: Storey Shear in longitudinal direction (ESA)
Figure 9: Storey Shear in transverse direction (ESA)
It is seen that there is increment in storey shear in longitudinal as well as transverse direction for
increasing in seismic zones from II to V. For model II (EQZ-III) increment in storey shear is up to 60% as compared with model I(EQZ-II) in both longitudinal and transverse direction. For model III (EQZ-IV) increment in storey shear is up to 140% as compared with model I(EQZ-II) in both longitudinal and transverse direction. For model IV (EQZ-V) increment in storey shear is up to 260% as compared with model I(EQZ-II) in both longitudinal and transverse direction. Also it is observed that from zone II to zone III this increment is 60% whereas from zone III to zone IV and from zone IV to zone V it is 50%.
7.1.6 Time period
A graph is plotted taking modes on the X axis and time period in second on Y axis for all the building models as shown in the figures below. The time period values in tabular form are given in table.
Table 9: Time period values
Figure 10: Comparison of time period for different modes
Figure 11 Comparison of time period for different modes
7.2 Comparison of analysis results for all zones.
The analysis results of all the building models are compared for all zones II, III, IV and V. The observations are as follows
It is observed that mostly all the comparisons parameters are increase 0.6 times, 1.4 times and 2.6 times for zone III, zone IV and zone V respectively.
It is observed that from zone II to zone III increment in response of building is 60% whereas from zone III to zone IV and from zone IV to zone V it is 50%.
There is no change fundamental time period of structure in first mode.
IV.
CONCLUSION
The proposed payment system combines the Iris recognition with the visual cryptography by which customer data privacy can be obtained and prevents theft through phishing attack [8]. This method provides best for legitimate user identification. This method can also be implemented in computers using external iris recognition devices.
V.
REFERENCES
[1] Bhagavathula Lohitha, S.V.Narsi Reddy, “Earthquake resistant design of low-rise open ground storey framed building” (International journal Of Modern Engineering Research (IJMER) ISSN: 2249–6645)
[2] Youssef M.A. Hashash, Jeffrey J. Hook, Birger Schmidt, John I-Chiang Yao, “Seismic design and analysis of underground structures” (Tunnelling and Underground Space Technology 16 2001. 247 293) [3] K. Suresh Chawdhari, “Effect of diaphragm
discontinuity in the seismic response of multi-storeyed building
[4] John R. HAYES , Stanley C. WOODSON , Chris D. POLAND: “Earthquake resistance and blast resistance: a structural comparison” (13th World Conference on Earthquake Engineering Paper No. 887)
[5] Miss Kavita K. Ghogre: “Seismic analysis and design of multistory steel building” (International Journal for Research in Applied Science & Engineering Technology (IJRASET) ISSN: 2321-9653)
[6] Gaurav Joshi, K. K. Pathak, Saleem Akhtar, “Seismic analysis of soft storey buildings considering structural and geometrical parameters” (Journal on Today’s Ideas – Tomorrow’s Technologies, Vol. 1, No. 2, December 2013 pp. 73–84)
[7] K. Suresh Chawdhari, “Effect of diaphragm discontinuity in the seismic response of multi-storeyed building”