Experimental Study of a Exhaust Pipe Using
FFT Analyzer
[1]
Shubham V. Kothavade, [2] Pallavi G. Kulkarni, [3] Prof. R. S. Pawar [1][2]
Student, Department of Mechanical Engineering, Gokhale Education Society's R. H. Sapat College of Engineering,
(GES’s R. H. Sapat COE), Nashik, India
[3]
Associate Professor, Department of Mechanical Engineering, Gokhale Education Society's R. H. Sapat College of
Engineering, (GES’s R. H. Sapat COE), Nashik, India
ABSTRACT: Bending operation is the most common mechanical operation performed nowadays to overcome the drawbacks of conventional process. The grain structure of the material drastically changes during bending operation. This results in change of natural frequency of the material. So it is very important to study the change in natural frequency of the material after bending. For this purpose FFT analyzer is used to obtain the spectrum and natural frequency.
KEYWORDS: - Bending, pipe, natural frequency, FFT analyzer, Crack formation.
I. INTRODUCTION
In mechanical joints with couplers or flanges, crevices are inevitable. Depending on the conditions, these may be undesirable because they can trap corrosive substances. The risk of corrosion must also be taken into account. Bent pipe ensures a continuous, even surface. Bent tube can therefore be the easiest and most efficient solution to design task. Indeed, tube bending is one of the most frequently used fabrication techniques for stainless steels. When a metallic pipe is bent, two things happen. The outside wall reduces in thickness, due to the stretching of the material, and the inside wall become thicker. In other words the material that forms the outside is stretched, while the inside bend is compressed. Due to this there is change in grain structure of the material. As a effect of this, natural frequency of also changes.
Natural Frequency : If a system is disturbed and allowed to vibrate on its own, the frequency with which it vibrates without damping and without external forcing is known as its Natural frequency.
Spectrum Analyzer: A spectrum analyzer is an instrument which measures the magnitude of an input signal versus
frequency within the full frequency range of the instrument. The primary use is to measure the power of the spectrum of known and unknown signals.
FFT Analyzer : The Fast Fourier Transform spectrum analyzer uses digital signal processing techniques to provide
in depth waveform analysis with greater flexibility.
Bending process: Bending refers to the operation of deformation of a specimen around a straight axis where the
neutral plane lies.
II. FFT SPECTRUM ANALYZER
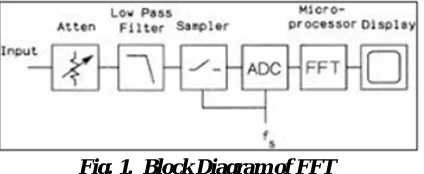
The Fast Fourier Transform spectrum analyzer uses digital signal processing techniques to provide in depth waveform analysis with greater flexibility than other methods. The FFT or Fast Fourier Transform spectrum analyzer uses digital signal processing techniques to analyzer a waveform with Fourier transforms to provide in depth analysis of signal waveform spectra. An FFT spectrum analyzer works in an entirely different way. The input signal is digitized
greater than twice the highest frequency component of the signal, then the sampled data will accurately represent the input signal. In this analyzer, sampling occurs at 256 kHz.
A. Advantages of FFT spectrum analyzer technology
Fast capture of waveform: In view of the fact that the waveform is analyzed digitally, the waveform can be captured in a relatively short time, and then the subsequently analyzed. This short capture time can have many advantages - it can allow for the capture of transients or short lived waveforms.
Able to capture non-repetitive events: The short capture time means that the FFT analyzer can capture non-repetitive waveforms, giving them a capability not possible with other spectrum analyzers.
Fig. 1. Block Diagram of FFT
Able to analyze signal phase: As part of the signal capture process, data is gained which can be processed to reveal the phase of signals. Waveforms can be stored Using FFT technology, it is possible to capture the waveform and analyze it later should this be required.
Fig.FFT Analyzer
B. Specifications of the Pipe:
Test Method : IS 1608:2005/ASTM E415:2014/IS 8811:1998. Material : Aluminum coated Steel pipe.
Dimensions : 50.8 X 1.2mm
Tensile Test Results Yield Strength 212.17
U.T.S 313.04
Elongation 33.20
C. Experimental Setup
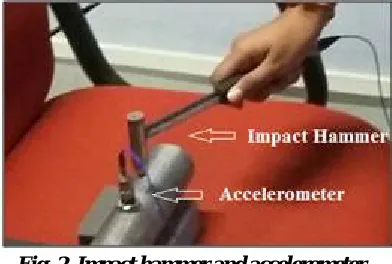
excitation to the silencer. An accelerometer used has a magnetic base and is located at the end of the silencer. The FFT spectrum analyzer is used to analyze the data.
With the use of the above equipments experimental test setup is prepared. The impact is given at the end of silencer by using impact hammer. Analyzer receives analog voltage signals from the accelerometer. The analyzed signals used to find natural frequencies and mode shapes in graphical form with the use of software installed in the computer. The graph of acceleration verses frequency for impact test is shown in figure.
Fig. 2. Impact hammer and accelerometer
D. Experimental Analysis of Exhaust Pipe before Bending operation:
A sample of straight pipe of 1800mm length having diameter is taken whose natural frequency is to be determined. This pipe was placed on well cushioned surface to avoid unwanted vibration from the surface. Initially, the pipe was marked after 100mm to check natural frequency of the pipe throughout the length. Then using FFT analyzer, the sensor was placed on each marking and readings were obtained for different part of pipe.
Fig. 3. Spectrum of Straight Pipe
E. Experimental Analysis of Exhaust Pipe after Bending operation:
Sr. No. Distance Frequency
1. 100mm 92.5 Hz
2. 300mm 92.5 Hz
3. 600mm 92.5 Hz
4. 1200mm 92.5 Hz
F. Experimental Analysis of Exhaust Pipe after Bending operation:
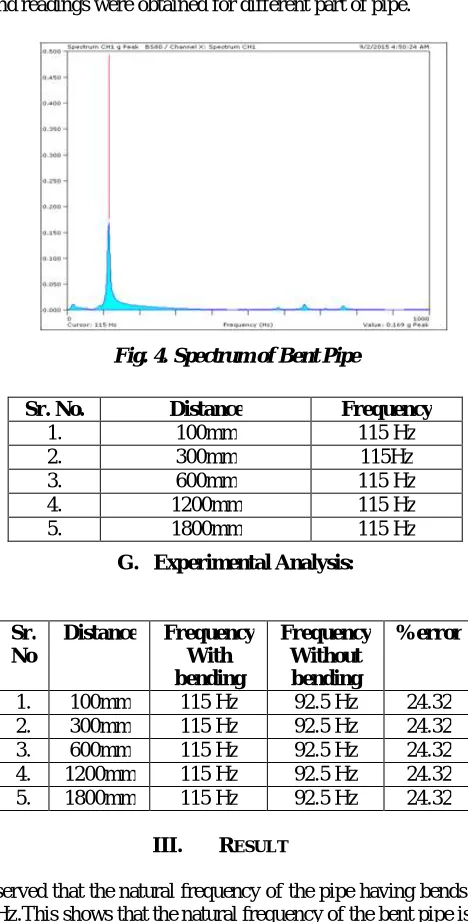
Similar sample of pipe of 1800mm length having diameter is taken whose natural frequency is to be determined. But this time the pipe is bend using bending machine. Because of bending, the wall thickness of the pipe is reduced. This pipe was placed on well cushioned surface to avoid unwanted vibration from the surface. Initially, the pipe was marked after 100mm to check natural frequency of the pipe throughout the length. Then using FFT analyzer, the sensor was placed on each marking and readings were obtained for different part of pipe.
Fig. 4. Spectrum of Bent Pipe
G. Experimental Analysis:
Sr. No
Distance Frequency With bending
Frequency Without bending
%error
1. 100mm 115 Hz 92.5 Hz 24.32 2. 300mm 115 Hz 92.5 Hz 24.32 3. 600mm 115 Hz 92.5 Hz 24.32 4. 1200mm 115 Hz 92.5 Hz 24.32 5. 1800mm 115 Hz 92.5 Hz 24.32
III. RESULT
From the above table, it is observed that the natural frequency of the pipe having bends is 92.5Hz and the pipe having no bends(straight pipe) is 115Hz.This shows that the natural frequency of the bent pipe is increased by 24.32%.
Sr. No. Distance Frequency
1. 100mm 115 Hz
2. 300mm 115Hz
3. 600mm 115 Hz
4. 1200mm 115 Hz
IV. CONCLUSION
From the experimental analysis we can conclude that the natural frequency of a straight pipe changes when bending operation is performed.
REFERENCES
[1.] V.P. Patekar and R.B. Patil, "Vibrational Analysis of Automotive Exhaust Silencer Based on FEM and FFT Analyzer",International Journal on Emerging Technologies 3(2): 1-3, 2012
[2.] Sibu Thomas, Nishi Shahnaj Haider, “A Study on basics of a spectrum analyzer“ International Journal of Advanced Research in Electrical, Electronics and Instrumentation Engineering, Vol. 2, 6, June 2013 .
[3.] 2.P.N. Rao, Manufacturing Technology, foundary, forming and welding, Tata McGraw-hill, New Delhi, 1994.