Simulation of Specular Surface Imaging Based
on Computer Graphics: Application on a Vision
Inspection System
Ralph Seulin
Laboratoire Le2i, CNRS FRE2309, EA 2421, Universit´e de Bourgogne, 71200 Le Creusot, France Email: [email protected]
Frederic Merienne
Laboratoire Le2i, CNRS FRE2309, EA 2421, Universit´e de Bourgogne, 71200 Le Creusot, France Email: [email protected]
Patrick Gorria
Laboratoire Le2i, CNRS FRE2309, EA 2421, Universit´e de Bourgogne, 71200 Le Creusot, France Email: [email protected]
Received 31 July 2001 and in revised form 11 January 2002
This work aims at detecting surface defects on reflecting industrial parts. A machine vision system, performing the detection of geometric aspect surface defects, is completely described. The revealing of defects is realized by a particular lighting device. It has been carefully designed to ensure the imaging of defects. The lighting system simplifies a lot the image processing for defect segmentation and so a real-time inspection of reflective products is possible. To bring help in the conception of imaging conditions, a complete simulation is proposed. The simulation, based on computer graphics, enables the rendering of realistic images. Simulation provides here a very efficient way to perform tests compared to the numerous attempts of manual experiments.
Keywords and phrases:reflective surface, online inspection, lighting, simulation.
1. INTRODUCTION
Highly reflective surfaces inspection is a problem met fre-quently within the automatic control of industrial parts [1, 2, 3]. This inspection is generally done manually. It im-plies subjectivity and tiredness influence on classification re-sults. A machine vision system offers objectivity, better relia-bility and repeatarelia-bility and is able to carry out defects mea-surement to classify the industrial parts quality.
This work aims at detecting surface defects on reflect-ing industrial parts. The objects to be controlled are highly reflective and so, act as perfect mirrors. Surface defects are dents, bumps, and scratches. The defects areas have the same reflective properties as the flawless area of the surface: they reflect incident light only in the specular direction. Indus-trial parts dimensions are 200×50 mm and defects surface is less than 1 mm2.
This paper describes a complete machine vision system development. We will present the inspection system based on a particular lighting device that enables efficient real time de-fect detection and some of the features design performed via computer graphics simulation.
2. SPECULAR SURFACE IMAGING AND DEFECTS DETECTION
2.1. Specular surface imaging
2.1.1 Lighting principle
Defect
Image Camera
1 : without defect Binary lighting
Dark zone Luminous zone
2 : with defect
Figure1: Lighting principle.
Camera Camera
d1 d
2
w1 w2
Figure2: Defect size variation.
of dark pixels among a luminous zone. Figure 1 illustrates the lighting principle and shows a typical image acquired with the lighting device. In the first case, without defect, the sur-face reflects a dark zone of the lighting. In the second case, the defect deflects luminous rays coming from the luminous zone and so, the defect appears as a clear spot in a dark zone. We choose to saturate the camera in order to obtain images where defects appear very contrasted on a dark background and so to enable a simple image processing for detection (see Section 2.2). In these illumination and imaging conditions, defects appear only as high gray level pixels in dark zones.
2.1.2 Implementation
In order to inspect the whole part surface, an element of the lighting structure has to scan every part of the surface. Dur-ing experiments, we noticed that the size of the defect signa-ture on the image depends on the distance between the light transition and the defect. It can be schematically explained as shown in Figure 2.
If the light transition, projected on the surface, is close to the defect, the defect size on the image is close to its real size. But if the distance between the defect and the light transi-tion increases, the defect size decreases and can even be null for an important distance. This particular property can be measured by computing the defect size from images acquired
1 2 3 4 5 6 7 8 9 10 1112 13141516 1718 1920 2122 23242526 30.00
40.00 50.00 60.00 70.00 80.00 90.00 100.00
Figure3: Defect size variation versus distance to the first light tran-sition (experimental results).
during experiments. Figure 3 represents a defect size (per-centage of real size) versus the distance between two light transitions and the center of the defect (normalized by the defect dimensions) and the corresponding images.
The image signature equals the physical size if the defect is close to a light transition and it decreases if the distance in-creases. In our industrial application, we have to obtain im-age signatures proportional to the defects physical size. So, the light transition has to scan all over the surface to ensure that each defect is close to a light transition in the image se-quence. To carry out surface inspection, we can imagine that the object is moving in front of the camera and the lighting system [4]. In the case of important surface curvature gradi-ents, the projection of the luminous and dark fringes on the complex geometry surface varies a lot between two consecu-tive images. So, entire scanning is not ensured if the object is moving in front of the static lighting. To overcome this lim-itation, an inverse process is proposed: the lighting structure is dynamic while the object is static.
Having static object during the inspection presents nu-merous advantages:
• the fringes projections and the position of the fringes between two images are completely mastered;
• an a priori knowledge of the object to be controlled can enable definition of region of interest in the surface inspection (see Section 2.2.2);
In order to reduce the number of necessary images to per-form the scanning of industrial parts, the lighting system is composed of juxtaposed luminous and dark fringes. It en-ables a large number of light transitions to scan the surface. The lighting devices have to be diffuse and homogenous. So, the lighting system is realized by luminous surfaces made of diffusers placed in front of fluorescent tubes. The luminous panels are then shaded by an opaque mask.
The surface aspect imaging is performed by different lighting system positions. The lighting system is translated along the main object axis. For each regular spatial position, an image is captured. We finally obtain an image sequence as seen in Figure 4.
2.2. Defects segmentation and measurements
2.2.1 Image sequence processing
In the sequence, defects always appear as high gray level pix-els because of the saturation of the Charge Couple Device (CCD) matrix. By computing the mean image of the se-quence, we obtain a synthetic image called aspectimage.In this image defects appear as high gray level pixels and the en-tire flawless area of the image appear with medium gray level (see Figure 5).
The segmentation of defects zones is then easy to com-pute because of the very contrasted aspect images. The seg-mentation processing consists in filtering the aspect image by a local (9×9 pixels) Gaussian filter and to subtract the result-ing image to the initial one. With this filter, segmentation of pixels belonging to clear thin areas (defects) from zones of homogenous gray levels (flawless area) is performed.
2.2.2 Postprocessing
A postprocessing is then applied on the segmented image to distinguish holes or bumps from scratches and to compute defects measurements.
Defects measurement
Defects measurement consists first in blob coloring to label the defects. Then each defect is analyzed individually by com-puting moments on its representing pixels. Two-dimensional moments have been successfully used for a number of image processing applications [5, 6]. For a digital image represented in a two-dimensional array, the moment of order (p+q) is given by
whereM andNare the horizontal and vertical dimensions and f(x, y) is the gray level at point (x, y). The zeroth or-der moment,m00, represents the total mass of the given
im-age. When computed for a silhouette image on a dark back-ground,m00represents the total object area. The two first
or-der moments,m10,m01, are used to locate the center of mass
of the object in the image. The coordinate of the center of massG(xG, yG) can be defined through moments as follows:
Figure4: Part of image sequence (experimental results).
Figure5: Aspect image (experimental results).
Holes
Scratch
Figure6: Segmented and classified defects.
xG=mm10
00, yG= m01
m00. (2)
So, by computing two-dimensional moments on the labeled image, the position (coordinate of the center of mass), the size (number of pixels representing the defect), and the weight (the sum of gray level pixels representing the defect in the aspect image) of each defect are computed. The defects are finally measured upon their size and weight.
The classification between bumps or holes versus scratches is made upon the compacity of defects (see Figure 6). The compacity of a shape is computed from the second-order central moments{µ20, µ11, µ02}, where
We consider that a shape is a hole or a bump if the fol-lowing relation is checked:
µ02−µ20
µ11 ≥k
or µ11
µ02−µ20 ≥k,
(4)
wherekis the chosen compacity factor. If the relation is not checked, the defect is considered as a scratch.
Regions of interest
Repositionned mask on current object ROI (medium gray level)
Silhouette of current object Predifined mask
Figure7: Definition of ROI by equivalent ellipse matching.
of false detection will perturb the classification of parts. A method is so proposed to define ROI on the industrial parts. This method consists in positioning a predefined mask on the object to be controlled. The first phase is to compute the silhouette of the object from the image sequence. The silhou-ette is reconstructed from the image sequence. The image se-quence represents the lighting scanning through the entire object surface. Then, by computing the sum of theNimages and by applying a flood fill method on the external recon-structed shape, the reconstruction of the object silhouette is effective. Once the silhouette obtained, we are able to match a predefined binary mask on the shape (see Figure 7). The matching is realized by fitting the equivalent ellipse of the shape to be controlled on the equivalent ellipse of the refer-ence shape on which the binary mask is defined. The equiv-alent ellipse of a shape is an ellipse which has the same geo-metrical moments as the shape. In our case, the shape fitting is realized by matching the center of mass and the orienta-tion of the two shapes. The center of mass is determined as described inPostprocessing(Section 2.2.2). The orientationα
is computed from the three second-order central moments
{µ20, µ11, µ02}:
tan(2α)= 2·µ11 µ02−µ20.
(5)
The fitting is computed by scaling, translating, and ro-tating the reference shape to make it matching the current shape.
This method is applied in our case to perform the defect detection only in smooth surface areas. The main advantages of this method is the translation, rotation, and scale invari-ance. The position and orientation of the objects can be ap-proximate. It simplifies consequently the parts manipulation and positioning on the production line.
2.3. Summary of the method
The specular surface inspection method can be summarized as shown in Figure 8.
3. SPECULAR SURFACE IMAGING SIMULATION
The imaging conditions have been particularly studied be-cause they influence strongly the quality of acquired im-ages and consequently, the quality of image processing re-sults. These imaging conditions are often the fact of
exper-Image
Figure8: Specular surface inspection algorithm.
iments: numerous attempts on lighting features and on the relative positions between the camera, the lighting, and the object are still necessary. To bring help in the choice of these imaging features, a complete simulation of the system is pro-posed.
3.1. Imaging system modeling
Lighting and imaging features need to be modeled in order to simulate the imaging process. In our case, the geometri-cal optics is applicable because the wavelength of the inci-dent light is weak compared to the dimensions of the sur-face imperfections [7]. The ray tracing technique is so used to analyze the reflection of the lighting through the surface. Each element of the scene is modeled and is described in this chapter.
3.1.1 Camera model
Because the geometrical optics is applicable, a pinhole model is used to describe the camera. The phenomenon of sensor saturation or blooming is extremely important within the framework of this application. It conditions the defect reveal-ing, computed by the mean image of the sequence.
(a) (b) (c)
Figure9: Saturation effect simulation.
Ray tracing image
Gaussian filter
Blurred image
×Gain
Simulated image
Figure10: Saturation effect model.
I N R
Figure11: Lighting reflection properties on perfectly specular sur-faces.
experimental saturated image, and (c) is the simulated sat-urated image from image (a).
To model the saturation effect, each image is processed by a filter (see Figure 10).
3.1.2 Object model
Lighting reflection properties
The reflection properties of the metal surfaces have been accurately studied [8]. A simple model is used here to de-scribe the lighting reflection on the polished metal surface. We consider that the surface is perfectly specular. So, the Snell-Descartes law is applicable (see Figure 11). The light is reflected with the same angle as the incoming ray and the re-flected luminous intensity is equal to the incoming one.
Industrial parts model
In the case of CAD/CAM (computer assisted design/ computer assisted manufacturing) designed and manufac-tured industrial parts, the CAD file is used for the object model. But most of times, the CAD model does not exist or is not sufficiently accurate for the modeling. In that case, we use a 3D scanner to obtain a range image of the surface to be controlled. The range image is then converted in a 3D model made of Non Uniform Rational B-Splines (NURBS) (see Figure 12).
Figure12: 3D object model.
Figure13: Bump mapping principle.
Defects model
Defects can be integrated in the 3D model of an object. De-fects are zones where the surface is affected by geometrical imperfections. The surface is still smooth in the defect zones, so the specular property is maintained. For example, a dent is modeled by a Gaussian curve. The Gaussian function char-acterizes the smoothness of the surface.
The influence of surface height and surface orientation on the lighting point reflected by the surface has been stud-ied [9]. This study is based on physical values taken from our machine vision prototype and is applicable in the case of a viewing point situated at a large distance from the ob-ject (compared to the defect dimensions). We demonstrate that the influence of the surface height induces negligible light rays’ deviations compared to the influence of the sur-face orientation. The defect sursur-face is so modeled as flat and is only described by its orientation. Normal vectors are com-puted from the surface model and completely describe the defect surface (see Figure 13). This kind of modeling can be compared to the bump mapping technique used in computer graphics to artificially represent the surface orientation mod-ification [10, 11].
3.1.3 Lighting model
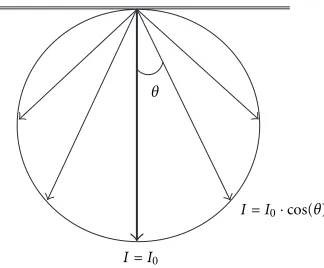
The lighting system was modeled in order to represent the developed prototype. The luminous zones are completely diffuse and homogenous. They can be modeled by Lam-bertian lighting sources. The lighting sources are shaded by opaque fringes where the luminous intensity is null. Figure 14 reminds the luminance law of a Lambertian light-ing source. The luminous intensity varies with the observa-tion angleθof the lighting source with a cosine law.
3.2. Simulation process
θ
I=I0
I=I0·cos(θ)
Figure14: Lambertian lighting model.
are modeled by vectors. For each pixelCof the CCD matrix, the lighting pointLreflected by the surface is computed from the reflected ray. Figure 15 describes this modeling.
Blue Moon Rendering Tools (BMRT) are used here for the rendering [12, 13]. BMRT are a collection of programs that render 3D scene models. BMRT use some Application Program Interfaces (APIs) that are very similar to those de-scribed in the published RenderMan Interface Specification [14]. This rendering kernel has been chosen for its possible custom settings for all scene elements features. Each element of the scene is controlled by a shader. A shader describes the object handling on the light rays. There is so a shader for the lighting device which sets the Lambertian luminous fringes and the dark ones. And an object shader defines the surface as perfectly specular.
4. APPLICATION
4.1. System features
The method proposed in the first chapter is applied to the detection of surface defects on reflecting industrial parts. The system features have been first chosen by experimental tests. The tests have proved the feasibility of the detection and a first prototype has been developed.
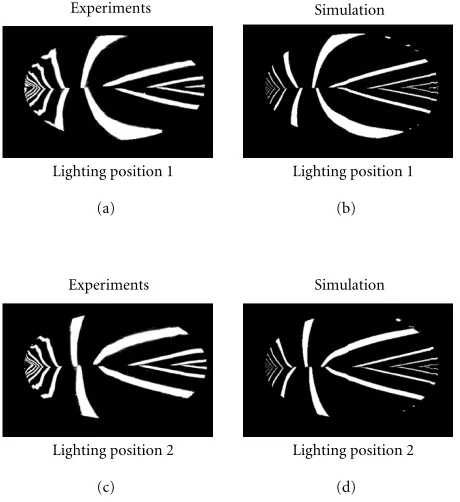
The lighting stripes are disposed in a tunnel made of two flat panels. It enables so a complete mastery of the environ-ment of industrial parts to be controlled. A high resolution CCD camera (1300×300 pixels), positioned vertically to the object plan, inspects the objects. We obtain a spatial resolu-tion of 0.15 mm per pixel. Defects appear with an average size of 5 pixels on the images. Binary lighting zones dimensions and images sequence capture features are computed as de-scribed in [9]. The surface inspection is performed by several lighting system positions realized by a translation of the tun-nel along the main object axis. A sequence of 24 images is captured during the lighting translation (see Figure 17). The camera captures images at a rate of 24 images per second, it enables to avoid theblur effectdue to the translation move-ment. The acquisition conditions are schematically repre-sented in Figure 16.
The homogeneity of the flawless area is critical in the de-fect segmentation. The imaging conditions have to be
cho-Lighting
Figure15: Imaging system modeling.
Camera
Figure16: Specular surface imaging system (principle schema).
sen in order to provide aspect images with a flawless area the more homogenous as possible. The homogeneity criterion is estimated on aspect image by computing the following equa-tion:
whereMandNare the horizontal and vertical dimensions of the image, f(x, y) is the gray level at point (x, y), andµis the mean luminance of the image,hmust be close to 1 or 100% to have a homogenous flawless area.
Figure 18 presents the aspect image resulting from the experimental sequence. The corresponding measured homo-geneity ish=85.6%.
Experiments
Lighting position 1 (a)
Simulation
Lighting position 1 (b)
Experiments
Lighting position 2 (c)
Simulation
Lighting position 2 (d)
Figure17: Part of image sequence (first experimental results and simulation).
Figure18: Aspect image form first experiments.
enables the simulation of industrial parts imaging. With the simulation, it is possible to simulate new imaging conditions and so to estimate the influence of scene elements features on the quality of acquired images and consequently the quality of image processing results. The simulation enables virtual tests on the acquisition conditions.
A new lighting system has been virtually tested by sim-ulation. This new system uses a semicylindrical tunnel. Figure 19 presents a simulated image sequence with the new lighting configuration. It provides better images features than the first one: the regularity of the projected stripes is better and the resulting aspect images are more homogenous (see Figure 20). The corresponding measured homogeneity ish=89.4%.
Simulated tests have been so performed before
construct-Lighting position 1
Lighting position 2
Lighting position 3
Figure19: Part of image sequence (simulation results).
Figure20: Aspect image resulting from the simulation.
ing a new and finalized prototype. Figure 21 presents a pho-tograph of the final prototype and the real sequence provided by the new developed prototype is presented in Figure 22. Figure 23 presents the aspect image resulting from the exper-imental sequence. The corresponding measured homogene-ity ish=88.8%.
Camera
Lighting tunnel Industrial
part Fluorescent
tubes
Light diffuser
Figure 21: Developed machine vision system (prototype photo-graph).
4.2. Performances
The machine vision prototype has been tested on 200 indus-trial parts sorted out by an expert. The tests have been made on a selection of parts affected by all possible defects. This industrial parts selection is not representative of the produc-tion quality, but enables to estimate the classificaproduc-tion possi-bilities of the machine vision system.
Two parameters were calculated. The first parameter is the size of the biggest defect detected on each part. The second parameter corresponds to the sum of the size of the detected defects. This last parameter is hence a func-tion of the number of defects on the part. The graph of Figure 24 presents results obtained for holes defects. Each point corresponds to the quality measurement of a part. This point is placed on the graph according to the two parame-ters calculated. Three classes have been proposed by the ex-pert (Perfect, Acceptable, and Rejected). For each parameter, a threshold has been defined to separate the three classes. The system is capable of distinguishing the class of defects pro-posed by the expert.
The diagram of Figure 25 presents results obtained for scratch defects. Two classes have been proposed by the expert (Perfect and Rejected). The parts are rejected as soon as they are not perfect. It is due to the segmentation processing for the scratches (see Section 2.2.2): if a scratch has a weak size, it is considered as a hole.
The machine vision prototype enables an efficient de-tection at the industrial production rate (1 part every 2 seconds). The sequence imaging time requires 1 second and the image processing takes 0.8 second (evaluated on a 700 MHz Pentium III based machine).
5. CONCLUSION AND FUTURE WORK
A machine vision system for specular surface inspection has been presented. This system enables the detection of
ge-Lighting position 1
Lighting position 2
Lighting position 3
Figure22: Part of image sequence (prototype results).
Figure23: Aspect image provided by the prototype and measured homogeneity.
Rejected Acceptable Perfect
0 2 4 6 8 10
Size of the biggest defect 0
Classification for “holes” defects (estimated on 200 samples)
Figure24: Classification of holes defects.
Rejected Perfect
0 10 20 30 40 50 60 70
Size of the biggest defect 0
Classification for “scratch” defects (estimated on 200 samples)
Figure25: Classification diagram for scratch defects.
been proposed. Each system device has been physically mod-eled and it enables to obtain realistic images. Simulation provides here a very efficient way to perform virtual tests compared to the necessary numerous attempts of the man-ual experiments. The use of simulation, based on computer graphics enables to save time in a machine vision system improvement.
Future work concerns the automatic optimization of the system via the simulation. The efficiency estimation of imag-ing conditions on the defect revealimag-ing and detection is stud-ied. By measuring the quality of the resulting images, it will be possible to automatically optimize the system via a gradient-based method.
ACKNOWLEDGMENT
These research works have been realized with the financial support of the Regional Council of Burgundy.
REFERENCES
[1] C. Sanderson, L. E. Weiss, and S. K. Nayar, “Structured high-light inspection of specular surfaces,” IEEE Trans. on Pattern Analysis and Machine Intelligence, vol. 10, no. 1, pp. 44–55, 1988.
[2] C. Bakolias and A. K. Forrest, “Dark field scheimflug imaging for surface inspection,” inProc. SPIE Machine Vision Applica-tions in Industrial Inspection V, vol. 3029, pp. 57–68, San Jose, Calif, USA, February 1997.
[3] B. G. Batchelor, D. A. Hill, and D. C. Hodgson, Automated Visual Inspection-Chapter 7: Lighting and Viewing Techniques, IFS Publications, Bedford, England, and North Holland, Am-sterdam, 1985.
[4] G. Delcroix, R. Seulin, B. Lamalle, P. Gorria, and F. Merienne, “Study of the imaging conditions and processing for the as-pect control of specular surfaces,” SPIE-Journal of Electronic Imaging, vol. 10, no. 1, pp. 196–202, 2001.
[5] Y. C. Chim, A. A. Kassim, and Y. Ibrahim, “Character recog-nition using statistical moments,” inImage and Vision Com-puting, vol. 17, pp. 299–307, March 1999.
[6] M.-K. Hu, “Visual pattern recognition by moment invari-ants,” IRE transactions on information theory, vol. 8, no. 2, pp. 179–187, 1962.
[7] S. K. Nayar, K. Ikeuchi, and T. Kanade, “Surface reflection: physical and geometrical perspectives,”IEEE Trans. on Pattern Analysis and Machine Intelligence, vol. 13, no. 7, pp. 611–634, 1991.
[8] P. Kierkegaard, “Reflection properties of machined metal sur-faces,”Optical Engineering, vol. 35, no. 3, pp. 845–857, 1996. [9] R. Seulin, F. Merienne, and P. Gorria, “Dynamic lighting
sys-tem for specular surface inspection,” inMachine Vision Appli-cations in Industrial Inspection IX, vol. 4301 ofSPIE Proceed-ings, San Jose, Calif, USA, 2001.
[10] J. F. Blinn, “Simulation of wrinkled surfaces,” inProc. Siggraph ’78, Computer Graphics, vol. 12, pp. 286–292, 1978.
[11] J. J. Zhang, “Least distorted bump mapping onto surface patches,” Computers and Graphics, vol. 22, no. 2–3, pp. 233– 242, 1998.
[12] L. Gritz and J. K. Hahn, “BMRT: a global illumination imple-mentation of the RenderMan standard,” Journal of Graphics Tools, vol. 1, no. 3, pp. 29–47, 1996.
[13] A. A. Apodaca and L. Gritz, “Advanced RenderMan: Creat-ing CGI for motion pictures,” inThe Morgan Kaufmann Se-ries in Computer Graphics and Geometric Modeling, Decem-ber 1999, ISBN 1-55860-618-1. Official RenderMan website: http://www.pixar.com/.
[14] S. Upstill, The Renderman Companion: A Programer’s Guide to Realistic Computer Graphics, Addison-Wesley, July 1989.
Frederic Merienne received his engi-neer’s degree from the “ ´Ecole Nationale Sup´erieure d’Arts et M´etiers” in 1992. He obtained his Ph.D. in January 1996 in electronics at the “Institut National Polytechnique de Grenoble.” Since 1996, he is Maˆıtre de Conferences at the Le2i, at the University of Burgundy, France. His research interests are focused on image processing for quality control by artificial
vision, the methods and tools for the simulation of imaging systems for the help design with computers graphics techniques, and the help design with virtual reality technologies.
Patrick Gorriareceived his engineering de-gree from the ENSAM, France, in 1980. He received his Ph.D. degree from the Univer-sity of Burgundy, France, in 1984. Since 1993, he has been a professor at the Labo-ratory Le2i of Image Processing in the In-stitut Universitaire de Technologie (IUT) Le Creusot, where he is engaged in research and teaching on quality control by artificial vision. He has contributed to several areas