Performance Characterization of Data Mining Applications using MineBench
Joseph Zambreno
Berkin ¨
Ozıs.ıkyılmaz
Gokhan Memik
Alok Choudhary
Department of Electrical Engineering and Computer Science
Northwestern University
Evanston, IL 60208
{
zambro1, boz283, memik, choudhar
}
@eecs.northwestern.edu
Jayaprakash Pisharath
Architecture Performance and Projections Group
Intel Corporation
Santa Clara, CA 95054
[email protected]
Abstract
Data mining is the process of finding useful patterns in large sets of data. These algorithms and techniques have become vital to researchers making discoveries in diverse fields, and to businesses looking to gain a competitive ad-vantage. In recent years, there has been a tremendous increase in both the size of the data being collected and also the complexity of the data mining algorithms them-selves. This rate of growth has been exceeding the rate of improvements in computing systems, thus widening the per-formance gap between data mining systems and algorithms. The first step in closing this gap is to analyze these algo-rithms and understand their bottlenecks. In this paper, we present a set of representative data mining applications we call MineBench. We evaluate the MineBench applications on an 8-way shared memory machine and analyze some im-portant performance characteristics. We believe that this information can aid the designers of future systems with re-gards to data mining applications.
1. Introduction
Data mining is a powerful technology that converts raw data into an understandable and actionable form, which can then be used to predict future trends or provide meaning to historical events. Originally limited to scientific research and medical diagnosis, these techniques are becoming cen-tral to a variety of fields including marketing and business intelligence, biotechnology, multimedia, and security.
Increasingly large amounts of data are being collected every year. Recent trends indicate that data collection rates are growing at an exponential pace. A survey done by In-tel Corporation indicates that an average person collects 800MB of data a year [14]. Data mining is essential to ex-tract useful information from such large amounts of data. However, limitations in overall system performance (recent computing trends indicate memory-intensive workloads are improving by only 10-15% every year) will ultimately result in prohibitive execution times for these crucial applications. Hence, there is a need to redesign and customize systems with respect to data mining applications. Given the fact that each data mining domain is unique, this is a challenging task that cannot be accomplished through simple algorith-mic analysis. As data mining is a relatively new applica-tion area, very little is known in terms of the characteristics of the underlying computations and data manipulation, and their impact on computer systems.
We address this issue in this paper by investigating the execution of data mining applications on a shared-memory parallel machine. We first establish a benchmarking suite of applications that we call MineBench, which encompasses many algorithms commonly found in data mining. We then analyze the architectural properties of these applications to investigate the performance bottlenecks associated with them.
The remainder of this paper is organized as follows. In the following section we provide a brief overview of the re-lated work in this area. In Section 3, we discuss the data mining applications that are included in our benchmarking suite. Section 4 presents our evaluation methodology,
fol-Table 1. Overview of the MineBench data mining benchmark suite
Application Category Description
ScalParC Classification Decision tree classification
k-Means Clustering Mean-based data partitioning method
Fuzzy k-Means Clustering Fuzzy logic-based data partitioning method
HOP Clustering Density-based grouping method
Apriori ARM Horizontal database, level-wise mining based on Apriori property
Utility ARM Utility-based association rule mining
SNP Classification Hill-climbing search method for DNA dependency extraction
GeneNet Structure Learning Gene relationship extraction using microarray-based method
SEMPHY Structure Learning Gene sequencing using phylogenetic tree-based method
Rsearch Classification RNA sequence search using stochastic Context-Free Grammars
SVM-RFE Classification Gene expression classifier using recursive feature elimination
PLSA Optimization DNA sequence alignment using Smith-Waterman optimization method
lowed by performance characterization results. Finally, the paper is concluded in Section 5 with a look towards some planned future efforts.
2. Related Work
Benchmarks play a major role in all domains. SPEC [28] benchmarks have been well accepted and used by several chipmakers and researchers to measure the effectiveness
of their designs. Other fields have popular
benchmark-ing suites designed for the specific application domain: TPC [31] for database systems, SPLASH [32] for parallel architectures, and MediaBench [20] for media and commu-nication processors.
Similar performance characterization work to ours has been previously performed for database workloads [13, 18], with some of these efforts specifically targeting SMP ma-chines [25, 30]. Performance characterization of an indi-vidual data mining algorithm has been done [8, 19], where the authors focus on the memory and cache behavior of a decision tree induction program.
Characterization and optimization of data-mining work-loads is a relatively new field. Our work builds on prior effort in analyzing the performance scalability of bioinfor-matic workloads performed by researchers at Intel
Corpo-ration [10]. As will be described in the following
sec-tions, we incorporate their bioinformatics workloads into our MineBench suite, and where applicable, make direct comparisons between their results and our own. MineBench is more generic and covers a wider spectrum then the bioin-formatics applications studied in [10]. The authors in [16] examined the last-level cache performance of these same applications.
The bioinformatic applications presented in MineBench differ from other recently-developed bioinformatic
bench-mark suites. BioInfoMark [21], BioBench [3], and BioP-erf [5] all contain several applications in common, includ-ing Blast, FASTA, Clustalw, and Hmmer.
3. Benchmark Suite Overview
Data mining applications can be broadly classified into association rule mining, classification, clustering, data visu-alization, sequence mining, similarity search, and text min-ing, among others. Each domain contains unique algorith-mic features. In establishing MineBench, we based our se-lection of categories on how commonly these applications are used in industry, and how likely they are to be used in the future. The twelve applications that currently comprise MineBench are listed in Table 1, and are described in more detail in the following sections. Note that these are full-fledged application implementations of these algorithms (as opposed to stand-alone algorithmic modules), which have been extensively optimized to remove all implementation inefficiencies.
3.1. Classification Workloads
A classification problem has an input dataset called the training set which consists of example records with a num-ber of attributes. The objective of a classification algorithm is to use this training dataset to build a model such that the model can be used to assign unclassified records into one of the defined classes [12].
ScalParC is an efficient and scalable variation of
deci-sion tree classification [17]. The decideci-sion tree model is built by recursively splitting the training dataset based on an op-timality criterion until all records belonging to each of the partitions bear the same class label. Among many classifi-cation methods proposed over the years, decision trees are
particularly suited for high-performance data mining, since they can be built relatively fast when compared to other methods.
Single nucleotide polymorphisms (SNPs), are DNA se-quence variations that occur when a single nucleotide is al-tered in a genome sequence. The SNP [10] benchmark uses the hill climbing search method, which selects an initial starting point and searches that point’s nearest neighbors. The neighbor that has the highest score is then made the new current point. This procedure iterates until it reaches a local maximum score. GeneNet [10] uses a similar hill climbing algorithm as in SNP, the main difference being that the input data is more complex, requiring much additional computation during the learning process.
SEMPHY [10] is a structure learning algorithm that is
based on phylogenetic trees. Phylogenetic trees represent the genetic relationship of a species, with closely related species placed in nearby branches. This application uses a probability estimation algorithm to find the best tree topol-ogy and best branch lengths representing the distance be-tween two neighbors.
Typically, RNA sequencing problems involve search-ing the gene database for homologous RNA sequences.
Rsearch [10] uses a grammar-based approach to achieve this
goal. Stochastic context-free grammars are used to build and represent a single RNA sequence, and a local align-ment algorithm is used to search the database for homolo-gous RNAs.
SVM-RFE [10], or Support Vector Machines - Recursive
Feature Elimination, is a feature selection method. SVM-RFE is used extensively in disease finding (gene expres-sion). The selection is obtained by a recursive feature elim-ination process - at each RFE step, a gene is discarded from the active variables of a SVM classification model, accord-ing to some support criteria.
3.2. Clustering Workloads
Clustering is the process of discovering the groups of similar objects from a database to characterize the underly-ing data distribution [12]. It has wide applications in market or customer segmentation, pattern recognition, and spatial data analysis.
The first clustering application in MineBench is
K-means [23]. K-K-means represents a cluster by the mean value
of all objects contained in it. Given the user-provided
pa-rameterk, the initialkcluster centers are randomly selected
from the database. Then, each object is assigned a nearest cluster center based on a similarity function. Once the new assignments are completed, new centers are found by find-ing the mean of all the objects in each cluster. This process is repeated until some convergence criteria is met.
The clusters provided by the K-means algorithm are
sometimes called “hard” clusters, since any data object ei-ther is or is not a member of a particular cluster. The Fuzzy
K-means algorithm [7] relaxes this condition by assuming
that a data object can have a degree of membership in each cluster. Compared to the similarity function used in K-means, the calculation for fuzzy membership results in a higher computational cost. However, the flexibility of as-signing objects to multiple clusters might be necessary to generate better clustering qualities.
HOP [11], originally proposed in astrophysics, is a
typ-ical density-based clustering method. After assigning an estimation of the density for each particle, HOP associates each particle with its densest neighbor. The assignment pro-cess continues until the densest neighbor of a particle is it-self.
3.3. ARM Workloads
The goal of Association Rule Mining (ARM) is to find the set of all subsets of items or attributes that frequently occur in database records [12]. In addition, ARM appli-cations extract rules regarding how a given subset of items influence the presence of another subset.
Apriori [2] is arguably the most influential ARM
algo-rithm. It explores the level-wise mining of the property that all non-empty subsets of a frequent itemset must all be fre-quent (the so-called “Apriori” property). Utility mining [22] is another association rule-based mining technique where higher “utility” itemsets are identified from a database by considering different values of individual items. The goal of utility mining is to restrict the size of the candidate set so as to simplify the total number of computations required to calculate the value of items.
3.4. Optimization Workloads
Sequence alignment is an important tool in bioinformat-ics used to identify the similar and diverged regions between two sequences. PLSA [10] uses a dynamic programming ap-proach to solve this sequence matching problem. It is based on the algorithm proposed by Smith and Waterman, which uses the local alignment to find the longest common sub-string in sequences.
4. Performance Characterization
In this section, we consider the applications in our MineBench suite, and distinguish the characteristics that make each application unique from both the algorithmic and the system perspective. We chose an Intel IA-32 multipro-cessor platform for evaluation purposes. Our setup consists of an Intel Xeon 8-way Shared Memory Parallel (SMP) ma-chine running Red Hat Advanced Server 2.1. The system
has 4 GB of shared memory. Each processor has a 16 KB non-blocking, integrated L1 cache and a 1024 KB L2 cache. For our experiments, we use the VTune Performance An-alyzer [15] for profiling the functions within our applica-tions, and for measuring the execution times. Using the VTune counters, we monitor a wide assortment of perfor-mance metrics: execution time, communication and syn-chronization complexity, memory behavior, and Instruc-tions per Cycle (IPC) statistics. Each application was com-piled with version 7.1 of the Intel C++ compiler for Linux.
4.1. Input Datasets
Input data is an integral part of data mining applications. The data used in our experiments are either real-world data obtained from various fields or widely-accepted synthetic data generated using existing tools that are used in scien-tific and statistical simulations. During evaluation, multiple data sizes were used to investigate the characteristics of the MineBench applications. For the non-bioinformatics appli-cations, the input datasets were classified into three different sizes: Small, Medium, and Large. For the ScalParC bench-mark, three synthetic datasets were generated by the IBM Quest data generator [1]. Apriori also uses three synthetic datasets from the IBM Quest data generator with a varying number of transactions, average transaction size, and aver-age size of the maximal large itemsets. For HOP, three sets of real data were extracted from a cosmology application, ENZO [24], each having 61440 particles, 491520 particles and 3932160 particles.
A section of the real image database distributed by Corel Corporation is used for K-means and Fuzzy K-means. This database consists of 17695 scenery pictures. Each picture is represented by two features: color and edge. The color feature is a vector of 9 floating points while the edge feature is a vector of size 18. Both K-means implementations use Euclidian distance as the similarity function and execute it for the two features separately. Since the clustering quality of K-means methods highly depends on the input parameter k, both K-means were executed with 10 different k values ranging from 4 to 13.
Utility mining uses both real as well as synthetic datasets. The synthetic data consists of two databases gen-erated using the IBM Quest data generator. The first syn-thetic dataset is a dense database, where the average trans-action size is 10; the other is a relatively sparse database, where average transaction size is 20. The average size of the potentially frequent itemsets is 6 in both sets of databases. In both sets of databases, the number of transactions varies from 1000K to 8000K and the number of items varies from 1K to 8K. The real dataset consists of only one database of size 73MB, where the average transaction length is 7.2.
For the bioinformatics applications, the datasets were
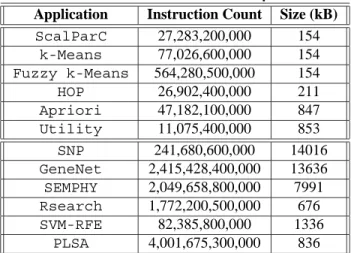
Table 2. MineBench executable profiles Application Instruction Count Size (kB) ScalParC 27,283,200,000 154 k-Means 77,026,600,000 154 Fuzzy k-Means 564,280,500,000 154 HOP 26,902,400,000 211 Apriori 47,182,100,000 847 Utility 11,075,400,000 853 SNP 241,680,600,000 14016 GeneNet 2,415,428,400,000 13636 SEMPHY 2,049,658,800,000 7991 Rsearch 1,772,200,500,000 676 SVM-RFE 82,385,800,000 1336 PLSA 4,001,675,300,000 836
provided by Intel [10]. SNP uses the Human Genic
Bi-Alletic Sequences (HGBASE) database [9] containing 616,179 SNPs sequences. For GeneNet, the microarray data used for this study is assembled from [27]; they are the most popular cell cycle data of Yeast. SEMPHY con-siders three datasets from the Pfam database [6]. The soft-ware and the corresponding dataset for Rsearch were ob-tained from [26]. The experiments use the sequence mir-40.stk with the length of 97 to search a part of database Yeastdb.fa with size of 100KB. SVM-RFE uses a bench-mark microarray dataset on ovarian cancer [4]. This dataset contains 253 (tissue samples) x 15154(genes) expression values, including 91 control and 162 ovarian cancer tissues with early stage cancer samples. For PLSA, nucleotides ranging in length from 30K to 900K are chosen as test se-quences. Since true sequences can seldom satisfy this spe-cific size, some artificial sequences were used in the experi-ments [10]. To make the experiexperi-ments more comprehensive, several real DNA sequences were also chosen from a test suite provided by the bioinformatics group at Penn State University. The longest sequence pair used here is named TCR where the human sequence is 319,030 bp long and the mouse sequence is 305,636 bp long.
4.2. Execution Time
In Table 2 we present the total number of instructions executed across all processors along with the size of the ex-ecutables. We can see that these benchmarks execute from tens of billions to thousands of billions instructions. In our study, the usage of Vtune enabled us to examine the charac-teristics of entire program execution, something that would not be feasible using simulation for applications of this size. Figure 1 shows the benchmark application execution speedups when running on multiple processors. The per-formance numbers for the 2-processor case shows some
k-Means 0.0 1.0 2.0 3.0 4.0 5.0 6.0 7.0 8.0 1 2 4 8 Number of Processors R e lativ e S p ee d u p S M L Fuzzy k-Means 0.0 1.0 2.0 3.0 4.0 5.0 6.0 7.0 1 2 4 8 Number of Processors R e lativ e S p ee d u p S M L HOP 0.0 1.0 2.0 3.0 4.0 5.0 6.0 7.0 1 2 4 8 Number of Processors R e lativ e S p ee d u p S M L Apriori 0.0 1.0 2.0 3.0 4.0 5.0 1 2 4 8 Number of Processors R e lat iv e S p ee dup S M L ScalParC 0.0 1.0 2.0 3.0 4.0 5.0 6.0 1 2 4 8 Number of Processors R e lativ e S p ee d u p S M L SVM-RFE 0.0 0.2 0.4 0.6 0.8 1.0 1.2 1.4 1.6 1.8 1 2 4 8 Number of Processors R e lat iv e S p ee dup M PLSA 0.0 1.0 2.0 3.0 4.0 5.0 1 2 4 8 Number of Processors R e lativ e S p ee d u p S M L Semphy 0.0 0.5 1.0 1.5 2.0 2.5 3.0 3.5 1 2 4 8 Number of Processors R e lativ e S p ee d u p S M L Rsearch 0.0 1.0 2.0 3.0 4.0 5.0 6.0 7.0 8.0 1 2 4 8 Number of Processors R e lativ e S p ee d u p S L SNP 0.0 0.2 0.4 0.6 0.8 1.0 1.2 1.4 1 2 4 8 Number of Processors R e lativ e S p ee d u p M Genenet 0.0 1.0 2.0 3.0 4.0 5.0 6.0 7.0 1 2 4 8 Number of Processors R e lativ e S p ee d u p M Utility 0.0 1.0 2.0 3.0 4.0 5.0 6.0 7.0 8.0 1 2 4 8 Number of Processors R e lativ e S p ee d u p S L
Figure 1. Performance speedups for the MineBench applications
trivial performance improvement for clustering and ARM workloads, while most of the remaining workloads perform slightly better or worse than the serial case. On the other hand, several of the benchmarks show good scalability with a higher number of processors. When running on 8 pro-cessors, ScalParC executed between 4.84 and 4.97 times faster than the 1 processor case. The best speedup, 7.55 on 8 processors, is seen in Utility. In this algorithm, data is uniformly distributed to the 8 processors, which are able to work concurrently by accessing only its respective data block in memory, synchronizing only occasionally. Rsearch and k-Means follow Utility in terms of achieved speedups. In general, it can be observed that clustering algorithms show better scalability than the remainder of the applica-tions. The underlying reason for this observation is the highly parallelizable distance calculation routine, which is common to the clustering algorithms.
The worst scalability is observed for SNP and
SVM-RFE. For SVM-RFE, the problem arises due to unnecessary communication problems and locking of memory struc-tures. This redundant locking is done to ensure the code works on distributed and shared memory machines. If the locks are removed (using shared memory programming), the program and its kernels scale better.
As previously mentioned, for the Utility benchmark the small dataset represents real data collected from a grocery store. The large dataset has been created by the IBM Quest data generator. Both of the datasets contain a nearly equal number of transactions and items. However, the speedups for these two datasets differ widely. When the most time consuming functions are examined, it is seen that the pro-gram spends approximately 30% and 50% of the total ex-ecution time in the serial database read function, respec-tively. The change in the time of this serial segment causes the scalability problems for the large dataset.
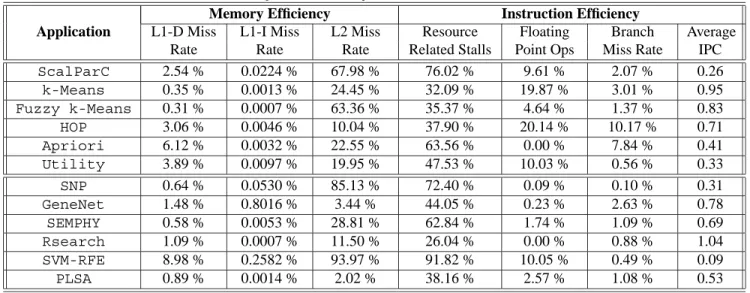
per-Table 3. Key MineBench performance characteristics Application
Memory Efficiency Instruction Efficiency
L1-D Miss Rate L1-I Miss Rate L2 Miss Rate Resource Related Stalls Floating Point Ops Branch Miss Rate Average IPC ScalParC 2.54 % 0.0224 % 67.98 % 76.02 % 9.61 % 2.07 % 0.26 k-Means 0.35 % 0.0013 % 24.45 % 32.09 % 19.87 % 3.01 % 0.95 Fuzzy k-Means 0.31 % 0.0007 % 63.36 % 35.37 % 4.64 % 1.37 % 0.83 HOP 3.06 % 0.0046 % 10.04 % 37.90 % 20.14 % 10.17 % 0.71 Apriori 6.12 % 0.0032 % 22.55 % 63.56 % 0.00 % 7.84 % 0.41 Utility 3.89 % 0.0097 % 19.95 % 47.53 % 10.03 % 0.56 % 0.33 SNP 0.64 % 0.0530 % 85.13 % 72.40 % 0.09 % 0.10 % 0.31 GeneNet 1.48 % 0.8016 % 3.44 % 44.05 % 0.23 % 2.63 % 0.78 SEMPHY 0.58 % 0.0053 % 28.81 % 62.84 % 1.74 % 1.09 % 0.69 Rsearch 1.09 % 0.0007 % 11.50 % 26.04 % 0.00 % 0.88 % 1.04 SVM-RFE 8.98 % 0.2582 % 93.97 % 91.82 % 10.05 % 0.49 % 0.09 PLSA 0.89 % 0.0014 % 2.02 % 38.16 % 2.57 % 1.08 % 0.53
formance scalability of the bioinformatics workloads [10]. When the above presented results are compared to their re-sults, Genenet, Semphy, Rsearch, and PLSA show very sim-ilar scalability trends. However the results are very differ-ent for SNP and SVM-RFE, where they are able to have close to linear speedup until 8 processors and super-linear speedup for 16 processors. The explanation given for this super-linearity is that Intel’s system is composed of a 16-way shared memory machine, which has a large L3 cache and Cell-sharing L4 caches (4 processors grouped together) that are interconnected with each other through the crossbar. Specific optimizations have been applied to these codes tar-geting their system.
4.3. Memory Hierarchy Behavior
Studies have indicated that memory hierarchy is a sig-nificant performance bottleneck in modern computing sys-tems. Consequently, understanding the program character-istics from the memory hierarchy is essential to improve the overall performance.
Table 3 summarizes the results obtained for both mem-ory behavior and instruction efficiency. The results were obtained by running the applications on 8 processors with the medium-sized datasets where applicable. The results presented here represent an average across the 8 processors. We can make several observations regarding the memory behavior. First, although the L1 data cache miss rates are usually small, we see that the applications are drastically different in their L1 data cache behavior. We can separate the applications into two categories: those that have a fairly small miss rate (less than 1.5%), and those that have a larger miss rate (2–9%). We can see that the applications with low miss rates tend to have a larger IPC values. Second, we see
that throughout the applications, the L1 instruction cache miss rates (normalized to the number of instructions retired) are very low. This is due to the fact that these applications are relatively small in size and the instructions are able to fit into the L1 cache.
We also performed an analysis of the L2 cache behav-ior. The L2 miss rates are many times greater than their L1 counterparts. When the L1 miss rate is so small, it is not surprising that many of these data references that miss in the L1 cache would also not be found in the L2 cache. The SVM-RFE benchmark had the worst L2 miss rate (93.97%). Combined with the low L1 efficiency, this means that for SVM-RFE approximately 8.44% of all data references re-quired off-chip memory access, which causes a very low IPC for this application. In general, L2 cache performance varies largely across applications. One reason for this kind of behavior is that the data distribution is random as dy-namic scheduling is used for parallelization for some of the applications. In dynamic schemes, the processor gets as-signed a new block of data in a random fashion as it be-comes available. Hence, the data gets distributed to multiple caches in a random fashion, which increases the likelihood of not exploiting spatial or temporal data locality. Another reason for the high L2 cache miss rates for certain applica-tions are due to the streaming nature of data retrieval, which does not provide opportunities for data reuse.
4.4. Instruction Efficiency
We also studied the instruction efficiency using the coun-ters profiled by VTune. Particularly, we measure the branch misprediction rates, resource related stalls (stalls caused by register renaming buffer entries, memory buffer entries, and branch misprediction recovery), the fraction of the
floating-point instructions, and the Instructions per Cycle (IPC) val-ues observed. These results are also summarized in Table 3.
In general the branch prediction is performing very well for most of the applications, with a misprediction rate of less than 3%. This is mostly due to the fact that the al-gorithms are parallelized implicitly using OpenMP, which is very good at analyzing large loops to extract data par-allelism in an efficient way. The highest branch miss rate is observed for the HOP application. This is partly due to the algorithmic nature of the program. This code reads the dataset in a parallel manner and works on local data for the most part - only synchronizing occasionally. The code does not have any parallel for loops, hence the branch mispredic-tion rate increases.
We have also looked at the number of floating point op-erations performed by the applications. In most of them, the number of floating point operations is significantly high, which indicates the extensive amount of (repetitive) compu-tations performed on the fetched data. Note that Apriori and PLSA are integer applications and do not contain any float-ing point operations.
In addition, we have analyzed the resource related stall rates. We see that most applications suffer from high stall rates. Particularly, the SVM-RFE applications spends 92% of its execution time on stalls. Since this applications ex-hibits a large rate of cache misses, the instructions spend more time in the pipeline, which causes an increase in the resource related stalls. In general, we also observe a cor-relation between the number of floating point instructions and the resource related stalls. As the fraction of floating point operations increase, the processor is able to utilize its resources better and stalls less. On the other hand, for some applications (e.g., Utility and SVM-RFE), other effects such as the large cache miss rates result in a higher rate of stalls. To express the efficiency of our applications, the num-ber of instructions per cycle has been studied. It can be seen that some applications suffer very low IPCs. For ex-ample, the SVM-RFE application sees an IPC value of 0.09. The reason for such low IPCs are different: SVM-RFE and SNP’s low IPCs are related to the high resource related stall percentages, 92% and 72% respectively; SVM, ScalparC and Utility, on the other hand, are affected by high L1 data cache miss rates; and lastly Hop and Apriori seem to suf-fer from high branch mispredictions. These results indicate that there is significant room to improve the performance of the applications by increasing their efficiencies.
5. Conclusion
In this paper, we introduced and evaluated MineBench, a benchmarking suite for data mining applications. We have studied important characteristics of the applications when
executed on an 8-way SMP machine. Overall, our results indicate that there is ample scope for improvement in the performance of both data mining algorithms and systems.
MineBench is intended for use in computer architecture research, systems research, performance evaluation, and
high-performance computing. MineBench is completely
open and freely available for download from our Center’s website [29].
Acknowledgments
This work was supported in part by the National Sci-ence Foundation (NSF) under grants CNS-0404341, IIS-0536994, and CCF-0444405, and by a research grant from Intel Corporation. The authors would like to thank Pradeep Dubey, Carole Dulong, and others from the Corporate Tech-nology Group at Intel for providing a set of scientific data-intensive workloads and for their valuable feedback.
References
[1] R. Agrawal, A. Arning, T. Bollinger, M. Mehta, J. Shafer, and R. Srikant. The Quest data mining system. In
Pro-ceedings of the 2nd International Conference on Knowledge Discovery in Databases and Data Mining, Aug. 1996.
[2] R. Agrawal, H. Mannila, R. Srikant, H. Toivonen, and A. Verkamo. Fast discovery of association rules. Advances
in Knowledge Discovery and Data Mining, pages 307–328,
1996.
[3] K. Albayraktaroglu, A. Jaleel, X. Wu, M. Franklin, B. Jacob, C. Tseng, and D. Yeung. BioBench: A benchmark suite of bioinformatics applications. In Proceedings of The 5th
In-ternational Symposium on Performance Analysis of Systems and Software (ISPASS), Mar. 2005.
[4] C. Ambroise and G. J. McLachlan. Selection bias in gene extraction on the basis of microarray gene-expression data. Proceedings of the National Academy of Sciences,
99(10):6562–6566, 2002.
[5] D. Bader, Y. Li, T. Li, and V. Sachdeva. BioPerf: A bench-mark suite to evaluate high-performance computer architec-ture on bioinformatics applications. In Proceedings of the
IEEE International Symposium on Workload Characteriza-tion (IISWC), Oct. 2005.
[6] A. Bateman, L. Coin, R. Durbin, R. Finn, V. Hollich, S. Griffiths-Jones, A. Khanna, M. Marshall, S. Moxon, E. Sonnhammer, D. Studholme, C. Yeats, and S. Eddy. The Pfam protein families database. Nucleic Acids Research, 32(Database):D138–D141, 2004.
[7] J. Bezdek. Pattern Recognition with Fuzzy Objective
Func-tion Algorithms. Kluwer Academic Publishers, 1981.
[8] J. Bradford and J. Fortes. Performance and memory-access characterization of data mining applications. In Workload
Characterization: Methodology and Case Studies, pages
[9] A. Brookes, H. Lehvaslaiho, M. Siegfried, J. Boehm, Y. Yuan, C. Sarkar, P. Bork, and F. Ortigao. HGBASE: a database of SNPs and other variations in and around human genes. Nucleic Acids Research, 28(1):356–360, Jan. 2000. [10] Y. Chen, Q. Diao, C. Dulong, W. Hu, C. Lai, E. Li, W. Li,
T. Wang, and Y. Zhang. Performance scalability of data-mining workloads in bioinformatics. Intel Technology
Jour-nal, 09(12):131–142, May 2005.
[11] D. Eisenstein and P. Hut. Hop: A new group finding al-gorithm for N-body simulations. Journal of Astrophysics, (498):137–142, 1998.
[12] J. Han and M. Kamber. Data Mining: Concepts and
Tech-niques. Morgan Kaufmann Publishers, Aug. 2000.
[13] R. Hankins, T. Diep, M. Annavaram, B. Hirano, H. Eric, H. Nueckel, and J. Shen. Scaling and characterizing database workloads: Bridging the gap between research and practice. In Proceedings of the 36th International
Sympo-sium on Microarchitecture, pages 76–87, Dec. 2003.
[14] Intel Corporation. Architecting the era of tera - technical white paper. Available at http://www.intel.com, 2005. [15] Intel Corporation. Intel VTune performance analyzer 7.2.
Available at http://www.intel.com, 2005.
[16] A. Jaleel, M. Mattina, and B. Jacob. Last Level Cache (LLC) performance of data mining workloads on a CMP – a case study of parallel bioinformatics workloads. In Proceedings
of the 12th International Symposium on High Performance Computer Architecture (HPCA), Feb. 2006.
[17] M. Joshi, G. Karypis, and V. Kumar. ScalParC: A new scal-able and efficient parallel classification algorithm for mining large datasets. In Proceedings of the 11th International
Par-allel Processing Symposium (IPPS), 1998.
[18] K. Keeton, D. Patterson, Y. Q. He, R. Raphael, and W. Baker. Performance characterization of a quad Pentium Pro SMP using OLTP workloads. In Proceedings of the 25th
International Symposium on Computer Architecture (ISCA),
pages 15–26, June 1998.
[19] J. Kim, X. Qin, and Y. Hsu. Memory characterization of a parallel data mining workload. In Workload
Characteri-zation: Methodology and Case Studies, pages 60–70, Nov.
1998.
[20] C. Lee, M. Potkonjak, and W. H. Mangione-Smith. Me-diaBench: A tool for evaluating and synthesizing multime-dia and communications systems. In Proceedings of 30th
Annual International Symposium on Microarchitecture (MI-CRO), pages 330–335, Dec. 1997.
[21] Y. Li, T. Li, T. Kahveci, and J. Fortes. Workload charac-terization of bioinformatics applications. In Proceedings of
the 13th IEEE International Symposium on Modeling, Anal-ysis, and Simulation of Computer and Telecommunication Systems (MASCOTS), pages 15–22, Sept. 2005.
[22] Y. Liu, W. Liao, and A. Choudhary. A two-phase algorithm for fast discovery of high utility itemsets. In Proceedings of
the Pacific-Asia Conference on Knowledge Discovery and Data Mining (PAKDD), May 2005.
[23] J. MacQueen. Some methods for classification and analysis of multivariate observations. In Proceedings of the
Berke-ley Symposium on Mathematical Statistics and Probability,
1967.
[24] M. Norman, J. Shalf, S. Levy, and G. Daues. Diving deep: Data management and visualization strategies for adaptive mesh refinement simulations. Computing in Science and
En-gineering, 1(4):36–47, 1999.
[25] P. Ranganathan, K. Gharachorloo, S. Adve, and L. Barroso. Performance of database workloads on shared-memory sys-tems with out-of-order processors. In Proceedings of the
8th International Conference on Architectural Support for Programming Languages and Operating Systems (ASPLOS-VIII), pages 307–318, Oct. 1998.
[26] Sean Eddy’s Lab. Rsearch software repository. Available at http://www.genetics.wustl.edu/eddy, 2005.
[27] P. Spellman, G. Sherlock, M. Zhang, V. Iyer, K. Anders, M. Eisen, P. Brown, D. Botstein, and B. Futcher. Com-prehensive identification of cell cycle-regulated genes of the yeast saccharomyces cerevisiae by microarray hybridiza-tion. Molecular Biology of the Cell, 9(12):3273–3297, 1998. [28] Standard Performance Evaluation Corporation. SPEC CPU2000 V1.2, CPU Benchmarks. Available at http://www.spec.org, 2001.
[29] The Center for Ultra-scale Computing and Information Se-curity (CUCIS) at Northwestern University. NU-Minebench version 2.0. Available at http://cucis.ece.northwestern.edu, 2006.
[30] P. Trancoso, J. Larriba-Pey, Z. Zhang, and J. Torrelas. The memory performance of DSS commercial workloads in shared-memory multiprocessors. In Proceedings of the 3rd
International Symposium on High-Performance Computer Architecture (HPCA), pages 250–261, Feb. 1997.
[31] Transaction Processing Performance Council. TPC-H Benchmark Revision 2.0.0, 2004.
[32] S. Woo, M. Ohara, E. Torrie, J. Singh, and A. Gupta. The SPLASH-2 programs: Characterization and methodological considerations. In Proceedings of the 22nd International
Symposium on Computer Architecture (ISCA), pages 24–36,