Modelling and Optimisation of Solar Voltaic
System using Fuzzy Logic
Name: Amit Aryal
A thesis presented for the degree of
Master of Engineering by Research
School of Computing, Engineering and Mathematics
Supervisor: Dr Ali Hellany
Co Supervisor: Dr Jamal Rizk, Prof Mahmood Nagrial
Statement of Authentication
The work presented in this thesis is, to thebest of my knowledge and belief, original except as acknowledged in the text. I hereby declare that I have not submitted this material,
either in full or in part, for a degree at this or any other institution.
Abstract
There is considerable increase in residential solar grid connected installations with many advantages offered by solar energy. As more solar panels are connected to grid, the Solar Inverter between solar panels and grid have to perform at optimum levels. Modern Inverters consist of DC-DC Converter and DC-AC Inverter. One problem associated with Inverter design is voltage fluctuation, this defect lies in the DC-DC converter Maximum power tracking (MPPT) algorithms responsible for extracting maximum power from the solar panels. The defect is due to large sampling number required for conventional MPPT algorithm. This thesis has proposed a new MPPT algorithm based on Mamdani Fuzzy logic. In research we use 5 parameter one diode model for solar cell modelling. The P-V/I-V characteristics curve is generated. The P-V characteristics curves sectioned and input membership and output membership functions is created. And unique fuzzy rules is used to optimize fuzzy controller output. Mamdani Fuzzy logic algorithm is compared to traditional PI controller hill climbing method. When small sampling number is used hill climbing method response is slow and good at tracking. When big sampling number is used hill climbing method response is fast and not good at tracking. The voltage also fluctuates when sampling number is big. Fuzzy logic provides a compromised solution with best response time and moderate tracking accuracy compared to hill climbing method. Fuzzy Logic based DC-DC converter together with PLL and Recursive Discrete Fourier Transform (RDFT) DC-AC inverter synchronization algorithm is employed and simulated in matlab. The MPPT simulation is conducted for a realistic 2.5KW solar panels in a 8 x 2 Matrix. In addition the MPPT algorithm is analyzed to see if it performs under power quality and voltage level tolerance of utility grid requirements. The Fuzzy Logic MPPT is excellent at tracking
power. When temperature is fixed and irradiance is varied, the maximum tracking error is 5.2% in all scenarios with one exception. When irradiance is fixed and temperature varied, the maximum tracking error is 1.98%. Furthermore the Fuzzy Logic MPPT meets the power quality and voltage level tolerance requirements of utility grid for irradiance over 600 W/m2. Power quality and voltage level tolerance requirements for irradiance under 600 W/m2 is not critical as this is outside twilight conditions. Out of all the Synchronization algorithm identified in this Thesis, RDFT achieves synchronization very quickly and in addition it suppresses harmonics and noise. The possibility of future study to extend MPPT is also briefly discussed. The extension of future study is using Takagi-Sugeno fuzzy logic. Takagi-Sugeno uses more sophisticated inference and rule evaluation mathematics.
Dedication
Declaration
I, Amit Aryal declare that this thesis titled, ‘Grid connected Solar Inverter Algorithm’ and the work presented in it are my own. I confirm that:
This work was done wholly or mainly while in candidature for a research degree at this University.
Where any part of this thesis has previously been submitted for a degree or any other qualification at this University or any other institution, this has been clearly stated.
Where I have consulted the published work of others, this is always clearly attributed.
Where I have quoted from the work of others, the source is always given. With the exception of such quotations, this thesis is entirely my own work.
I have acknowledged all main sources of help.
Where the thesis is based on work done by myself jointly with others, I have made clear exactly what was done by others and what I have contributed myself.
Acknowledgment
I acknowledge my Principal Supervisor: Dr Ali Hellany and Co Supervisors: Dr Jamal Rizk and Prof Mahmood Nagrial for their foresight and guidance.
Table of Contents
Chapter 1 ... 15
1.1 Background ... 15
1.2 Research Motivation and Research Gaps ... 16
1.3 Significance of the proposed Research ... 17
1.4 Aim and Scope of the Research ... 18
1.5 Methodology and Approach ... 19
1.6 Output of the thesis ... 20
1.7 Structure of the thesis ... 20
1.8 Conclusion of Chapter ... 21
Chapter 2: Literature Review ... 22
2.1 Introduction to Solar Energy ... 22
2.2 PV Cell Technology ... 23
2.3 Single phase Inverters ... 34
2.4 Characteristics of Solar Cell and Modules ... 57
2.5 Sizing the Inverter ... 66
2.6 Installing and Commissioning ... 68
Chapter 3: Research Questions ... 70 3.1 Research Focus ... 70 3.2 Conclusion of Chapter ... 76 Chapter 4: Methodology ... 78 4.1 Overview ... 78 4.2 Simulation ... 80 4.3 Conclusion of Chapter ... 96
Chapter 5: Results and Discussion ... 97
5.1 PI controller based hill climbing method ... 97
5.2 DC-DC Fuzzy Logic converter ... 97
5.3 DC-AC Inverter Synchronization ... 109
5.4 Conclusion of chapter ... 111
Chapter 6: Conclusion... 113
6.1 Significance of Study and Conclusion ... 113
6.2 Future Work ... 115
References ... 117
Appendix 1 Matlab code for Direct form I IIR filter based on phase substraction ... 125
Appendix 2 Matlab code for Fuzzy Logic MPPT Converter ... 127
List of Figures
FIGURE 1 PRIMAL MODEL FOR RESEARCH QUESTION ... 17
FIGURE 2 A TYPICAL STRUCTURE OF CRYSTALLINE SILICON CELL (ZENMAN) ... 25
FIGURE 3 A TYPICAL STRUCTURE OF AMORPHOUS\MICRO-CRYSTALLINE SILICON CELL (PIN JUNCTION) (ZENMAN)27 FIGURE 4 A TYPICAL STRUCTURE A HETERO-JUNCTION CDS-CDTE CELL (DUROSE, EDWARDS & HALLIDAY 1999) .... 28
FIGURE 5 A TYPICAL STRUCTURE OF A HETERO-JUNCTION CIGS CELL ... 29
FIGURE 6 A TYPICAL STRUCTURE OF A “MECHANICALLY STACKED” AMORPHOUS SILICON (A:SI) TANDEM CELL ... 31
FIGURE 7 A TYPICAL STRUCTURE OF AN INORGANIC DYE-SENSITIZED SOLAR CELL (DSSC) ... 34
FIGURE 8 DIAGRAM OF TYPICAL GRID CONNECTED PV SYSTEM WITH ALL COMPONENTS (ALTERNATIVE-ENERGY-TUTORIALS 2018) ... 35
FIGURE 9 DIAGRAM OF A SINGLE PHASE CUSTOMER EXPORTING GROSS/NET PV POWER TO UTILITY (DALITZ & CUTLER 2013) ... 36
FIGURE 10 MODEL OF POWER HARDWARE IN LOOP (PHIL) ... 38
FIGURE 11 PV ARRAY IN A 4 X 2 MATRIX CONNECTED TO INVERTER ... 39
FIGURE 12 PICTURE OF M4 CONNECTORS (LEFT) AND SOLARLOK PV4 CONNECTORS (RIGHT) ... 41
FIGURE 13 BLOCK DIAGRAM OF CONVENTIONAL PLL USED IN SYNCHRONIZATION ... 45
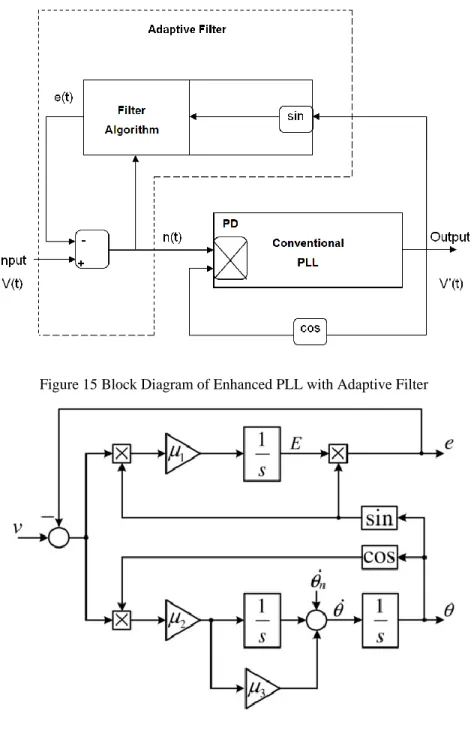
FIGURE 14 BLOCK DIAGRAM OF SRF-PLL WITH QUADRATURE SIGNAL GENERATOR AND PARK TRANSFORMATION 47 FIGURE 15 BLOCK DIAGRAM OF ENHANCED PLL WITH ADAPTIVE FILTER ... 49
FIGURE 16 CONTROL LOOP OF ENHANCED PLL WITH ADAPTIVE FILTER (ZHONG 2012) ... 49
FIGURE 17 ALGORITHM FOR OPERATION OF LINEAR KALMAN FILTER (ADAPTED FROM (WELCH & BISHOP 2006) ) 50 FIGURE 18 CIRCUIT DIAGRAM OF A BUCK CONVERTER (COATES 2014C) ... 52
FIGURE 19 CIRCUIT DIAGRAM OF A BOOST CONVERTER (COATES 2014A) ... 53
FIGURE 20 CIRCUIT DIAGRAM OF A BUCK-BOOST CONVERTER (COATES 2014B) ... 54
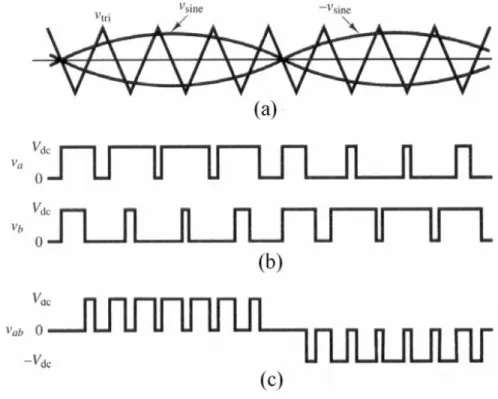
FIGURE 22 BIPOLAR SINUSOIDAL PULSE-WIDTH MODULATION (AZUAN 2007) ... 56
FIGURE 23 ONE DIODE MODEL OF PV CELL (SALMI ET AL. 2012) ... 57
FIGURE 24 I-V AND P-V CHARACTERISTIC CURVES (GUIDE TO INTERPRETING I-V CURVE MEASUREMENTS OF PV ARRAYS 2010) ... 60
FIGURE 25 I-V CURVE FOR INCREASING SOLAR IRRADIANCE (BRUNTON ET AL. 2009) ... 61
FIGURE 26 EXAMPLE OF FUZZY LOGIC MEMBERSHIP FUNCTION (ESRAM & CHAPMAN 2007) ... 64
FIGURE 27 POWER CURVE FOR SOLAR ARRAY AND PANELS DURING PARTIAL SHADING (EARTHSCAN 2013) ... 65
FIGURE 28 THE TYPICAL I-V CURVES FOR RANGE OF TEMPERATURES (EARTHSCAN 2013) ... 67
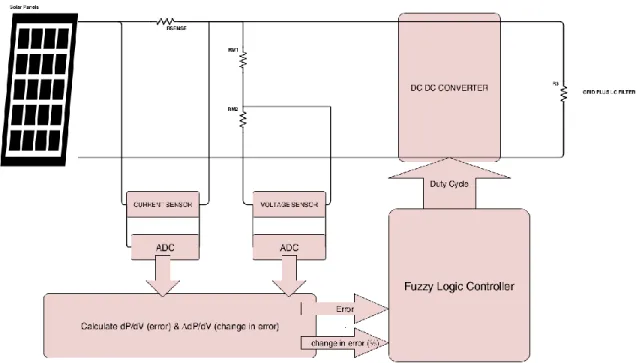
FIGURE 29 PARTIAL HARDWARE MODEL OF FUZZY LOGIC BASE CONTROLLER ... 72
FIGURE 30 DIAGRAM OF A CONVENTIONAL BUCK-BOOST CONVERTER ... 79
FIGURE 31 DIAGRAM OF AN EQUIVALENT RESISTANCE CIRCUIT SEEN BY THE SOLAR PANELS ... 82
FIGURE 32 DIAGRAM OF PI CONTROLLER-CONTROLLED SYSTEM DIAGRAM (ADAPTED FROM (DUONG ET AL. 2017)) ... 83
FIGURE 33 GENERAL DIAGRAM OF A MAMDANI FUZZY CONTROLLER ... 85
FIGURE 34 TYPICAL P-V CURVE WITH SECTIONS ... 86
FIGURE 35 FUZZY INPUT MEMBERSHIP FUNCTION ERROR (DP/DV) ... 87
FIGURE 36 FUZZY INPUT MEMBERSHIP FUNCTION: CHANGE IN ERROR (∆DP/DV) ... 87
FIGURE 37 DUTY CYCLE MEMBERSHIP FUNCTION ... 89
FIGURE 38 CENTRE OF GRAVITY OF OUTPUT FUZZY SET A OVER INTERVAL [A,B] ... 91
FIGURE 39 CONTROL DIAGRAM OF PHASE LOCKED LOOP BASED ON COMPLEX MATHEMATICS ... 92
FIGURE 40 DIRECT FORM II IIR DIGITAL FILTER ... 93
FIGURE 41 DIRECT FORM I IIR DIGITAL FILTER ... 93
FIGURE 42 CONTROL DIAGRAM OF PHASE LOCKED LOOP BASED ON PHASE SUBTRACTION ... 94
FIGURE 43 CONTROL DIAGRAM OF RECURSIVE DISCRETE FOURIER TRANSFORM FILTER ... 95
FIGURE 44 UNIT STEP RESPONSE OF PI CONTROLLER BASED METHOD ... 97
FIGURE 46 POWER TRANSFER CURVE FOR PI CONTROLLER HILL CLIMBING MPPT WITH SMALL SAMPLING
SEQUENCE (BLUE CURVE SUPERIMPOSED INTO RED CURVE) ... 99
FIGURE 47 POWER TRANSFER CURVE FOR PI CONTROLLER HILL CLIMBING MPPT WITH LARGER SAMPLING SEQUENCE (BLUE CURVE IS ACTUAL POWER,; RED CURVE IS THEORETICAL POWER)... 100
FIGURE 48 POWER TRANSFER CURVE FOR FUZZY LOGIC MPPT FOR ARBITRARY POINT ... 101
FIGURE 49 AMPLITUDE VS NO OF CYCLES FOR A DIRECT FORM II IIR FILTER PHASE LOCKED LOOP ... 109
FIGURE 50 AMPLITUDE VS NO OF CYCLES FOR A DIRECT FORM I IIR FILTER PHASE LOCKED LOOP ... 110
FIGURE 51 AMPLITUDE VS NO OF CYCLES FOR A DIRECT FORM I IIR FILTER BASED ON PHASE SUBTRACTION ... 110
FIGURE 52 AMPLITUDE VS NO OF CYCLES FOR RDFT FILTER ... 111
List of Abbreviations
AC Alternating Current
BOS Balance of System
CG Centralized Generation
DC Direct Current
DFT Discrete Fourier transform
DG Distributed Generation
DSP Digital Signal Processor
DSSC Dye-Sensitised Solar Cell
EIA Energy Information Administration
EGS Electronic Grade Silicon
FIR Finite Impulse Response
IIR Infinite Impulse Response
MOSFET Metal–Oxide–Semiconductor-Field-Effect Transistor
PECVD Plasma-Enhanced Chemical Vapor Deposition
PLL Phase Locked Loop
PV Photovoltaic
PWM Pulse-Width Modulation
P&O Perturb and Observe
RDFT Recursive Discrete Fourier transform SOGI Second-Order Generalized Integrator
SPWM Sinusoidal PWM
Chapter 1
1.1 Background
Literature Review shows that PV cells generate DC voltage. However, this is only somewhat DC due to fluctuating environmental conditions that affect the solar cells. The environmental conditions that affect I-V characteristics are solar irradiance (W/m2) and ambient temperature (°C) as discussed earlier. Partial shading is also a factor that affects the output of the solar cell. The simulation on partial shading suggests an overall reduction in power output (Ramabadran & Mathur 2009). For large array scale PV system, the research also shows partial shading affects I-V characteristic curve causing multiple maximum power point peaks (Patel & Agarwal 2008).
The four methods used to deploy MPPT (P&O, Hill Climbing, incremental conductance and fuzzy logic) were discussed in the literature review. All four methods assume the use of only single maximum power point peak in the P-V characteristics curve. Therefore none of these methods investigated are compatible with partial shading effects because partial shading produces multiple maximum power point peaks. Because of this reason, combined with rarity of partial shading effects on site, the proposed research shall only consider ambient temperature and solar irradiance as the significant environmental parameters affecting the solar cell power output.
The literature review points that P&O, Hill Climbing, incremental conductance method all suffer from oscillations around maximum power point for larger sampling time and slow response for smaller sampling time. In contrast, fuzzy logic based controller offer faster response, less fluctuation in rapidly changing environmental conditions and high accuracy (Kargarnejad, Taherbaneh & Kashefi 2013). Thus, fuzzy logic will be used as the optimal candidate for extracting maximum power for this research.
1.2 Research Motivation and Research Gaps
The literature review shows that popular maximum power point tracking is performed using Hill climbing methods. However the major defect of Hill climbing algorithm is voltage fluctuation. By using fuzzy logic instead of Hill climbing method, the voltage fluctuation can be eliminated. This is the motivation behind using Fuzzy Logic as MPTT in my proposed research. Furthermore there is a knowledge gap in the literature where fuzzy Logic based MPPT has not been tested for a realistic 2.5KW residential solar grid connected inverter. In this context, the research question is formulated as “How can we model the effect of ambient temperature, solar irradiance and inverter equipment on requirements of a residential solar inverter connected power grid using fuzzy logic MPPT.” The primal model for research question is shown in Figure 1.
Four papers in literature (Kargarnejad, Taherbaneh & Kashefi 2013; Salmi et al. 2012; Sera, Teodorescu & Rodriguez 2007; Sinha, Mekala & Samantaray 2010) shows I-V characteristics of solar cell obtained from one diode model based methods. Two cited papers (Kargarnejad, Taherbaneh & Kashefi 2013; Sinha, Mekala & Samantaray 2010) use one diode model to study I-V characteristics but also extend their scope to study maximum power point tracking. Maximum power point tracking (MPPT) is an algorithm that extracts maximum power from the solar cells in its electric power delivery to the load (or customer). Like the cited papers, my proposed research will study I-V characteristics of solar cell using one diode model, extend their scope to study maximum power point tracking using fuzzy logic.
The second stage of inverter is the synchronization stage. Traditionally, finite impulse response (FIR) digital filter is utilized. By varying the weight and filter taps any frequency response is realized to model an phase locked loop. Compared to archaic analogue filters, FIR digital filter has far better if not close to perfect linear phase response (Patil & Tandel 2016). However, FIR require higher order or high number of coefficients. While traditionally FIR is used, in the current scenario IIR digital filter is popular as outlined in this paper (Patil & Tandel 2016). IIR filter based phase locked loop is implemented in this paper (Gaeddert 2013). More specifically, digital filter is based on 2nd order direct II form IIR filter using complex mathematics for phase locked loop modelling. There are no other literature in this area.
Evaluating gaps in literature suggest using trigonometry instead of complex mathematics. Furthermore, Direct I IIR filter is used instead of direct II IIR filter. The advantage of using trigonometry is simpler software programs. The possible advantage of using direct form I IIR filter is output of PLL tracks grid voltage in less cycles.
Figure 1 Primal model for research question
1.3 Significance of the proposed Research
As mentioned in previous sections, the major and common defects of P&O, Hill Climbing and incremental conductance MPPT approach is oscillations in the output. In contrast, using fuzzy logic based MPPT can overcome this defect and develop following refined questions relating to the general research question posed previously:
Whether DC link voltages generated by fuzzy logic based MPPT converter will be usable on the next stage (DC-AC Inverter) without compromising grid voltage tolerance requirements.
Whether DC fuzzy logic based MPPT converter will work in wide range of temperature at fixed irradiance.
Whether DC fuzzy logic based MPPT converter will work in wide range of irradiance at fixed temperature.
1.4 Aim and Scope of the Research
Aims of this research are: To model Solar panels source using 5 parameter one diode model solar cell. This is a method of modelling solar cell by means of representing an equivalent solar cell electrical circuit diagram by 5 variables. The solar cell model is combined to form an solar panel model.
To model DC-DC converter using fuzzy logic MPPT to see that fuzzy logic algorithm is compatible with utility grid voltage and frequency requirements.
To generate MPPT curves that shows accurate power tracking using fuzzy algorithm to improve the efficiency of Solar inverter.
To model various synchronism to grid filter algorithms to see the presence of ripples, noise and how long it takes to synchronize output to grid.
In addition, this thesis extends the study to DC-AC Inverter model for completeness. The DC-AC Inverter topologies are not re-designed instead grid connected model is addressed by scrutinizing digital filters used for synchronization of DC-AC converter. Zero crossing design strategy, presented in literature review, is not beneficial for further investigation as it has issues with sensitivity and harmonics. There is a technique of zero crossing detector which addresses the above issues using complicated hardware (Amanci 2010), However, this is too advanced to apply it in a simulation study of this scope. Another option is Kalman filtering strategy, but this too uses complicated Kalman mathematics concepts and goes beyond the scope of this thesis. In
addition, Kalman filtering, presented in literature, is known to achieve synchronism within 6 cycles, which is very difficult to improve using similar Kalman mathematics. Thus the two types of filter, examined in this thesis, are phase locked loop (PLL) and Fourier Transform filter. PLL is used for its popularity and Fourier Transform filter is examined as an alternative with potential benefits in areas such as harmonics and noise suppression and fast synchronization times. Thus the additional questions posed is:
What are the benefits of synchronizing algorithm used (PLL and Fourier Transform) and their synchronizing times in the subsequent DC-AC stage.
1.5 Methodology and Approach
A 5 parameter, one diode model solar cell is utilized for this research. A specific solar panel is selected and I-V characteristic curves is obtained in matlab. P-V curve is obtained by multiplying current and voltage (product of current and voltage is power) and R-V characteristic curve is obtained by dividing voltage by current (dividing voltage by current gives resistance).
The duty cycle of MPPT is found by analysing the impedance matching model and implementing a fuzzy logic based DC-DC converter algorithm. When input resistance is equal to load resistance then maximum power transfer occurs from source to load. The more power transfer occurs more efficient the DC-DC converter is. Mamdani fuzzy logic mathematics is employed with 2 inputs and 1 output. The output is obviously the duty cycle while the inputs are Error and Change in Error. The crisp output is the duty cycle feeding the DC-DC converter MOSFET. From the literature, the H-bridge DC-AC inverter achieves synchronization by employing DSP to switch the gate of four H-bridge MOSFETS. The switching signal is produced by employing a digital filtering based synchronization using conventional phase locked loop and Fourier series. In addition the phase locked loop filter is analyzed for filter phase detector based on both complex mathematics and phase subtraction. The Fourier series filter is based on RDFT algorithm is also employed which works fast but produces ripples. The ripples are filtered out using moving average filter.
1.6 Output of the thesis
The output of the thesis is to analyse the performance of fuzzy logic algorithm based DC-DC converter. The first purpose is to see performance of fuzzy logic algorithm is tested to see its suitability with utility grid power quality and voltage tolerance requirements. The second purpose is to see performance of fuzzy logic algorithm is tested to if its good at tracking input power from solar panels. Because the MPPT tracking error is very good within specified design range, with tracking error less than 2%. The tracking is also considerably better for tracking error less than 30 deg C. The thesis will also output a tracking error graph with 9 arbitrary points, comprising of solar irradiance (W/m2) and temperature (°C), which show that the fuzzy logic controller is capable of tracking power at high accuracy. The third purpose of this thesis is to see if output voltage to grid voltage synchronization takes form as Direct 1/Direct II IIR and RDFT filter. The analysis shows that out of all filters RDFT achieves synchronization very quickly.
1.7 Structure of the thesis
The structure of thesis is 6 chapters. This is the first chapter. The second chapter is the Literature review. This chapter explores literature in depth including Introduction of Solar Energy, PV cell technology, Single phase inverter, Characteristics of solar cell, Sizing the inverters, and Installing and commissioning. The third chapter is Research questions. Chapter 3 (Research Questions) states: The research problem, The research aims and The hypotheses. Chapter 3 discusses design analysis of proposed research on DC-DC power converters for solar PV system. Along with this the design of Solar PV system, design of Traditional PI based controller and design of proposed fuzzy logic based controller. The shortcomings of existing MPPT algorithms under partial shedding conditions is analysed in chapter 3. Chapter 4 (Methodology) explains how the research was done and why it was done this way. Chapter 4 models the proposed simulation model for PI controller hill climbing method MPPT and fuzzy logic MPPT. Explanation of why the fuzzy logic is adopted, how the membership functions are set is presented. Explanation of why buck boost DC-DC converter is used, in PV system is covered. Chapter 4 also presents model for phase locked loop and RDFT filter based synchronization
techniques. Chapter 5 (results and discussion) specifies results and how it was prepared for analysis. Furthermore in chapter 5 it explains each particular result by describing the behaviour of each graph and table to show how the data addresses the research question. Chapter 6 addresses by presenting statements about main findings, related to research questions and statements about the significance of what is discovered. Chapter 6 ends by presenting Takagi-sugeno fuzzy logic MPPT for future work
1.8 Conclusion of Chapter
Background of this chapter highlights key literature review including PV cell generating technology and single phase inverter technology and design methods and limitations. Research in this thesis looks at research motivation behind using DC-DC fuzzy logic MPPT. This is the central focus of this thesis. In addition to central research another area of the research looks at DC-AC synchronization algorithms. The significance of this research is that the fuzzy logic algorithm overcomes the defect of traditional PI controller based algorithms. The thesis points to fuzzy logic MPPT producing excellent power tracking and proving suitability under utility grid voltage and frequency tolerance.
Chapter 2: Literature Review
2.1 Introduction to Solar Energy
Growth for the worldwide demand in energy is well-established. This combined with the present scarcity risks and volatile prices of conventional fossil fuel pose an opportunity for alternative energy sources. Solar energy has potential to siege this opportunity as it exhibits fast growth around the world. Even among other renewable energy sources it is the most secure and sustainable (Philibert 2011). US Energy Information Administration (EIA) reports (International Energy Statistics 2014) World Annual Solar Electricity Net generation in 2012 at 58 Billion Kilowatt-hours compared to less 1 Billion Kilowatt-hours for any year before year 2000. EIA also reports a significant rise in annual generation of solar electricity in Australia in 2012 compared to its pre-millennial figures.
Photovoltaic (PV) technology is the most promising solar energy technology to date; one of the reasons is because of its versatility in delivering electricity to consumers. It is configured as on-grid, off-grid (stand-alone) or hybrid systems (Tiwari 2010). In addition, PV generation can be Centralized Generation (CG) or Distributed Generation (DG). CG has a larger capacity, connected to the grid, usually, constructed away from the load centers and closer to where solar energy is most available. However, there is high capital cost associated with CG particularly to build infrastructure and erect transmission lines. In contrast, DG has a smaller capacity, can be on-grid or off-grid, is closer to load centers and can be installed on existing infrastructure (Environment 2010). Despite the high capital cost linked even with CG, sunlight is free and unlimited which makes PV an ideal alternative source of energy.
The first silicon PV cell battery capable of powering a radio transmitter was developed by the Bell Labs scientist in 1954 (Perlin 2003). Since then, the research & development and commercialization of PV technology has led to a proliferation in its use. In the energy sector, both residential and utility-scale PV generators have been constructed. Currently, one of the largest PV projects in the world is the construction of Topaz Solar Farm in California. When
completed his utility-scale power plant will supply the grid with a power capacity of 550MW (Topaz Solar Farms 2014). Similar large-scale utility projects (exceeding 100MW) are being constructed in other countries and other parts of United States (List of photovoltaic power station 2014). Nevertheless, the residential scale solar system is much smaller and more common than utility scale solar. The study (Latheef 2006) states that most residential PV systems are between 1-5KW. Other case studies presented in literature (Stapleton 2012) show that residential solar does not exceed more than 10KW. As indicated by these literatures ('Aldi Group Case Study' ; 'Henderson Group Case Study'), there are many projects with more than 10KW PV system. However, these types of installations are commercial developments and not residential ones
Solar energy along with wind and biomass are the alternative energy sources to conventional fossil fuel. Solar energy is still more reliable than wind and more sustainable than biomass (Philibert 2011). Another area of focus with renewable energy is association with low global warming emissions. There are no direct global warming emissions associated with generating electricity from solar energy. Nevertheless, there are emissions associated with other stages of the solar life-cycle. The other stages are manufacturing, materials transportation, installation, maintenance, and decommissioning and dismantlement (Environmental Impacts of Solar Power 2013). Impact of overall solar energy global emissions and other environmental impacts (mainly due to utility scale solar) is identified by (Environmental Impacts of Solar Power 2013) which is beyond the scope of this study. Renewable solar can be broken down further to three areas: PV, CSP (concentrated solar power) and Solar Heating. Even among these, PV energy exhibits the highest annual growth rate in terms of capacity (Renewable Global Status Report 2014). The following section covers device physics and manufacturing methods of different PV technology.
2.2 PV Cell Technology
Mono Crystalline and Poly-Crystalline PV Technology
Mono-crystalline and Poly-crystalline are the most commercially used PV cell technologies in the market. When monocrystalline/polycrystalline PV cells are exposed to tiny packets of light
energy called photons, electrons are dislodged which causes current to flow in the one way membrane called a PN-junction. (Blakers 2013).
Extrinsic conductors consists of doped intrinsic conductor. Intrinsic semi-conductor material can be an element or an alloy. Few examples are Silicon, Germanium and Gallium Arsenide. They exhibit high resistivity due to a limited number of charge carriers (free electrons and holes) present in their structure. Another property of intrinsic semi-conductor is that it has equal numbers of free electrons and holes.
An n-type or p-type extrinsic semi-conductor is formed by choosing a correct dopant for a given intrinsic semiconductor. In n-type extrinsic semi-conductors, even a small amount of energy will see electrons donated to the conduction band of the semiconductor. Hence, electrons are the majority charge carriers in the n-type semiconductor. In p-type semi-conductors, a small amount of energy will reject electrons from the valence band leaving free holes. Hence, holes are the majority charge carriers in the p-type semiconductor (Tiwari 2010).
PV cell consists of p-type and n-type semi-conductors formed in the junction. The electrons in a PV cell flow in one direction from p-type to n-type (Hence conventional current flows in the opposite direction). Base crystal can be grown using either p-type or n-type doping. Usually, the emitter of most commercial crystalline silicon-based PV cell is n-type. While the base (or substrate) is a p-type silicon because p-type has better metallurgical crystalline properties (The Buried Emitter Solar Cell 2014). Thus, on most commercial crystalline PV cells, the sunlight (photons) passes from the n-type layer (see Figure 2). Furthermore, the emitter layer is thinner than the diffusion length (L) of minority carriers. So that the minority carriers (holes) do not recombine with majority carriers (electrons) before the electrons cross the PN-junction. Electronic grade silicon (EGS) is the primary ingredient in manufacturing both mono-crystalline and poly-crystalline base crystals. EGS is highly pure silicon with a multi-crystalline structure made from melting sand (SiO2) with other materials in the furnace (Sze 2012).
Poly-crystalline silicon crystals are created by molten EGS (Electronic Grade Silicon) in a block cast and allowing it to cool to form multiple crystals in random orientations. Because of this relatively simple method, Poly-crystalline PV cells are popular and inexpensive (Stapleton
2012). On the other hand, monocrystalline cells are created using more complicated methods. The Czochralski technique is one such method. This technique requires pulling a single seed crystal template dipped in molten EGS from a rotating crucible heated by a furnace (Sze 2012). Because of the complicated manufacturing process, mono-crystalline cell is more expensive than poly-crystalline. However, mono-crystalline cell offers better efficiency compared to all other technologies (Stapleton 2012).
Figure 2 A typical structure of crystalline silicon cell (Zenman)
When crystalline silicon solidifies into an ingot, it is sawn into wafers. With much energy is used, and material wasted, the sawing process is not an efficient one; (Labouret 2010). Ribbon silicon is a close variant of polycrystalline technology where the silicon is less wasted. A ribbon is formed by melting a polycrystalline silicon. Current commercial panel efficiencies of Ribbon Silicon made by Evergreen solar Inc. is between 13-14%, while their laboratory research has recorded cell efficiency of up to 17.8% (Kim et al. 2003).
Classic crystalline silicon offer better efficiencies than ribbon silicon. The top of the range mono-crystalline residential solar module offers panels efficiency of 21.5% (SunPower X-Series Solar Panels 2013). Datasheet of efficient Poly-crystalline modules shows typical panel efficiencies between 14.3% to 16.3% (HSL 72 2012; Kyocera KD325GH-4FB 2013 2013).
Thin film Photovoltaic technologies
There is also much research and interest on other types of technology; while mono-crystalline and polycrystalline silicon PV cell still drives the majority of the commercial market.
Amorphous Silicon is non-crystalline thin film technology which has matured in recent times. Amorphous Silicon exhibits a random crystalline structure with dangling chemical bonds occupied by Hydrogen. The chemical used is silane and hydrogen (SiH4/H2) to introduce hydrogen into its structure (Veneri 2011). An offshoot of Amorphous Silicon technology is the Micro-crystalline technology. Micro-crystalline technology is formed by using a higher ratio of hydrogen (H2) to Silane (SiH4) (McEvoy, Castaner & Markvart 2013).
Both micro-crystalline and amorphous silicon cannot be adapted to a PN-junction structure as with the classic crystalline silicon cell because the diffusion length (L) of minority carriers in this type of materials is very small (Veneri 2011). This problem can be countered by introducing an intrinsic (undoped) layer between p and n layer to form a new PIN-junction (Zenman). A Hetero-junction cell is formed by arranging two different materials in a PN-junction. Hetero-Junction thin film technology has emerged as a viable alternative to amorphous silicon with materials like CdS-CdTe, CdS-CuInSe2(CIS) and CdS-CuInGaSe2 (CIGS) (Reddy 2010). Figure 2.2 shows CIGS cell.
Both micro-crystalline and amorphous silicon cannot be adapted to a PN-junction structure as with the classic crystalline silicon cell because the diffusion length (L) of minority carriers in this type of materials is very small. What happens is that minority carriers in extrinsic (doped) semiconductor (in n-type and p-type) will easily recombine with majority carriers, before reaching the depletion zone, producing zero net current (Veneri 2011).
This problem can be countered by introducing an intrinsic (undoped) layer between p and n layer to form a new PIN-junction. If the i-layer is chosen to be thick compared to the p and n layer, a built-in electric field can extend over the whole i-layer and encourage the separation of charges generating electricity (Zenman). Figure 3 shows a typical structure of an amorphous pin junction. According to (Green et al. 2012) typical efficiency for Amorphous Silicon and
Micro-crystalline cell is 10.1% (Note: These figures are cell and sub-module efficiencies and not module/panel efficiencies).
In figure 2 SnO2 is a TCO (Transparent Conductive Oxide) layer which acts as a medium
for light to pass through and as a conductor for generated current from the cell. While ZnO layer acts as an ohmic contact between metal (Al or Ag) and the n-type semiconductor.
A Hetero-junction cell is formed by arranging two different materials in a PN-junction. Hetero-Junction thin film technology has emerged as a viable alternative to amorphous silicon with materials like CdS-CdTe, CdS-CuInSe2(CIS) and CdS-CuInGaSe2 (CIGS) (Reddy 2010). CdTe (Cadmium Telluride) is doped as either p-type or n-type and has ideal band gap energy for solar energy conversion. However for practical fabrication reasons a CdS-CdTe based junction is formed by pairing p-type CdTe with n-type CdS (Cadmium Sulfide) (Durose, Edwards & Halliday 1999). Figure 4 shows a typical structure of CdS-CdTe cell:
Figure 3 A typical structure of Amorphous\micro-crystalline silicon cell (PIN junction) (Zenman)
Light
Figure 4 A typical structure a hetero-junction CdS-CdTe cell (Durose, Edwards & Halliday 1999)
The CdS-CdTe solar cell is produced by depositing a thin n-type CdS layer on a conductive glass substrate (this is called “superstrate configuration”). After depositing a thin n-type CdS layer, a p-n-type layer is deposited, followed by deposition of a back contact made of metal (Uddin 2013). The glass is coated with TCO (Transparent Conductive Oxide) as a medium for light to pass through and as a conductor for generated current from the cell. The cell is then treated for a short time at 450 deg C with a compound that causes partial crystallization (Uddin 2013).
In 2014 CdS-CdTe technology manufactured by First Solar set a world record 17% efficiency for cadmium-telluride (CdTe) PV module (First Solar Sets Thin-Film Module Efficiency World Record of 17.0 Percent 2014). CdS-CuInSe2 (CIS) and CdS-CuInGaSe2 (CIGS) are the other two viable hetero-junction thin film solar cells. CIS absorbs almost all the photons from the sunlight. However, Indium used in CIS is a very rare element. By replacing a portion of Indium with Gallium (about 10 to 20%) CIGS is produced (Haberlin 2012). Taiwan
Semiconductor Manufacturing Company (TCMC), one of the world’s leading companies in semiconductor technologies has produced a high-efficiency CIGS panels with panel efficiency up to 14.7% (TS CIGS SERIES 2014). This efficiency is comparable with poly-crystalline silicon technology. Although, CIGS technology does not still come close to mono-crystalline silicon in terms of efficiency, CIGS has additional benefits in terms of lower cost and potential advantage of fabricating cells in a flexible substrate. Flexible substrate finds application in many areas other than grid-connected rooftop PV including consumer electronics, building and aerospace (Efstathiadis 2013). Figure 5 shows a typical structure of CIGS cell. Compared to CdTe, CIGS is grown in “substrate configuration”. Substrate configuration requires an additional glass layer to protect the cell. Nonetheless, there is practical benefit in fabricating cell this way, namely improving the CIGS cell efficiency. This structure is also significant in improving the efficiency in multi-junction cells by incorporating the full solar spectrum (Romeo et al. 2004).
Multi Junction Photovoltaic technologies
Multi-junction cells are created by stacking single PN/PIN junction on top of each other. By using different PN/PIN junctions, with different band gap energy EG in multi-junction
configuration, a wider spectrum of solar radiation can be utilized to create more efficient cells (Rosenwaks 2012). Because two or more PIN junction is in series, the same current will flow on all junctions (Uddin 2013). However, with more junctions added the voltage gets multiplied. Current mismatch in the junction is avoided by selecting material with similar properties. If current mismatch is unavoidable, current of the solar device will be limited to the junction with lowest current. Materials from III to V group semiconductors is best suited for multi-junction cells.
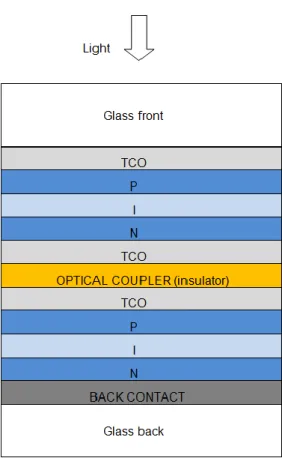
Tandem cells are double junction multi-junction cells. Tandem cells are “mechanically” stacked on top of one another. The upper cells absorb the portion of the solar spectrum that it can efficiently convert. The rest of the spectrum filters to the bottom cell. By utilizing the full solar spectrum, the cell can convert sunlight into electricity with greater efficiency (Reddy 2010). Electrically insulating the top junction from the bottom junction avoids the problem of the current mismatch discussed before. Optical coupler is used as an insulation (which allows sunlight to pass but not the generated electricity). Because of the optical coupler, the tandem cell uses two terminals or four terminals. Two terminal forms one equivalent cell connected in series and four terminal forms two individual cells (Haberlin 2012). A triple cell can also be realized by stacking three cells in the same generic structure as the tandem cells. For example, Uni-Solar uses amorphous silicon alloy (a:Si) with varying additives to create its triple cells. The current module efficiency for this type of solar cell is 10.4% (Green et al. 2012). Figure 6 below shows generic structure for a tandem cell based on amorphous silicon:
Another type of a multi-junction cell is the “monolithically stacked” cell grown in a substrate with multiple cells separated by a tunnel junction. When PV cells are monolithically in series then part of the top cell interacts with p part of the bottom cell to create an NP-junction opposed to the PN-junction required by the structure. In a monolithic structure the tunnel junction is introduced to correct this problem (Deng, Hegedus & Schiff 2011). Heavily doped n++ and p++ semiconductors forms a tunnel junction which prevents a PN-junction forming
between the cells and allow low ohmic path for the generated current to flow. In addition to tunnel junction, monolithically staked multi-junction cells also have following layers deposited at interface (between layers): Window layer and Back Surface Field layer.
These layers are deposited to passivate the surfaces states at the interface to reduce recombination of majority and minority carriers (Friedman, Kurtz & Olson 2011). Monolithically stacked structure does not require an optical coupler.
Research into monolithic multi-junction devices have consisted of elements from the III and V columns of the Periodic table, such as gallium indium phosphate (GaInP), gallium indium arsenide (GaInAs), and germanium (Ge). This architecture can also be transferred to other solar cell technologies such as CIGS, silicon, organic molecules, and other materials (Multijunction III-V Photovoltaics Research).
Efficiency of solar cells increase are number of junctions are increased and also increase by using a higher degree of sunlight concentrating optics. However, using concentrating optics is not straightforward, it requires tracking equipment and more land area, therefore, current use of concentrating optics is limited to utility/commercial scale installations. As a third-generation solar technology, multi-junction cell technology is still in its infancy. It has not penetrated the large terrestrial market (dominated by conventional crystalline silicon cells due to their relatively low cost) (Multijunction III-V Photovoltaics Research). Spectrolab is a company that manufactures solar modules for space applications. Spectrolab has reported a measured laboratory efficiency of 3-junction GaInP/GaInAs/Ge multi-junction cell at 41.6% at 484 sun concentration (AMD1.5 25 deg C) (King et al. 2012).
Other Photovoltaic technologies
Organic photovoltaic (OPV) is a third generation PV cell technology and have now reached laboratory cell efficiency of 10% (Green et al. 2012). The device physics of OPV is quite different to conventional inorganic semiconductor. Instead of p-type and n-type semiconductor junction, it uses organic materials as Acceptor and Donor layers in an interface. These organic layers can be chemically tailored to optimize the OPV cell design.
Under illumination of Donor layer, if incident photon energy absorbed matches the optical band gap energy Eg of the material, the electron is rejected from a higher energy level
orbital to lower energy level orbital of the molecule. As a result a hole is left behind on higher energy level orbital. In inorganic semiconductors, this allows electron to form a free carrier. However, this does not happen here; the hole and electron in the two orbitals stay as tightly bounded pair called an “Exciton”. If an Acceptor layer comes to a Donor layer in an interface, the difference in the affinity of electron and ionization energy between the two layers, (by Marcus theory) will separate the Exciton into an electron and a hole. In the presence of chemical potential created by anode and cathode of the solar cell terminals, the electron and hole will move in the opposite direction to generate electricity (O'Neil & Sun 2011).
There are two main classes of Organic Solar cell: Conjugated Polymer and Small molecule. They use different combination of organic materials as Donors and Acceptor layers in
different structures and these structures as being investigated in research laboratories like IMEC and Mitsubishi Chemicals. Organic solar cell is still its infancy, but it has potential to take a niche market with low manufacturing cost, abundant materials and use of flexible substrates (Organic Photovoltaics Research).
Dye-Sensitised Solar Cell (DSSC) is another emerging technology. It is showing rapid progress since its inception approximately two decades ago (Haberlin 2012). DSSC has reached cell efficiency of over 10% (Green et al. 2012). It can be fabricated as transparent modules with many colours especially suited to BIPV (Building Integrated Photovoltaics) (Stapleton 2012). Dye used in DSSC can be either organic or inorganic. When inorganic dye is used, it is, usually, ruthenium metal based dyes. Example of top performing ruthenium dyes are coded as N3 and N-719 (Grätzel 2005).
Inorganic dyes-sensitised cells work on a different device chemistry. Titanium dioxide (Ti02) is soaked in the dye to form a wide band gap material. When the sunlight illuminates the
dye, electrons get excited from the ground state to a higher state. Oxidation takes place with the excited electron in the dye molecule gets injected into the conduction band of the Ti02.The
electron in the Ti02 is pushed towards the first electrode (Anode) through the PV cell circuit to the opposite electrode (Cathode) where the electron recombines with electrolyte in a reduction reaction with an aid from the catalyst. The electrolyte used in DSSC is usually a liquid like iodide/tri-iodide redox couple (Grätzel 2005; Hara & Mori 2011). Figure 7 shows a typical structure of an Inorganic DSSC:
Figure 7 A typical structure of an Inorganic Dye-Sensitized Solar Cell (DSSC)
2.3 Single phase Inverters
Background
Photovoltaic modules do not produce AC voltage required by the grid. On the other hand, DC performance of solar cells is affected by changing environmental conditions like ambient temperature (deg C) and solar irradiance (W/m2) (Altas & Sharaf 2008). These conditions in turn are affected by other indirect conditions like time of day, clouds, shading and wind. Therefore, for dc load like batteries and inverters the PV module requires DC voltage regulator.
It can be seen from above that between power generation and power consumption a third system is required to regulate output voltage. This intermediate device is called BOS (Balance of System) (Balance of System). Therefore, BOS includes devices like wires, switches, power
conditioners like dc-dc converters and inverters, meters, chargers and batteries. This study will focus on Inverter in a distributed grid-connected system.
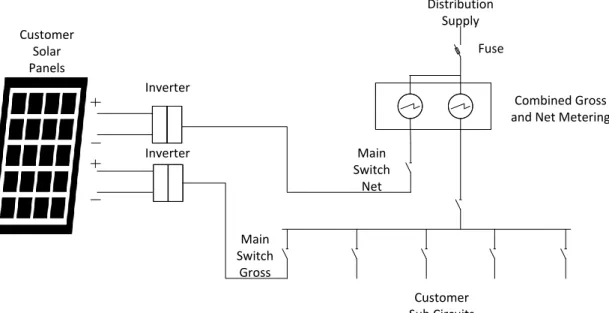
An inverter’s main purpose is to convert a DC into a regulated AC voltage required by the grid. It consists of DC-DC converter and a DC-AC inverter. In a distributed grid-connected system, there are two types of systems: Commercial and Residential as previously discussed in Introduction. Both these systems generate enough excess power that can be exported to the grid. Fig 8 shows Diagram of Typical Grid connected PV system with all components Figure 9 shows a diagram of a single phase customer exporting PV power to the utility grid.
Fuse
Combined Gross and Net Metering Customer Solar Panels Main Switch Net Main Switch Gross Distribution Supply Inverter Customer Sub Circuits Inverter
Figure 9 Diagram of a single phase customer exporting Gross/Net PV power to utility (Dalitz & Cutler 2013)
The purpose of grid-connected inverter is (Stapleton 2012):
Synchronizing inverter output frequency to the grid system frequency. Converting DC voltage from PV array to a sinusoidal AC voltage.
Operating safety and protection of devices of inverter and grid (including islanding detection and protection).
Deploying Maximum Power Point Tracking (MPPT) so that inverter delivers maximum power from PV array to the load (contributing to highest inverter efficiency).
Combined Gross and Net meter records electrical energy in kWh consumed by the loads within the property where the meter is connected. Distribution supplier monitor these meter to retail energy sales to customer. Net metering describes a metering arrangement where all electricity is exported to grid. Gross metering describes a metering arrangement where excess electricity is exported to grid through an second meter. There are two types of electricity in
interest to distribution supplier: feed in electricity to grid and customer consumption provided from grid. The distribution supplier sets the feed in tariff and consumption tariff.
Microgrid
A microgrid refers to distributed energy resources (DER) and loads that are either grid connected or operate in “islanded” mode (ABB 2018). In grid connected mode, inverter is connected with utility grid network and excess power is sent to utility grid produced by resident or commercial property. Scope of this thesis is limited to residential connected grid. In “islanded” mode, inverter is connected in an independent network isolated from utility grid.
Distributed energy resources (DER) refers to small scaled DG located close to end user rather than power utility. Examples of popular DER installed include: PV modules, wind generators, battery storage, batteries in EVs and HEVs discharged back to grid, biomass generators, diesel/oil generators, fuel cells and small hydro scheme turbine generators (AEMC 2018).
The benefits of microgrid on utility, consumer and environment is:
Microgrids utilize DER which leads to less greenhouse gas emissions on environment. Micro grids utilize energy sources close to end user. Hence, long transmission line losses
are minimized And heat losses that might otherwise be wasted is harnessed through a combined heat and power system.
Microgrid provide resilience power source and backup for critical facilities during grid blackouts and failures.
Microgrids consist of both energy generation and energy storage devices close to the load thus have greater flexibility in managing supply and demand.
Due to cost effectiveness and safety issues related with testing and commissioning physical microgrid power systems, In Hardware-in-loop (HIL), DER devices are interfaced to a Real Time Simulator (RTS) where the physical system is modelled to test the actual system (DER) operation (RTDS-Technologies 2018) using low voltage/current signals exchanged by sensors. Power Hardware-in-loop (PHIL) is an extension of HIL where power required by DER devices is
also taken into considered to model physical system on top of low voltage/current signals exchanged by sensors. The power required by DER devices is detected through power amplifier (Opal-RT-Technologies 2018). RTS models the physical utility grid. The PHIL model is as shown in figure 10 below (Opal-RT-Technologies 2018). Controller Hardware-in-loop (CHIL) is an variant of HIL where voltage/current signals exchanged by sensors and RTS is interfaced with controller. Physical DER devices are modelled in Controller. CHIL offers even more cost effective and safe method to testing and commissioning microgrid than PHIL. In comparison PHIL model is more reliable.
Figure 10 Model of Power Hardware in loop (PHIL)
Photovoltaic Modules and Array
Photovoltaic cells combine to create PV module, and PV modules combine in a matrix to form a PV array. PV array consist of PV modules in series/parallel arrangement. A PV module has 3 important ratings: voltage, current and power. In series arrangement, usually the current rating is matched among the PV modules. In parallel arrangement, usually the voltage rating is matched among the PV modules. The sum of individual power ratings of modules determines the total power delivered from the array. Figure 11 shows PV array in a 4 x 2 matrix (2 parallel lots of 4 panels in series) connected to inverter. Various combination of series/parallel modules is possible to dictate current, voltage and power delivered to the load. Fuses are designed to open circuits due to over-currents to prevent further damage to PV system if fuse were not present. This is normally housed in a passed through box. Fuse is a sacrificial device, a blown fuse is
replace by a new one. The internal elements of a fuse reacts to an over-current condition by melting. Current versus time characteristics of a fuse determines how fast a fuse melts over a sustained over current. Current rating of a fuse determines the current versus time characteristics of a fuse. The rating of a fuse is thus estimated by nominal current and an addition of a 25% buffer. This ensures that the fuse does not melt at nominal current. If a 10A nominal current flows then an addition of 25% safety margin result in 10A x 1.25 = 12.5A. Thus a 13A fuse is recommended (nearest size up). The voltage rating of the selected fuse is also important, which must be greater than or equal to the circuit voltage.
Pass Through Box DC Disconnect Inverter 4 X 2 Matrix Solar Array To AC Grid
Figure 11 PV array in a 4 x 2 matrix connected to inverter
PV system has safety DC disconnect that allows the DC current, after the pass through box, to be interrupted before reaching the inverter. If the open circuit voltage of the solar array is 800V and a safety margin of 15% is applied which results in 800V x 1.15 = 920V. Thus a 1000V insulated voltage and 1000V operational voltage rated DC disconnect switch is recommended (nearest size up). The operational voltage is the voltage at which the switch is designed
(CivicSolar 2018a) (SolDistribution 2016). The insulated voltage is the voltage at which the switch is tested at laboratory. Furthermore, short circuit current and nominal current through switch in addition with the safety margin of 25% gives the computed short circuit current and nominal current result (CivicSolar 2018a) (SolDistribution 2016). For recommended sizing, maximum rated current of switch and rated current of switch must be equal to or higher than the computed short circuit current result and nominal current result respectively. The 25% safety margin and 15% safety margin is rule of thumb used by engineers. Both DC disconnect switch and fuse used in PV system is DC rated. Furthermore, fuses are re-wire able or resettable high rupturing capacity (HRC) fuse.
The cable run utilized from solar array to inverter produces voltage drop in cable under load condition. Voltage drop depends on current through the cable and the internal resistance of the conductor. Internal resistance of the conductor depends on the cross sectional area of the conductor. Higher the cross sectional area of the conductor, lower the voltage drop. Voltage drop is a key factor in grid connected PV systems. Higher voltage drop means lower voltage available to the load (Stapleton 2012). National code AS5033-2014 enforce maximum 3% voltage drop from solar array to inverter.
CCC (Current carrying capacity) of conductor is another crucial factor in grid connected PV system. If actual current flowing through conductor exceeds CCC then the conductor yields damage. CCC is determined by core element type, core cross sectional area, insulation rating of conductor, highest insulation temperature/location and ambient temperature (Stapleton 2012). Cable should be selected such the nominal current flowing through the conductor times 1.25 is less than or equal to CCC as per AS5033:2014.
Batteries
There is also an option of utilizing a battery in a grid connected PV system. The cheapest option would be to turn off the export circuit and charge deep cycle battery. Batteries offer advantage of increasing self-consumption and provide secondary backup during grid failure. Deep cycle batteries are capable of cycling i.e. discharging and charging many times. The C-rate is a
measure of the rate at which a battery is being charged or discharged. 1C charges in 1hour, 2C charges in 30 minutes and so forth (Matters 2018).
Type of deep cycle batteries are AGM Batteries, Sealed Lead Acid Batteries, Flooded Lead Acid Batteries, Gel Batteries and ion Batteries (Matters 2018). AGM and Lithium-ion are the most popular types of deep cycle batteries in the market. The AGM battery (Absorbent Glass Mat) is arranged in porous fiberglass mats which contain electrolytes. AGM battery is fully sealed and thus easier to transport. AGM battery don’t need to been topped with water. AGM battery can accept large charge currents because of low internal resistance (Matters 2018). In Lithium batteries lithium ion flows from one electrode to another, the direction depending on whether charging or discharging. They can handle up to 8 times as many charge cycles as AGM battery, can discharge very close to 100% of their capacity, and have a very high C-rate.
Connectors and Cables
In 2008 National Electrical Code (US standard) required solar panel connectors to lock together and then separate again using a tool. As a result Multi-Contact produced M4 connector and Tyco produced Solarlok PV4 connector a shown in figure 12 below.
The male and female connectors can be separated by force but it requires a special unlocking tool taylor made for M4 or Solarlok PV4 requirements. In series connection, male connectors in plugged in with female connector. The male connector will join directly into the female connector. For parallel connection, male is connected with male and female with female with a tertiary multi-branch connector. The positive terminal of the solar panel is usually male and negative terminal is usually female.
When two or more panels are connected in series, extension cables bring power to wherever electrical equipment is located (usually through a fuse and a DC disconnect switch). Extension cables can also be adapted to series parallel Solar Array matrix. The length of MC4 cable can vary up to 100 feet. The cabling sizes range from 2.5mm2 to 10mm2 and connector pin is 4mm diameter (Arizona 2018). M4 connectors are rated for (Arizona 2018):
30 amps max (the connector itself) 1,000 volts max
-40 degrees C to +90 degrees C
Tyco Solarlok PV4-S cabling sizes range from 2.5mm2
to 6mm2. PV4-S connectors are rated for (CivicSolar 2018b)
40 amps max (the connector itself) 1,500 volts max
-40 degrees C to +115 degrees C
PV Junction Box
A PV array with pass through box is shown in representative diagram above. However, in practical situation a junction box is used instead of pass through box. The junction box contains string fuses, string diodes and sometimes isolators (DC disconnect switch). Surge arrestors are also often installed in PV junction box to short excess voltage to ground. In larger installations string monitoring unit is also combined in junction box to detect string failures. The string fusses used in junction box are used against DC over current and miniature style (Earthscan 2013). Whenever short circuit or shading occurs in strings, string diode prevents currents from flowing
in reverse direction and damaging the inverter. String diode blocking voltages is selected to be twice the open circuit voltage of PV string at STC (Earthscan 2013). Junction box is rated Protection class II and IP54. Protection class II is protected by at least two layers of insulation between the current carrying conductor and any metallic contact to the user. IP 54 protection signifies cover of junction box secures it from water spray and dust ingress.
Synchronizing Single phase Inverter to Grid
Electric grids are complex and dynamic systems. Grid variables like frequency and voltage fluctuate depending on connection/disconnection of load, faults, lightning strikes, connection/disconnection of PV and other power generators, disturbance caused by harmonic currents and user/consumer operation errors. Thus, grid variables are continuously monitored by the grid-inverter interface. Furthermore, grid codes implemented in inverter are enforced by utilities, for example, voltage and frequency are required to operate within limits. Therefore, Inverters trip and disconnect power when these type of grid variables go beyond the limits (Teodorescu 2011).
In this context, Synchronization means that output voltage and frequency from the Inverter work in unison with the reference voltage and frequency of the utility grid. There are four basic control methods of synchronizing single phase inverter output to grid (Amanci 2010; Teodorescu 2011):
Zero crossing detection Fourier Analysis Based Filter Phase Locked Loop (PLL) Kalman filtering
Zero crossing detection
Zero-crossing control method detects the instance when the grid voltage crosses the zero axis. It is achieved by using a comparator to detect changes in polarity of the grid voltage. Then the inverter output signal is reset at the zero crossing instance of the grid voltage, so that the inverter output voltage signal locks on and is synchronized to the grid voltage signal (Azrik et al. 2012;
Teodorescu 2011). Zero crossing method is not popular nowadays because of its sensitivity to harmonics and noise (Amanci 2010).
Fourier Analysis Based Filter
This filter works by frequency selective band pass filtering using Fourier series. Fourier series is a mathematical technique used for analysis and synthesis of a signal. With Fourier series, any signal can be broken down into a sum of cosine/sine functions of multiples of the fundamental frequency of a given signal. According to (Teodorescu 2011) a signal v(t) can be expressed as:
𝑣(𝑡) = 𝑎0+ ∑∞𝑛=1(𝑎𝑛cos(nωt) + 𝑏𝑛sin(nωt)) (2.1) With coefficients calculated as:
𝑎0 = 1𝑇∫ 𝑣(𝑡) 𝑑𝑡0𝑇 (2.2)
𝑎𝑛 = 21𝑇∫ 𝑣(𝑡) 𝑐𝑜𝑠 (𝑛𝜔𝑡) 𝑑𝑡0𝑇 (2.3)
𝑏𝑛 = 21𝑇∫ 𝑣(𝑡) 𝑠𝑖𝑛 (𝑛𝜔𝑡) 𝑑𝑡0𝑇 (2.4)
Using the above mathematics, a Fourier series based band pass filter can be created to extract the fundamental frequency of output voltage Voutput (which is also the synchronized
voltage to the grid).
𝑉𝑜𝑡𝑝𝑢𝑡 = (𝑎1cos(ωt) + 𝑏1sin(ωt)) (2.5)
Therefore the filter design is based on the above equation where 𝜔 = 2𝜋𝑓. Nevertheless discrete versions of Fourier series like DFT (Discrete Fourier transform) are well known to be faster (as they process fewer amounts of data). However as pointed in literature (Hostetter 1980), DFT can also be awkward and complicated to implement. For example DFT algorithm uses a large number of, computationally burdensome, complex multiplication operations for a larger N number of samples (equally spaced in the time domain) (Teodorescu 2011). For the above reasons, modified Recursive Discrete Fourier transform (RDFT) filter (McGrath, Holmes &
Galloway 2005) is used which is a variant of DFT. This modified filter also addresses the problem of phase error between the output of the inverter and the grid voltage by using extra compensation algorithms.
Phase Locked Loop
The basic concept of Phase Locked Loop (PLL) was first developed in 1920s and 1930s. It was first used mainly for radio reception. Since then it has been used in a variety of electrical and electronic applications (Guo, Wu & Gu 2011). Nowadays PLL is the most popular method used in synchronizing inverter output signal to the grid frequency. Figure 2.6 shows a basic diagram of PLL used in synchronization. The PLL is a non-linear negative feedback control. The phase of the grid voltage is detected and compared to the phase of the input signal. Intuitively, during the phase lock, the Error on the comparison of the two signals is zero or minimal. In a conventional PLL design, analog multiplier is implemented as a phase detector. Example of PLL is shown in figure 13 below.
Figure 13 Block Diagram of Conventional PLL used in Synchronization
It is because of when two signals are multiplied, the amplitude of the signal is proportional to the difference in phase between the two signals (Kruger 2012). When phase lock is not achieved, it produces significant Error. The average of the Error (or the dc component of the Error) is computed using the Loop. The Loop filter uses either a low-pass filter or a PI controller to do this (Teodorescu 2011).Then the Voltage Controlled Oscillator (VCO) generates
output voltage shifted away from the central frequency proportional to the DC component of the Error signal. The negative feedback mechanism ensures error is zero or minimal thus achieving synchronization.
It is suggested that modern VCO used in PLL consists of control voltage to control current (V2I) and current-controlled ring oscillator (CCO) (Fischette 2004; Saxena 2004). These circuits are quite complex and incorporated as integrated circuits in the design of a VCO. However, grid-connected inverters used DSP (Digital Signal Processor) chip to implement VCO and other PLL functionality.
The basic PLL control structure discussed above is excellent in tracking frequency by locking the phases of the inverter output to the grid. However, the drawback of the basic PLL is its slow response as reported in (Teodorescu 2011). In control systems theory, the slow response causes large settling time. The basic PLL detects the phase difference of the input and output by multiplying the two signals in PD (Phase detector) which decompose to low frequency (50Hz) and high frequency (100Hz) terms. During phase lock, the mathematical equations show that oscillatory component (50HZ) of the low-frequency term disappears leaving only the DC component of the low-frequency term. However during phase lock, both oscillatory (100Hz) and DC component of high-frequency term remains. Ideally the high-frequency component (100Hz) is filtered out by low pass filter (inside the Loop Filter) leaving only DC component of the signal. However, practically as the frequencies are so close (0Hz and 100Hz) and with typical cutoff frequency of 21.3Hz as reported in (Teodorescu 2011) results in larger settling time.
A different approach of phase-locked loop design eliminates the problem of larger settling time. If PD (Phase Detector) would multiply input and output signals in such a way as to decompose only the DC component of the low frequency (50 Hz) term. The solution to this is realized (Teodorescu 2011) as PLL PD based on Quadrature signal generation and Park transformation (see figure 14):