Swarm Computational Intelligence Design for a
High Integrity Protection System
Kayode Owa, Lisa Jackson, and Tom Jackson.
Abstract—The search meta-heuristic procedure that mimics the process of biological natural selection is an embedded part of artificial intelligence (AI). This is regularly used for obtaining the solution to some optimization problems such as the minimization of disastrous occurrence events in industries. Extra precautions are given to people and equipment operating in hazardous and harsh environments; thus there are safety systems designed to give the required, accurate, necessary and timely protections. There is hence the need to drastically reduce the probability of the occurrence of a system failure. A High Integrity Protection System (HIPS) is a safety device which could be installed on offshore facilities with the objective to mitigate a high pressure upsurge that has the potential to cause immense harm and subsequently destroy the system. The aim of the research is to use a Particle Swarm Optimization (PSO) approach to intelligently design the system in order to optimize and reduce the unavailability of the HIPS design. A Fault Tree Analysis (FTA) model is employed to build the HIPS structure. FTA is a top-down approach using Boolean logic operations that is used to analyze causes, investigates potential and likely faults and to quantify their contribution to system failure in the process of product design. Comparison is made between this HIPS-PSO approach and the previous work performed using a genetic algorithm (GA). Alongside from the simplicity in the design of the HIPS-PSO approach, a much faster execution time and a reduced system unavailability was obtained when compared with the GA approach.
Index Terms—Particle Swarm Optimization (PSO), High Integrity Protection System (HIPS), Fault Tree Analysis (FTA), Safety Systems, System Unavailability.
I. INTRODUCTION
E
VOLUTIONARY algorithms (EAs) are very appropriate to optimally solve problems where there exists no known algorithm that can produce the result in polynomial time. EAs are heuristic approaches to solve optimization problems by mimicking the biological nature of evolution. EAs such as particle swarm optimization (PSO), genetic algorithm (GA), simulated annealing (SA), artificial bee colony (ABC) and ant colony optimization (ACO) have been used to provide optimal solutions for numerous optimization problems [1], [2], [3], [4], [5], [6].The conventional approach in design operations consists of many stages such as the initial design, analysis, evalu-ation, testing, and assessment - the final designs are often produced through trials and errors procedures. This is rather cumbersome to comprehend to design and mostly erroneous. Safety critical system designs are very important and cannot be subjected to such; they are normally needed to produce
Manuscript received December 07, 2015; Camera ready received by December 22, 2015.
Dr Kayode Owa and Dr Lisa Jackson are with the Department of Aeronautical and Automotive Engineering, corresponding e-mail: ([email protected]).
Prof Tom Jackson is the director of the Centre for Information Man-agement, School of Business and Economics at Loughborough University, Leicestershire, LE11 3TU, United Kingdom.
a defined availability performance to keep the risk within a speculated bound. EA algorithms such as the PSO has the capabilities to rapidly and iteratively produce safety designs with pre-determined acceptability criteria for system failure unavailability.
A safety system is an essential part of an industrial system as it operates to prevent the occurrence of certain conditions and their future development into a hazardous situation. Protection is provided for processing equipment whose pressure rating could be exceeded. The High Integrity Protection System (HIPS) is basically designed to hinder a high pressure surge going across the system. Failure of such safety systems may have catastrophic consequences. Members of the workforce or the public could be injured or even killed. To minimize the likelihood of a hazardous situation, safety systems must be designed to maximize their availability or minimize their unavailability. The aim in the research is to investigate a design optimization scheme which yields an optimal safety system design by fully utilizing available resources. This work focuses on the implementation of PSO for the optimization of the design of the HIPS.
The remainder of this paper discusses the related work (Section II), the implementation of the PSO optimization approach (Section III), HIPS fault tree design (Section IV) and the results of applying this new technique to the safety system are discussed in Section V and finally the conclusions come in Section VI.
II. RELATEDWORK
III. OVERVIEW OF THEPSO OPTIMIZATIONAPPROACH
A. Principle of the PSO method
PSO was proposed by Eberhart and Kennedy in 1995. Since numerous scientific research has been carried out and applied to many diverse problems [11]. PSO is a swarm intelligence meta-heuristic which is biologically inspired by the behavior of a set of particles (swarm) which could be referred to as bees, insects or birds. It is a population-based method that is iteratively adapted and adjusted until a termination criterion is fulfilled. Swarms in the neighborhood operate in such a way that information about fitness and position of particles are passed from one to another while retaining the information of the best previous states as it propagates through the iterative procedure. PSO performs well when applied to optimization problems of large dimensions and non differentiable functions. Essentially, PSO can search for a diverse solution space at a fast rate; its results might not considerably improve further when the population size is large; this approach is designed to use a minimal number of populations so as to reduce the computational time. The initial and subsequent population are randomly generated in such a way to form sub-populations that span the whole range for a constrained optimization problem. Good population members are retained in each PSO generation throughout the entire optimization process as it evaluates fitness values and suitabilities for solution via the objective function. The PSO algorithm used as part of this research uses a random velocity approach for the exploitation and exploration of the populations for potential solutions. This process helps to avoid the operation being trapped in a local minimum solution. In this way, there is an efficient and effective use of the number of generations; this invariably leads to the drastic reduction in the number of generations for the proposed novel application. Furthermore, there is an improved performance and a reduced computational time. This approach is to enhance a global optimal solution.
B. Methodology for the PSO approach
The measures and processes for the implementation of the PSO approach are enumerated; the operations are subsequently described in the following procedures:
Procedure 1 - Parameter Initialization: The process starts by deciding and choosing the following parameters: number of generations (τ), number of populations (η) and minimum and maximum constraints on the population inputs.
Procedure 2 - Population Derivation: Initialize the swarm position population (a), swarm velocity population
(b) and swarm best position population (c) with all their populations confined within the upper and lower limits of their respective constrained values. These populations are derived for the variables described and shown in Table I. The vectors (a), (b) and (c) depict the current position vector, attraction to the group best vector and attraction to the overall individual best respectively.
Procedure 3 - Fitness Calculation: Obtain the fitness values of the populations generated in procedure 2.
Procedure 4 - Population Fitness Exchange: The best n-dimension population vector/string in each of the populations in procedure 3 are retained and transferred from one generation to the next. This ensures enough diversities throughout the entire process. New populations are constantly being introduced in each generation from the PSO operations. One good quality of this algorithm is in the introduction of what is called a variable velocity (ρϕ). This is to further ensure an increased diversity and helps to avoid settling in a local optimal solution. The variable velocity (ρϕ) shown in equation 4 is introduced and injected into the algorithm in a situation where there has been no significant and successive improvement in the solution for a certain period of time.
Procedure 5 - Particle Position Update: The update fragment of the entire process of PSO is summarized in equations (1 - 5). The swarm particle vector update equation (equation 4) equates to the summation of the inertia (κ) shown in equation 1, the local memory or the cognitive learning component (ξ) in equation 2, and the global memory or the social learning factor (ϑ) in equation 3. The ρϕ component in equation 4 is introduced in every generation in order to create a varied diversity in each generation depending on the result performance while equation 5 is the swarm particle position vector update equation. Equation 5 helps to constantly change and update the position vector in each generation as it gets closer to the optimal solution.
κ= Φ(k)∗Vi(k) (1)
ξ=α1∗γ1i∗[P bi(k)−Pi(k)] (2)
ϑ=α2∗γ2i∗[Gb(k)−Pi(k)] (3)
Vi(k+ 1) =ρϕ∗[κ+ξ+ϑ] (4)
Pi(k+ 1) =Pi(k) +Vi(k+ 1) (5)
Considering the equations, i = particle index of the pop-ulations, k = discrete time index, minimum (α1min) and maximum (α1max) cognitive learning parameters, minimum (α2min) and maximum (α2max) social learning parameters whileγ1i andγ2i are random numbers in the range between [0,1]interval that are associated with the cognitive and social learning parameters respectively, P = position vector, V = velocity vector,Pb= Personal best vector andGb = Global best population. The parameters in equations 1, 2 and 3 are further explained in equations 6, 7 and 8. The new velocity vector obtained in equation 4 is a linear combination of these three vectors (P,VandPb). The attractions to the group best and the global best help to drive the optimization process to achieve an optimal solution.
Φ =−(Φmax−Φmin)∗
ϕ
τ +Φmax (6)
α1= (α1max−α1min)∗
ϕ
Fig. 1: Structure of High Integrity Protection System (HIPS)
α2= (α2max−α2min)∗
ϕ
τ +α2min (8)
Note the current iteration value = ϕ, maximum iteration specified = τ, inertia weight function (Φ), initial weight value (Φmin) for the inertia function, final weight value (Φmax) for the inertia function. These initial values were determined heuristically after a few trials.
Procedure 6 - Next Generation: The whole process goes back and repeats from procedure 3 till procedure 6 by evaluating the fitness values of the new next generation populations.
Procedure 7 - Stopping Criterion: The algorithm stops when the specified number of epochs or generations is reached.
IV. HIPS PARAMETERS EVALUATION AND IMPLEMENTATION
A. HIPS Design
The main function of the HIPS is to prevent a high-pressure surge passing through it. The HIPS is divided into two separate sub-systems. Subsystem One(SubS1)is the
Emer-gency Shutdown (ESD) subsystem. This is the first level of protection of the HIPS. The ESD system acts to close the Wing and Master valves together with any ESD valves that have been fitted when pressure in the pipeline exceeds the permitted value. This value is monitored using Pressure Transmitters (PT). Subsystem Two (SubS2) provides an additional level of protection; the inclusion of the HIPS incorporates this second level of redundancy. The latter sub-system is completely independent in operation. Its method of protection is the same as the ESD system. Figure 1 represents the main features of the HIPS [9], [12].
In this work the design optimization scheme has been applied to a HIPS where ten variables are considered in the system design. These variables, their description and evaluation limits are shown in Table I where MTI is the maintenance or inspection test interval. Two points to note are firstly that it is assumed that whatever Valve type or PT type are fitted, they are the same in the entire design. The second point is that the number of PTs required to activate the closure of valves on subsystem 1 or 2 is a function of the numbers installed(N1, N2)in the design. Given the numbers
of likely design variations from all the design variables shown in Table I, this results in more than44million possible design scenarios. It is therefore not feasible to completely solve for each potential design. Furthermore, it is an arduous task to understand the interactions that exist between all the design variables and is practically inconceivable for any engineer to manually design. A technique is required to
[image:3.595.309.547.119.223.2]determine the best design option in a more practical manner. This is to be achieved using a computerized optimization algorithm.
TABLE I: HIPS Design Variables
Variables Description Range of Values
θ1 MTI for SubS1 1 week - 2 years
θ2 MTI for SubS2 1 week - 2 years
V Valve Type 1 or 2
P PT Type 1 or 2
N1 No of PTs fitted for SubS1 1 - 4 N2 No of PTs fitted for SubS2 0 - 4 K1 No of PTs required to activate SubS1 1 - N1 K2 No of PTs required to activate SubS2 0 - N2 E No of ESD valves fitted 0 - 2 H No of HIPS valves fitted 0 - 2
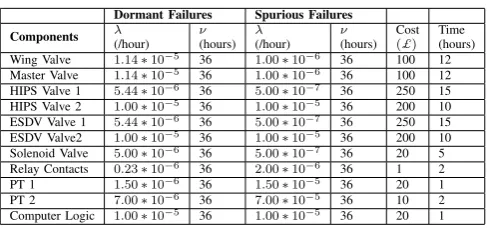
Each hardware component of the HIPS can fail either in a dormant mode or spuriously. A dormant failure can be described as the inability of the component to carry out its desired task on demand. In contrast, spurious failure results from the component carrying out its desired function when its operation is not required. Table II shows the details of the HIPS design variables: failure rates (λ) and the mean time to repair - MTTR (ν) for each HIPS component in both dormant and spurious failure modes. This data will be used subsequently when calculating the unavailability and spurious trip probability of the HIPS. Each combination of HIPS variables gives a new system design with its particular features such as cost and the maintenance down-time (MDT). The choice of system design is not unlimited. In this case, there are three limitations on the available resources. The total cost of the system must be less than one thousand units. The average time each year that the system resides in the down state due to preventative maintenance is a maximum of one hundred and thirty hours. If the number of times that a spurious system shutdown occurs is more than once per year then it is deemed unacceptable. The hardware costs in £for each component in the system as well as times taken to service each component at each maintenance test are shown in Table II.
TABLE II: Component Failure Data
Dormant Failures Spurious Failures
Components λ
(/hour)
ν
(hours)
λ
(/hour)
ν
(hours) Cost
(£)
Time (hours) Wing Valve 1.14∗10−5 36 1.00∗10−6 36 100 12 Master Valve 1.14∗10−5 36 1.00∗10−6 36 100 12 HIPS Valve 1 5.44∗10−6 36 5.00∗10−7 36 250 15 HIPS Valve 2 1.00∗10−5 36 1.00∗10−5 36 200 10 ESDV Valve 1 5.44∗10−6 36 5.00∗10−7 36 250 15 ESDV Valve2 1.00∗10−5 36 1.00∗10−5 36 200 10 Solenoid Valve 5.00∗10−6 36 5.00∗10−7 36 20 5 Relay Contacts 0.23∗10−6 36 2.00∗10−6 36 1 2 PT 1 1.50∗10−6 36 1.50∗10−5 36 20 1 PT 2 7.00∗10−6 36 7.00∗10−5 36 10 2 Computer Logic 1.00∗10−5 36 1.00∗10−5 36 20 1
B. HIPS Dormant and Spurious Unavailability Fault Tree Structure
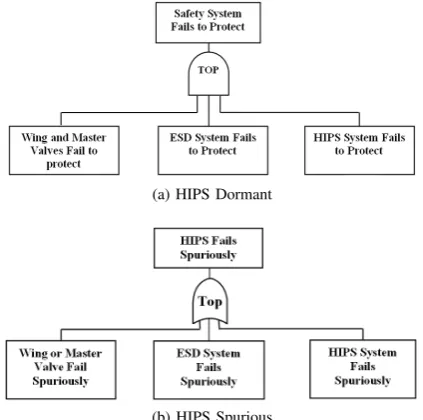
[image:3.595.306.550.545.659.2](a) HIPS Dormant
[image:4.595.63.275.54.264.2](b) HIPS Spurious
Fig. 2: Top Event Structure of the HIPS Unavailability.
implement. One way to solve this problem could be to use automatic fault tree construction methods, if they were available. An alternative is to resolve this difficulty by using house events. These enable the construction of a single fault tree capable of representing the causes of the system failure mode for every possible system design. The structure of the top event of both HIPS failure modes are shown in Figure 2. The top event of the HIPS unavailability fault tree shown in Figure 2a represents the causes of the system failing to protect the processing equipment. The top event ‘Safety System fails to Protect’ will occur if all (Wing, Master, ESD and HIPS) valves along the pipeline fail to close. In total, the fault tree dormant mode structure consists of 154 gates, 38 basic events representing component failures, and 40 house events representing the design options. Consequently, the sub-events ‘Wing and Master valves fail to protect’, ‘ESD valves fail to protect’ and ‘HIPS valves fail to protect’ related by AND logic are immediate, necessary and sufficient. Each valve is a fail safe type which can be defined as ‘air to open’. The principle of each valve working can be described as follows: when the pressure in the pipeline is at an appropriate level, the solenoid of the valve is maintained by computer logic in an energized state, the pneumatic line remains pressurized and the associated actuator retains the valve in the open state. When pressure in the pipeline increases, pressure transmitters detecting that fact transmit a signal to the computer. In the case when the pressure increase exceeds the acceptable level, the functionality of the computer causes the circuit of the output channel to the solenoid to open. This circuit can be broken by two relay contacts which introduce a level of redundancy. As a result, the solenoid is de-energized and a vent valve activated. Consequently, pressure drops to the actuator, causing the valve to close.
In a similar manner, consideration is given to a second system failure mode, spurious activation of the HIPS. If any one of the valves included along the pipeline closes the top event will occur. Figure 2b shows the spurious trip frequency for each design which is also an implicit constraint that requires the use of fault tree analysis to assess its value. House events are again used to construct a fault tree capable
of representing each potential design for this failure mode. The immediate, necessary, and sufficient sub-events to the top event are ‘Wing or Master Valve Fails Spuriously’, ‘ESD Subsystem Fails Spuriously’ and ‘HIPS Subsystem Fails Spuriously’ are related by an ‘OR’ logic gate. The fault tree consists of 142 gates, 38 basic events and 40 house events. Each valve is an ‘air to open’ safety type. It is important to notice that house events incorporated in the HIPS spurious trip fault tree structure and the house events from the first level of the HIPS unavailability fault tree are consistent with each other. Furthermore, the structural characteristics of the design remain the same in each case. However, the failure modes of the sub-events are different.
C. HIPS Cost Evaluation
There are two main categories of constraints: explicit and implicit. Explicit ones can be determined and easily evaluated from an explicit function of the design variables. In contrast, implicit constraints can only be evaluated by a full analysis of the system. Cost of the HIPS design is an explicit constraint and is represented by the following equations:
Cost=Cost(SubS1) +Cost(SubS2)≤1000 (9)
Cost(SubS1) =E(V
1CV E1+V2CV E2+Cs) +N1(P1CP1+P2CP2) + 261 (10)
Cost(SubS2) =H(V
1CV H1+V2CV H2+Cs) +N2(P1CP1+P2CP2) + 21 (11)
where:
CV1=CV E1=CV H1 - cost of the valve type 1,
CV2=CV E2=CV H2 - cost of the valve type 2,
CP1 - cost of the pressure transmitter (PT) type 1,
CP2 - cost of the pressure transmitter (PT) type 2,
Cs - cost of the solenoid valves.
The constant 261 (equation 10) forSubS1 is the additional cost for the wing and master valve, their solenoid valves, the computer and control relays.SubS2 has a fixed cost of 21 units (equation 11)) for the computer and control relays. From equations (9) - (11) the cost of each system design is:
Cost= (E+H)(V1CV1+V2CV2+Cs) + (N1+N2)(P1CP1+P2CP2) + 282 (12)
D. HIPS Maintenance Down Time Evaluations
Similarly to the cost for the HIPS, average MDT (mainte-nance down time) is calculated as a sum of the mainte(mainte-nance down time ofSubS1 andSubS2 for each potential design:
M DT =M DT(SubS1) +M DT(SubS2)≤130 (13)
M DT(SubS1) =52
θ1[E(V1MV E1+V2MV E2+Ms) +N1(P1MP1+P2MP2) + 47] (14)
M DT(SubS2) =52
θ2[H(V1MV H1+V2MV H2+Ms) +N2(P1MP1+P2MP2) + 13] (15)
where:
MV E2=MV H2=MV2 - test time of the valve type 2,
MP1 - test time of the pressure transmitter (PT) type 1,
MP2 - test time of the pressure transmitter (PT) type 2,
Ms- test time of the solenoid valve. The expression 52θ
x (equations 14 - 15) gives the number of
times the system is down in a year. The constant 47 (equation 14) is the sum of the test times for the wing and master valve, their solenoids, the computer and control relay for
SubS1. Similarly forSubS2, the sum of the test time for the computer and control relay is 13 units (equation 15). From equations (13 - 15), MDT for each design can be calculated using equation 16:
M DT = 52∗[H1∗H3+H2∗H4+H5] (16)
where:
H1=V1MV1+V2MV2+MS,
H2=P1MP1+P2MP2,
H3= θE1 +θH2,
H4= Nθ11+Nθ22,
H5= 47θ1 +
13
θ2.
E. HIPS Analysis
The most important feature of each safety system is its perfect operation and swift action when an urgent demand is required. Therefore, the objective is to minimize system unavailability, which means to minimize the probability of system failure on demand. Ideally, using the design alter-natives, it is essential to determine which potential system design would produce the highest functionality.
In practice, certain factors need to be taken into account and it is the available resources for this application. The limitations on resources were defined as cost, maintenance effort and spurious frequency. The design options should improve the HIPS performance without violating the con-straints. Consequently, the evaluation of each constraint is required in order to assess the overall desirability of each design option.
F. Fitness Evaluation and Penalty Formulas
The system unavailability is the main optimization criterion. However, resources are not inexhaustible. Therefore, the following limits were considered:
• Cost≤1000units,
• Maintenance Down Time:M DT ≤130 hours, • Spurious System Failure:Fsys≤1 per year.
If these three parameters exceed their respective limits, the following penalty equations were implemented in this HIPS-PSO design:
1) The method utilized tries to form a direct relationship between cost and performance. HIPS-PSO designs with excessive cost will not be adopted so the more the constraint violation the heavier the penalty. This is implemented using an exponential relationship of the form y = x54. For comparison with previous
work [7], the cost penalty also takes into account both the cost violation and the system unavailability. This is achieved using a multiplying factor which, rather than being fixed, varies according to the system unavailability of the design. Hence, the modified cost penalty formula (Cp) for excess cost is shown in equation 17.
Cp=
(COST −1000)
1000
54
∗Qsys (17)
whereQsysis the system unavailability.
2) If the MDT of a particularHIPS-PSOdesign exceeds
130hours, a contribution is made to the unavailability of the system in the form of a penalty. The respective penalty(Mp)is shown in equation 18.
Mp=
(M DT −1000)
8760 (18)
where the value of 8760 is the number of hours per year.
3) The third constraint, excess spurious trip occurrence is also related to the cost. If a spurious trip occurs, production ceases and hence a financial loss is in-curred. It was assumed that the cost per hour for loss of production is 100 units. On average, a spurious trip requires 36hours (refer to Table II) to repair and only one such occurrence is acceptable in a yearly period. Using the cost penalty formula (equation 17), the spurious trip penalty (Sp) can be expressed as shown in equation 19:
Sp=
Excess Cost
1000
54
∗Qsys (19)
Each penalty is subsequently added to the system unavailability. The result is a sole fitness value for each design referred to as its penalized system unavailability
(Q0sys), shown in equation 20.
Q0sys=Qsys+Cp+Mp+Sp (20)
V. RESULTS ANDDISCUSSION
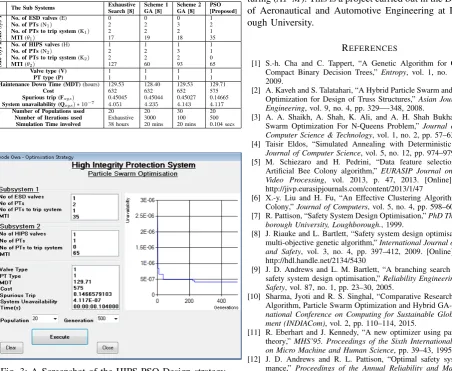
PSO approach. The swarm parameters are heuristically cho-sen with these values :Φmax= 0.08,Φmin= 0.06, α1max= 0.02, α1min = 0.01, α2max = 0.04, α2min = 0.03. A variable velocity added to these parameters helps not only to avoid being trapped in a local but to enhance obtaining a near optimal solution. This algorithm is designed to use an optimal population (η= 20) and generations (τ = 500)
while [8] has a populations of (η= 20,30)and generations of (τ = 3000,100) respectively for the implementation of the 1st and 2nd scheme. This approach is designed with optimal values of τ and η in order to ensure a much reduced execution run time which would be very appropriate for a case of a massive fault tree structure. Moreover, the PSO approach gives a further reduced system unavailability
(Qsys)than with either of scheme 1 or 2 in [8] and the best reduced overall cost of £575. Moreover, the main strength of this approach is the drastic reduction in the execution run time involved: about a tenth of a second for the proposed PSO approach while it expended 38 hours for exhaustive search and 20 minutes each for the two schemes. The interesting finding from this approach as shown in the results screenshot in Figure 3 is that it took about 12 of the number of generations (just above 200 iterations) to produce the optimal result. Table III gives the comparison results of these approaches.
TABLE III: Characteristics and Comparisons of the Best Design Structure
The Sub Systems Exhaustive
Search [8]
Scheme 1 GA [8]
Scheme 2 GA [8]
PSO [Proposed]
Sub
Sys
1 No. of ESD valves(E) 0 0 0 1
No. of PTs(N1) 2 2 3 2
No. of PTs to trip system(K1) 2 2 2 1
MTI(θ1) 17 19 18 35
Sub
Sys
2 No. of HIPS valves(H) 1 1 1 1
No. of PTs(N2) 2 2 3 1
No. of PTs to trip system(K2) 2 2 2 0
MTI(θ2) 127 60 93 65
Valve type (V) 1 1 1 1
PT type (P) 1 1 1 1
Maintenance Down Time (MDT)(hours) 129.53 128.40 129.53 129.71
Cost 632 632 652 575
Spurious trip (Fsys) 0.45045 0.45044 0.45027 0.14665
System unavailability (Qsys)∗10−7 4.051 4.235 4.143 4.117
Number of Populations used 20 20 30 20
Number of Iterations used Exhaustive 3000 100 500
[image:6.595.56.509.394.765.2]Simulation Time involved 38 hours 20 mins 20 mins 0.104 secs
Fig. 3: A Screenshot of the HIPS-PSO Design strategy
VI. CONCLUSIONS
This paper presents the successful implementation of a Particle Swarm Optimization (PSO) approach to design a High Integrity Protection System (HIPS). The HIPS is a safety system that can be installed in an industrial envi-ronment and on hazardous processes in order to mitigate hazards such as overpressure, explosions, fires, explosions, releases of flammable or toxic materials, vessel and and gas blowout. A fault tree analysis (FTA) was carried out for the HIPS design for offshore platforms in order to calculate the design unavailability to initiate a shutdown in the case of an emergency. The HIPS processes numerous design options and the optimization tool is required in order to find the optimal system design within certain constraints. PSO brings more varieties, diversity and faster convergence in obtaining the optimal solution. It has scope to further usage in safety critical systems where scalability is not deemed to be an issue. The design simplicity and the fast execution speed will likewise enhance its utilization in industrial applications with massive model designs. Further work will explore the multi-objective technique for the design of systems with more than one objective to be satisfied.
ACKNOWLEDGMENT
This work is supported financially by the Engineering and Physical Sciences Research Council (EPSRC) under the project titled Adaptive Informatics for Intelligent Manufac-turing (AI2M). This is a project carried out in the Department
of Aeronautical and Automotive Engineering at Loughbor-ough University.
REFERENCES
[1] S.-h. Cha and C. Tappert, “A Genetic Algorithm for Constructing Compact Binary Decision Trees,” Entropy, vol. 1, no. 1, pp. 1–13, 2009.
[2] A. Kaveh and S. Talatahari, “A Hybrid Particle Swarm and Ant Colony Optimization for Design of Truss Structures,”Asian Journal of Civil Engineering, vol. 9, no. 4, pp. 329—-348, 2008.
[3] A. A. Shaikh, A. Shah, K. Ali, and A. H. Shah Bukhari, “Particle Swarm Optimization For N-Queens Problem,”Journal of Advanced Computer Science & Technology, vol. 1, no. 2, pp. 57–63, 2012. [4] Taisir Eldos, “Simulated Annealing with Deterministic Decisions,”
Journal of Computer Science, vol. 5, no. 12, pp. 974–979, 2009. [5] M. Schiezaro and H. Pedrini, “Data feature selection based on
Artificial Bee Colony algorithm,” EURASIP Journal on Image and Video Processing, vol. 2013, p. 47, 2013. [Online]. Available: http://jivp.eurasipjournals.com/content/2013/1/47
[6] X.-y. Liu and H. Fu, “An Effective Clustering Algorithm With Ant Colony,”Journal of Computers, vol. 5, no. 4, pp. 598–605, 2010. [7] R. Pattison, “Safety System Design Optimisation,”PhD Thesis,
Lough-borough University, LoughLough-borough., 1999.
[8] J. Riauke and L. Bartlett, “Safety system design optimisation using a multi-objective genetic algorithm,”International Journal of Reliability and Safety, vol. 3, no. 4, pp. 397–412, 2009. [Online]. Available: http://hdl.handle.net/2134/5430
[9] J. D. Andrews and L. M. Bartlett, “A branching search approach to safety system design optimisation,”Reliability Engineering & System Safety, vol. 87, no. 1, pp. 23–30, 2005.
[10] Sharma, Jyoti and R. S. Singhal, “Comparative Research on Genetic Algorithm, Particle Swarm Optimization and Hybrid GA-PSO,” Inter-national Conference on Computing for Sustainable Global Develop-ment (INDIACom), vol. 2, pp. 110–114, 2015.
[11] R. Eberhart and J. Kennedy, “A new optimizer using particle swarm theory,”MHS’95. Proceedings of the Sixth International Symposium on Micro Machine and Human Science, pp. 39–43, 1995.