©IJRASET: All Rights are Reserved
449
Data Envelopment Analysis Recent Applications in
Banking Sector: A Survey
Reenu Kumari
Department of Applied Sciences, Maharaja Surajmal Institute of Technology, Delhi, India
Abstract: The present study review and surveys the number of research papers based on the applications of Data Envelopment Analysis (DEA) in the banking sector. This study focus on the development of DEA application only in the banking sector and includes the papers from 2016 to 2019, which published in reputed journals. Data envelopment analysis is one of the most effective and popular methods applied to measuring efficiency of banking sector. The author made a search for DEA application in banking industry related papers in Google Scholar database. The number of papers I get is rather impressive. I select the recent papers on DEA application.
Keywords: Data Envelopment Analysis, efficiency, performance, banking sector etc.
I. INTRODUCTION
The banking sector plays an important and critical role in the economic stability of any country.The service provided by banks in the form of personal saving,loans,payments,business etc. The main challenge in banking sector is the issue of managing and evaluating the performnce,which can be defined in terms of efficiency,profitability,productvity,compitition etc. Traditionally the bank productvity measured by single ratios, such as return to equity (ROE) or Cost-to-income ratio approaches.These traditional methods do not provide the reliable results because of complex environment og banking system. DEA models are effectively used to find the relative efficiency and performance of a set of Decision making units (DMUs).As we are aware of,a limited literature exist on the applications of DEA in real world problems.
The real world problems like Banking, transportation, education,health care sector,finance,agriculture & farm, tourism, Energy environment, sustainability, insurance, automobile, sport, manfacturing and many has been solved by DEA. Due to the existence of applications of DEA in large areas, I have selecting the research papers which focus only on the DEA application in the field of banking sector.
I have listed some standard and informative bibiliography already existing in the literature for more information and better understanding of how much research is going on the DEA and its appplication see [1,2,3,4,5].
The paper is organized as follows.Section 2 describes DEA models and some extended form of DEA models. Section 3 present
review of the papers published on the field DEA applicattions in banking sector.Section 4 present conlusion and references given in last section.
II. THE BASIC DEA AND EXTENDED MODELS
In this section, we discussed two primary models that play a significant role in DEA methodology development. To measure the performance of financial assets such as hospitals, business firms, educational institutions, government agencies etc. DEA models applied widely in the literature. In DEA models performance calculated in the form of ratio of Output and Input. There are two types of DEA models; one is CRS (constant return to scale) or CCR model and other is VRS (variable return to scale) or BCC model. CCR model proposed by Charnes, Cooper & Rhodes [6] and VRS proposed by Banker, Cooper & Charnes [7]. Both CCR and BCC models can be use in input-orientation and in output-orientation form. In input-oriented
Form DEA models try to attempt maximum possible reduction in input with output levels held constant and in output-oriented form DEA models try to attempt maximum possible
Proportional increase in output with input levels held constant.
A. CCR Model (Input Oriented)
Let there are n decision making units in the portfolio. Each DMU involve some amount of m different inputs to produce s different
outputs. The involve amount of input used by DMU and amount of output produced by DMU. Then
©IJRASET: All Rights are Reserved
450
= min (1.1)
. . ∑ − ≤0 , = 1,2 … . (1.2)
∑ ≥ , = 1,2 … . (1.3)
≥0 , = 1,2 … . (1.4)
Where represent the weight associated . Defines the DEA efficiency score for the DMUp. To obtain the score of
[image:2.612.159.455.184.374.2]relative efficiency of all DMUs, we have to solve above model n times. The DMU which attains the efficiency score 1, will be considered as efficient DMU and the DMU attains efficiency score less than 1,will be considered as inefficient DMU.
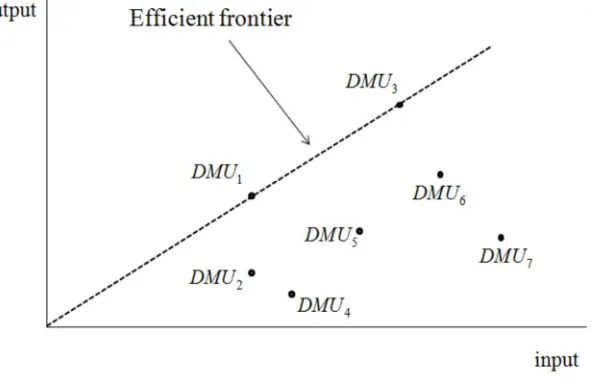
Figure 1: Efficient frontier - CCR model
In single input single output, case the efficient frontier for the CCR model in case of seven DMU given in fig.1.The figure 1 show
that are efficient.
B. CCR Model (Output- Oriented)
To derive CCR output oriented model, we minimize the inefficiency by the ratio of input to output. The mathematical formulation is as follows:
Model (2) = (2.1)
. . ∑ ≥ = 1,2 … . (2.2)
∑ ≤ = 1,2 … … (2.3)
≥0 = 1,2 … . (2.4)
C. BCC model (INPUT –Oriented Model)
BCC model is first extensions of the CCR model where the efficient frontiers set represent a convex curve passing through all
efficient DMUs. The basic difference between CCR and BCC models is the addition of convexity constraints ∑ = 1 in the
BCC model.
BCC model in input-oriented form given as in model (3): Model (3)
= min (3.1)
. . ∑ − ≤0 , = 1,2 … . (3.2)
∑ ≥ , = 1,2 … . (3.3)
∑ = 1, (3.4)
©IJRASET: All Rights are Reserved
451
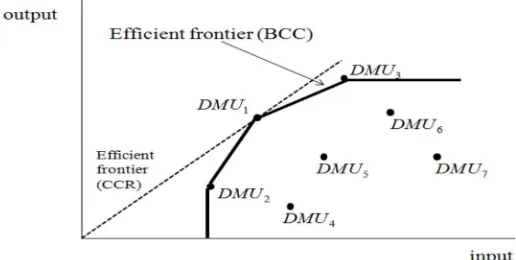
Figure 2: Efficient frontier – BCC model.
The figure 2 described the BCC efficient frontier for seven DMUs.
D. BCC Model (OUTPUT–Oriented Model)
BCC model in output-oriented form given in model (4):
Model (4) = (4.1)
. . ∑ ≥ = 1,2 … . (4.2)
∑ ≤ = 1,2 … … (4.3)
∑ = 1 (4.4) ≥0 = 1,2 … . (4.5)
E. Some Extensions in the DEA Models
There are several extensions exist to overcome some of the limitations of CCR and BCC models, such as the problem of presence of slack in the optimal solution ,the problems having negative input-output, the problem of not having clear information about input output etc.
Some well-known methods to deal with these limitations are slack-based measure (SBM) by Tone in 2001 [8], Range adjust
measure (RAM) by Cooper et.al. [9], Range directional measure (RDM) by Portela et.al. Semi-oriented radial measure (SORM) etc.
for more information on DEA models see [5].
III. DATA ENVELOPMENT ANALYSIS (DEA):RECENT APPLICATIONS
In this section we discuss beriefly the DEA applications in banking system in the recent time.We have selected most papers for study between the years 2016-2019 to make it more updated,useful and informative.The application of DEA and DEA based methods in banking sector is rather old but due to the effectiveness of the DEA methods it is continously increasing in recent times also.we have selected 40 papers from 2016,2017,2018,2019 for review.
A. DEA Applications Papers in Banking Sector Publish in Year 2016
1) Singh and Kaur [10] calculated the relative efficiency of public and private sector banks of India by applying DEA approach.
They also identify the slacks to locate the inefficiency of the banks. The main finding of the paper was that the efficiency of public banks is less than the efficiency of private sector banks. The results shows that the banks like HDFC, Federal bank, Yes bank and other private banks achieve 100% efficiency in all the observed ten years, but the public banks like United Bank of India, State Bank of Hyderabad, Central Bank of India etc. could not achieve 100% efficiency not in an observed single year.
2) Zha et.al. [11] Introduce a dynamic two-stage slacks-based measure model based on DEA to analyze of performance of
©IJRASET: All Rights are Reserved
452
3) Tuskan and Stojanovic [12] analyze and compare the efficiency of 28 European banks. They declare that the DEA are efficient
in identifying the poor business parts or strategies at very early stage that can create problems in the growth of the banks. They find the efficiency of banks by two approaches, one is DEA by taking expenses as input and income as output, the other is financial indicators approach such as Return on Assets - ROA, Return on Equity – ROE and Cost to Income Ratio – CIR. The main contribution of the paper was to find a relation between the efficiency measured by two approaches and they stablish that in post-transition countries have higher cost efficiency.
4) Wong and Deng [13] apply the DEA method to calculate the technical efficiency of 39 bank branches of four ASEAN countries
for the period 2000-2010. Malaysia, Indonesia, Philippines and Thailand were four countries and the efficiency of Malaysian banks is more than the efficiency of other three banks. They find that the ASEAN countries less cost efficient due to increasing operating and labor cost.
5) Wild [14] uses DEA and Stochastic Frontier analysis (SFA) to develop efficiency matrices. With the help of efficiency
matrices, they find the convergence of savings, commercial and cooperative banks in the Eurozone for the period 1999 – 2012.Wild found that the cooperative banks are only SFA convergence, efficiency for commercial banks, converges in both cases however, savings banks show no signs of convergence.
6) Wanke et.al. [15] Evaluate the overall efficiency of 13 Mozambicans banks for the period 2003-2011 by using Fuzzy-DEA α
-level based approach. The significant factors affecting the efficiency found as price of capital Price of labor, and market-share. They use production approach and intermediation approach to find input and output. Fuzziness found to be better than randomness in analyzing the estimated results. They estimate fuzzy efficiency score of each banks and then use conditional bootstrapped truncated regressions by taking efficiency score as dependent variables.
7) Branco et al. [16] use DEA-BCC (VRS) approach to estimate the efficiency of Brazilian banks in 2013.They estimate efficiency
scores based on capital origin, bank size, market niche, and rating and their study suggest that public banks are more efficient.
8) Ray [17] estimate the overall cost efficiency of branches of public sector banks in India.
9) He take data within the Calcutta city for the period 2012 and reported over branching in result by using DEA. The result of this
paper shows that in some areas if number of branches reduced in number it can give more cost efficient result as well as if the number of branches increased in number within market area also can be optimal (more cost efficient).
10) Fukuyama & Matousek [18] develop DEA two-stage network bank technology, in which all outputs of a bank’s first stage enter
into a second stage. They used data from regional banks of Japan for period 2001 to 2013.They also show how Regional Banks operated during the global financial crisis. The main finding of the paper is implementing the concept of Nerlove’s revenue indicator to the revenue inefficiency of Regional Banks.
11) Lozano [19], develop general networks slacks-based inefficiency (GNSBI) measure to measure the efficiency of the problems
that produces both desirable and undesirable outputs.
B. DEA Applications Papers in Banking Sector Publish in year 2017
1) Huang et al. [20] Introduce stochastic network model to evaluate technical efficiency of the Chinese banks for the period
2002-2015.they find that the technical efficiency of the joint-stock banks are higher than larger commercial banks which include four state-owned banks.
2) In [21], the authors study on the efficiency of Mauritian banks for the period 2011-2015 by using DEA .The authors conclude
that Mauritian banks should concentrate more on being efficient rather than on being only effective and profitable.
3) Hada et.al. [22], use DEA approach to make frontier of efficiencies TE (technical efficiency), PTE and SE (scale efficiency)
between Nepalese and Chinese commercial banks in 2012 and 2013 in input –oriented form. They examine the variation in the efficiency scores corresponding to change in input and output variables.
4) Puri and Yadav [23], develop DEA model in the condition of imprecise data and undesirable output. In this paper final
efficiency, score obtained as an interval bounded by the best lower bound efficiency and the best upper bound efficiency at that
α for each DMU and the method is valid for interval data, fuzzy data, and the mixture of interval and fuzzy data. The numerical data for the validity of the method has taken from Public Sector Banks and Private Sector Banks in India for the year2012– 2013.
5) Balcerzak et.al. [24], use CCR model in input and output orientation to evaluate and compare the efficiency of the banks in
©IJRASET: All Rights are Reserved
453
6) Tlig and Hamed [25], estimate the efficiency of Tunisian banks by using DEA in the case of imprecise data (fuzzy data).they
use fuzzy DEA by using two approaches, possibility and based on relations between fuzzy numbers (BRONF) approach. They evaluate the efficiency score of Tunisian banks for the period 2011-2013 by possibility and BRONF approaches.
7) Aggelopoulos & Georgopoulos [26] calculate the profit efficiency, branch management efficiency, and technical efficiency, of
Greece banks by using Bootstrap input oriented profit DEA. They form a bootstrap DEA-based Decision Tree to examine the potential upgrading of underperforming branches.
8) Moudud-Ul-Huq [27] apply DEA technique to find the performance of 10 private commercial banks (PCBs) from Bangladesh
banking industry for the period 2013–2014.they find that the performance of banks depend on the formulation of strategy and proper implementation of strategies. They suggest that the decision makers of Bangladesh banking industry should focus on the good quality of assets and proper use of it.
9) Silva et.al. [28], select a sample of Chinese local banks and study the efficiency of the selected banks by using DEA and SFA
(stochastic frontier approach).they also calculate the rank correlation which indicate that the models provide the efficiency of the banking system as a whole but can be ineffective at the individual level.
10) Gulati and Kumar [29], use two-stage network data envelopment analysis (NDEA) model to obtain intermediation, operational
and overall bank efficiency of the Indian banking industry. They also apply bootstrapped truncated regression to measure the variation in intermediation efficiency and suggest that the efficiency depend on the bank size, liquidity position, directed lending and intermediation cost.
C. DEA Applications Papers in Banking Sector Publish in year 2018
1) In 2018, Diallo [30] analyzed the effect of bank performance of industrial growth in the problem of financial crisis. The
efficiency, which obtained by DEA model highly related to crisis and affected highly the growth of the banks. Results also show that the efficiency relaxed the constraints of credit.
2) Quaranta et al. [31] use a multidimensional approach to measure the bank branch performance of 23 branches of an Italian
regional bank. They have used three-step approach. In step-one, the efficiency calculated by ratio method, in step-2, they use collinearity analysis to reduce the unnecessary information and in their step, three a clustering procedure applied to categorize the bank branch in to efficiency classes. They suggested that the multidimensional approach could be effective when individual methods provide contradictory results.
3) In [32], Authors, use DEA (CCR and BCC) models to evaluate the technical efficiency (TE), Pure Technical Efficiency (PTE)
and Scale Efficiency (SE) of 37 Brazilian banks for the period March 2012 - March 2016.They select input output variables using intermediation approach. They also focus on the how and what can done to make inefficient bank, an efficient one. For this purpose they analysis return to scale (RTS) of the banks. They conclude that the inefficiency of Brazilian banks depend on less on the technical and administrative issues and more depend to the scale of operations.
4) Grmanová and vanová [33] analyze the efficiency of Slovak Republic banks for the period 2009 and 2013. In the Slovak
national banking market the three largest bank were efficient in both years 2009 and 2013 with different combinations of inputs and outputs .They compare the relative efficiencies of the bank and provide the information regarding important indicators for the efficient bank in terms of efficiency sustainability.
5) Novickyt˙e & Droždz [34] study the Lithuanian banking sector’s efficiency by input oriented DEA under the VRS and the CRS assumptions in low investment environment. They compared validate the result obtained by the DEA method with the return on assets (ROA). They state that during the period 2012–2016 the efficiency of the larger Lithuanian banks (subsidiaries) was higher than smaller (local) banks operating in Lithuania. They discuss the performance of the banks along three dimensions as production, intermediation and profitability.
6) In [35] Goyel et al. apply directional distance based meta-frontier DEA approach to 66 Indian banks from the period
2015-2016.The results of this paper shows that Indian banking system is not fully efficient (only 73.44%).They confirmed that there exist different production functions according to different ownership structures such as Public, Private and Foreign. The group frontier of foreign banks coincides with meta-frontier; the second closest frontier is the frontier of the group private sector banks is the second closest to the meta-frontier.
7) Zhu and Zhang [36], calculate the operational efficiencies of banks of China and India in 2012 and 2013.they show variations in
©IJRASET: All Rights are Reserved
454
8) Kaffash et. al. [37], propose a new directional semi-oriented model (DSORM) by selecting a proper direction to deal positive
and negative input output variables. They claim the superiority of their method from the computational and target settings point of view. They take the sample from banks operating in Persian Gulf Council Countries (GCC) for the period 2002–2011 to show the practical application of the DSORM.
9) Toloo et. al. [38], present a new non-radial directional distance method to deal the cases when input and output not known.
They suggest two pessimistic and optimistic approaches to get appropriate decision for flexible measures. The proposed method applied to the sample collected from the banking system of the countries Czech Republic, Hungary, Poland, and Slovakia.
10) Pham et. al. [39], extend the slack-based directional distance function to evaluate the efficiency of the Vietnamese commercial
banks by considering undesirable output. They show the comparison of the results with directional distance function, the enhanced hyperbolic efficiency model and Farrell-type technical efficiency.
11) Basri et.al. [40], study the efficiency of 16 Islamic banks (IBs) from Malaysia from 2008 to 2015, using CRS and VRS DEA
methods. They measure the efficiency of each bank and draw a comparison between the efficiency of domestic and foreign IBs in the country. Domestic Islamic banks found more efficient than foreign Islamic banks, in the results.
D. DEA Applications Papers in Banking Sector Publish in year 2019
1) In [41] Peter et al. proposed two-stage DEA model to measure IT impact on performance of the large data set of 444 Ghanaian
bank branches. They use robust DEA package in R programming to handle the large data set of 444 DMUs. The result suggest that IT impact on the performance evaluation was positive and significant.
2) Ying et.al. [42] Propose a new method SBM (slack based model)-max and SBM min model based on Slack Based Model
(SBM) given by Tone (2001). The method apply to evaluate efficiencies of 37 Taiwanese banks for the period 2012 – 2016. In this paper, input was Number of employees, Deposits, Fixed assets and output as Deposits, Investments other income.
3) In [43] Kwateng et al. properly examine the effect of internet banking on the performance of 20 banks of Ghana in the year
2016.they use DEA-bootstrap method with cluster analysis and
4) principal component analysis. They found the positive effect of internet banking in the banking industry of Ghana. They
conclude that major banking strategies for improving the banks performance are integrated banking service strategy and the internet banking service-oriented strategy.
5) Tamatam et al. [44] evaluate three efficiencies (overall technical, pure technical and scale)
6) Of Indian banking sector for the year 2008-2017 by using 18 different DEA models. They select 17 private and 21 public sector
banks and compare the results using non-parametric statistical tests. They find that the efficiency calculated by different DEA models depend upon the ownership type and size of the banks.
7) Partovi et al. [45] use modified version of DEA, based on directional distance model to analyze the allocative and technical
efficiency of banks in Turkey for the period 2002-2017.
8) They use DEA in constant returns to scale form and assume Non-Performing Loans (NPLs) as an undesirable output. The result
show the negative effect of (NPLs) on the performance of Turkish banks.
9) Sharifa et.al. [46], provide a relation between the productivity and efficiency in financial sectors. They use DEA-MPI
(Malmquist Productivity Index) to estimate the efficiency and productivity of 26 financial companies selected from Malaysian stock exchange (Bursa Malaysia) for the period 2007-2016.
10) Belas et.al. [47], propose new cost efficiency model to find macroeconomic and specific variables that influenced the efficiency
of banks. They use data from the banks of 28 European Union countries like Austria, Germany, Denmark, and France etc. for the period 2008-2017.They states that banking sectors having different unit cost can be considered as efficient, but in new cost efficiency model, where the banking sector having high cost per unit cannot be considered as efficient.
11) In [48] the authors present a new directional output distance function based on directional distance function to evaluate the
economic efficiency. They states that the economic efficiency depend on the current year’s operation also the evaluation of risk depend on the minimization
12) Non-performing loans (NPLs) in the current loan. They provide the numerical illustration of the proposed method on the
sample of 30 Chinese banks for the period 2005-2012.
13) Ghaelia R [49], compare the relative efficiencies of five Canadian banks with 6 US big bank for 2017 year by using
©IJRASET: All Rights are Reserved
455
IV. CONCLUSION
In this survey paper, I try to give a brief discussion on the efficiency analysis of banking sector.
Most studies include in this paper used the DEA and extended methods of the DEA to measure the efficiency of banks in different countries and in different scenario’s. On the basis of existing literature, I draw the conclusion that the research on DEA methodology, its extension methodology and DEA applications not only in banks but also in different real life problems are flourishing all over the world. I hope that this study will benefit to some range of users who wish to apply DEA in banking and in other field also.
I acknowledge that some more important study on application of DEA in banking sector may not include here, due to due to limited space, and possibly to ignorance on my part.
REFERENCES
[1] Emrouznejad, A., Parker, B., & Tavares, G. (2008). “Evaluation of research efficiency and productivity: A survey and analysis of the first 30 years of scholarly literature in DEA”. Journal of Socio-Economics Planning Science, 42(3), 151–157.
[2] Adel H., Emrouznejad A.,b, Tavana M,.“A taxonomy and review of the fuzzy data envelopment analysis literature:Two decades in the making “.European Journal of Operational Research 214 (2011) 457–472.
[3] Emrouznejad, A.,Yang G.L. “A survey and analysis of the first 40 years of scholarly literature in DEA: 1978-2016” Socio-Economic Planning Sciences 61 (2018) 4-8.
[4] Cooper W.,Seiford M,Tone K,Zhu J, “Some models and measures for evaluating performances with DEA: past accomplishments and future prospects”. J Prod Anal (2007) 28:151-163 DOI 10.1 007/s 1 1 123-007-0056-4.
[5] Cook W, Seiford M, “Data envelopment analysis (DEA) – Thirty years on”. European Journal of Operational Research 192 (2009) 1–17.
[6] Charnes A., W. W. Cooper, and E. L. Rhodes, “Measuring the Efficiency of decision making units”, European Journal of Operational Research, vol. 2, pp. 429–444, 1978.
[7] Banker, R.D., Charnes, A., Cooper, W.W.,. “Some models for estimating technical and scale inefficiency in data envelopment analysis”. Management Science 30, 1078–1092 1984.
[8] Tone, K., “A slacks-based measure of efficiency in data envelopment analysis.” European Journal of Operational Research 130, 498–509, 2001.
[9] Cooper, W.W., Park, K., Pastor, J.T., “RAM: Range adjusted measure of inefficiency for use with additive models and relations to other models and measures in DEA. Journal of Productivity Analysis 11 (1), 5–42.199a.
[10] Singh RI, Kaur S: “Efficiency and profitability of public and private sector banks in India: data envelopment analysis approach”. IUP J Bank Manag. 15(1):50– 68 2016.
[11] Zha, Y., Liang, N., Wu, M., Bian, Y.:“Efficiency evaluation of banks in China: a dynamic two-stage slacks-based measure approach. Omega 60, 60–72 2016. [12] Tuskan B, Stojanovic A.,” Measurement of cost efficiency in the European banking industry. Croat Oper Res Rev 7(1):47–66 2016.
[13] Wong WP, Deng Q, “Efficiency analysis of banks in ASEAN countries. Benchmarking 23(7):1798–1817.”2016.
[14] Wild J, “Efficiency and risk convergence of Eurozone financial markets”. Research in International Business and Finance 36 (2016) 196–21, 2016.
[15] Wanke, P., Barros, C.P., Emrouznejad, A: “Assessing productive efficiency of banks using integrated Fuzzy-DEA and bootstrapping: a case of Mozambican banks.” Eur. J. Oper. Res. 249(1), 378–389 (2016).
[16] de Branco AMF, Junior APS, Cava PB, Carneiro, “Efficiency of the Brazilian banking system: an assessment using DEA under three approaches.” J Appl Fin Bank 6(4):27–42, 2016.
[17] Ray,S.: Cost efficiency in an Indian bank branch network: a centralized resource allocation model.Omega 65, 69–81 (2016). [18] Fukuyama H, Matousek R, “Modelling bank performance: a network DEA approach.” Eur J Oper Res 259:721–732, 2016.
[19] Lozano S., “Slacks-based inefficiency approach for general networks with bad outputs: An application to the banking sector”. Omega Volume 60,pp 73-84,2016.
[20] Huang, T.H., Lin, C.-I.,Chen, K.-C.: “Evaluating efficiencies of Chinese commercial banks in the context of stochastic multistage technologies”. Pac.-Basin Finance J. 41, 93–110 2017.
[21] Raghoober K, Babajee R B,Ramdhany N, Seetanah B, “An Analysis of the Efficiency of the Mauritian Banking Sector Using the Data Envelopment Analysis (DEA)”. Theoretical Economics Letters, 7, 1423-1430, 2017.
[22] Hada S.S.,Nan Zhu N, Tamang G, “Frontier Analysis of Nepalese and Chinese Commercial Banks: DEA Approach”. International Journal of Operational Research/Nepal - IJORN - 2017, Vol. 6, Issue 1.
[23] Puri J., Yadav S.P. “Improved DEA models in the presence of undesirable outputs and imprecise data: an application to banking industry in India”. International Journal of System Assurance Engineering and Management Volume 8, pp 1608–1629, 2017
[24] Balcerzak A, Kliestik T., Streimikiene D.,Smrčka L.,“Non-Parametric Approach to Measuring the Efficiency of Banking Sectors in European Union Countries”. Acta Polytechnica Hungarica Vol. 14, No. 7, 2017.
[25] Tlig H.,Hamed A., “Assessing the Efficiency of commercial Tunisian Banks using Fuzzy Data Envelopment Analysis”. Journal of Data Envelopment Analysis and Decision Science 2017 No. 2 (2017) 14-27.
[26] Aggelopoulos, E., Georgopoulos, A.: “Bank branch efficiency under environmental change: a bootstrap DEA on monthly profit and loss accounting statements of Greek retail branches.” Eur. J. Oper. Res. 261(3), 1170–1188 2017.
[27] Moudud-Ul-Huq S., “Performance of banking industry in Bangladesh: Insights of CAMEL rating”. International Journal of Financial Engineering Vol. 04, No. 02n03, 1750006 (2017)
©IJRASET: All Rights are Reserved
456
[29] Gulati, R. and Kumar, S. (2017), "Analyzing banks intermediation and operating efficiencies using the two-stage network DEA model", International Journal ofProductivity and Performance Management, Vol. 66 No. 4, pp. 500-516.
[30] Diallo, B.: “Bank efficiency and industry growth during financial crises”. Econ. Model. 68, 11–22 2018.
[31] Quaranta, A.G., Raffoni, A., Visani, F.: “A multidimensional approach to measuring bank branch efficiency”. Eur. J. Oper. Res. 266(2), 746–760 (2018. [32] Henriquesa,I., Sobreiroa,V.,Kimuraa,H., Marianob E.,“Efficiency in the Brazilian banking system using data envelopment analysis.” Future Business Journal 4
(2018) 157–178.
[33] Grmanová E., Ivanová E, “Efficiency of banks in Slovakia: Measuring by DEA models” Journal of International Studies, 11(1), 257-272, 2018. [34] Novickyt˙e L.,& Droždz J, “Measuring the Efficiency in the Lithuanian Banking Sector: The DEA Application”Int. J. Financial Stud. 2018, 6-37.
[35] Goyal J, Singh M,Singh R, Aggarwal A,“ Efficiency and technology gaps in Indian banking sector:Application of meta-frontier directional distance function DEA approach”The Journal of Finance and Data Science xx (2018) 1-17.
[36] Zhu,N.,Zhang H.,“A comparative analysis of operational efficiency between Chinese and Indian commercial banks”. Central European Review of Economics Management, Vol. 2, No. 3, 43-54, September 2018.
[37] Kaffash, S., Kazemi Matin, R. & Tajik, M. “A directional semi-oriented radial DEA measure: an application on financial stability and the efficiency of banks”. “Ann Oper Res (2018) 264: 213.
[38] Toloo M.,Allahyar M., JanaHančlová J.,“A non-radial directional distance method on classifying inputs and outputs in DEA: Application to banking industry”. Expert Systems with Applications Volume 92, February 2018, Pages 495-506.
[39] Pham, M.D. & Zelenyuk, V. “Slack-based directional distance function in the presence of bad outputs: theory and application to Vietnamese banking”. Empir Econ (2018) 54: 153.
[40] Basri,F.,Muhamat A.A., Jaafar N.,“The efficiency of Islamic banks in Malaysia: Based on DEAand Malmquist productivity index “.Journal of Emerging Economies & Islamic Research 6(3) 2018, 15 – 27.
[41] Peter A., Yaw M. M., and Ussiph N.“Evaluation of information technology impact on bank's performance: The Ghanaian experience, “International Journal of Engineering Business Management Volume 11: 1–10 2019.
[42] Ying L.Yung‑ho C., Tai‑Yu L.Yun Yuan H.“Market share and performance in Taiwanese banks: min/max SBM DEA.” TOP (2019) 27:233–252
https://doi.org/10.1007/s11750-019-00504-6
[43] Kwateng, K., Osei-Wusu, E.and Amanor, K. (2019), "Exploring the effect of online banking on bank performance using data envelopment analysis", Benchmarking an International Journal, September 2019.
[44] Tamatam, R., Dutta, P., Dutta, G. and Lessmann, S. (2019), "Efficiency analysis of Indian banking industry over the period 2008–2017 using data envelopment analysis", Benchmarking: An International Journal, Vol. 26 No. 8, pp. 2417-2442.
[45] Partovi, Elmira & Matousek, Roman, 2019. "Bank efficiency and non-performing loans: Evidence from Turkey," Research in International Business and Finance, Elsevier, vol. 48(C), pp. 287-309.
[46] Sharifa O.,Hasanb Z., Kurniasaric F,Hermawand A.,and Gunardid A.“Productivity and efficiency analysis using DEA: Evidence from financial companies Listed in Bursa Malaysia”. Management Science Letters 9 (2019) 301–312.
[47] Belas J., Kocisova K., Gavurova B.,“Determinants of Cost Efficiency: Evidence from Banking Sectors in EU Countries.” Acta Polytechnica Hungarica Vol. 16, No. 5, 2019.
[48] Boussemart J., Leleu H., Shenc Z., Michael Vardanyan M.,Zhu N.,“Decomposing banking performance into economic and credit risk Efficiencies”. European Journal of Operational Research 277 (2019) 719–726.
[49] Ghaelia R., “Measuring the relative efficiency of Canadian versus US banks”. Accounting 5 (2019) 121–126.
[50] Bhatia V.,Basu S., Kumar S.,Dash P.,“A review of bank efficiency and productivity” Operational Research Society of India 2018.