doi: 10.4236/jbise.2009.28087 Published Online December 2009 (http://www.SciRP.org/journal/jbise/).
Influence of sampling on face measuring system based on
composite structured light
Yang Shen1,2, Hai-Rong Zheng1,2*
1
Institute of Biomedical and Health Engineering, Shenzhen Institutes of Advanced Technology, Chinese Academy of Sciences, Shenzhen, China;
2
Key Laboratory of Biomedical Informatics and Health Engineering, Chinese Academy of Sciences, Shenzhen, China. Email: [email protected]
Received 7 August 2009; revised 4 September 2009; accepted 7 September 2009.
ABSTRACT
Human face can be rebuilt to a three-dimensional (3 D) digital profile based on an optical 3D sensing sys-tem named Composite Fourier-Transform Profilo-metry (CFTP) where a composite structured light will be used. To study the sampling effect during the digitization process in practical CFTP, the pectinate function and convolution theorem were introduced to discuss the potential phase errors caused by sampling the composite pattern along two orthogonal direc-tions. The selecting criterions of sampling frequencies are derived and the results indicate that to avoid spectral aliasing, the sampling frequency along the phrase variation direction must be at least four times as the baseband and along the orthogonal direction it must be at least three times as the larger frequency of the two carrier frequencies. The practical experiment of a model face reconstruction verified the theories. Keywords: Optical 3D Sensing; Composite Structured Light; Sampling; Spectral Aliasing
1. INTRODUCTION
Structured-light illumination is commonly used as an active optical 3D sensing technique for automated in-spection and measuring surface topologies. The Fourier- Transform Profilometry (FTP) [1,2] is one of the classi-cal 3D acquisition methods and it has been widely inves-tigated [3,4,5] because of its advantages of obtaining data from only one frame and analyzing spectrum in whole-field as well as high resolution. Recently, an im-proved FTP method called Composite Fourier-Transform Profilometry (CFTP) was introduced [6,7]. This novel method prevents spectral aliasing between zero-frequen- cy and baseband by using only one grating namely Com- posite Pattern (CP) that generated by integrating multi-frame ordinary patterns, so that it allows for real-time implementations [8].
However, the data in both CFTP and FTP are digitally
sampled to discrete signals during the digitization proc-ess in practice. The discrete images have periodical Fou-rier spectrum, and the fundamental spectrum including the useful information would be overlapped by the adja-cent periodical weight [9]. Furthermore, the CP in CFTP is much more complexity than traditional sine grating, another kind of spectrum aliasing would be brought in. In this instance, choosing a proper sampling frequency is very important for the precise survey.
To study the influence caused by sampling, the know- ledge of pectinate function and convolution theorem was employed in this article and the suggestion that how to select proper sampling frequencies was given. The ex periment verified the theories, and a beautiful 3D digital profile of a model face was acquired.
2. METHODS
2.1. CFTP Theory
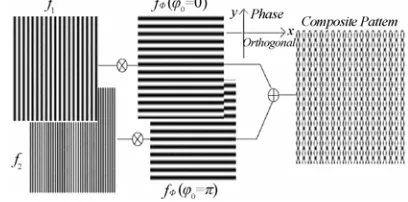
A Composite Pattern (CP) in CFTP is generated as shown in Figure 1. The multiframe sine patterns to be modulated are as follows.
cos(2 )
n
G c f y n
(1) where a constant is used to offset to be non-nega-tive values, and
c Gn
[image:1.595.320.524.572.673.2]f is the baseband, y represents the
Figure 1. A composite pattern formed by simple strips.
depth distortion (i.e., phase dimension) direction, re- presents the phase-shift index from 0 to 1. These signal
patterns are multiplied with different carrier frequencies respectively along the orthogonal direction. Accumulate all channels such that
1 2 ( , ) {[ cos(2 )] cos(2 ) [ cos(2 )] cos(2 )}
I x y a b c f y f x
c f y f x
(2)
where f1 and f2 are carrier frequencies along the orthogonal direction x, and the projection constants and are used to make sure the projection intensity of CP falls into the range of
a b
( , )
I x y [6,7]. Ideally, the reflected image of the specimen surface can be counted as follows
1 2 ( , ) ( , ) ( , ){
[ cos(2 ( , ))]cos(2 ) [ cos(2 ( , ) )]cos(2 )}
P x y ar x y br x y
c f y x y f x
c f y x y f
x
(3)
where r x y( , ) and ( , )x y represent the albedo ra-diation and distorted phase respectively. By means of 2D Fourier-transform and predigestion, the expression (3) will be translated into (4) shown as follows, where
( ,
F ), A( , ), B( , ) and ( , ) represent the two-dimension Fourier spectrum of P x y( , ) ,
, and
( ,
ar x y) bcr( ,x y) 1 2br x( ,
}
) exp[
y j( , )]x y
re-spectively.
1 1 1
1 1 1
2 2 2
2 2 2
( , ) ( , ) (1 / 2){
[ ( , ) ( , ) * ( , )]
[ ( , ) ( , ) * ( , )]
[ ( , ) ( , ) * ( , )]
[ ( , ) ( , ) * ( , )]
F A
B f f f f f
B f f f f f
B f f f f f
B f f f f f
(4)
Expression (4) suggests that the two carrier frequen-cies are evenly distributed and are separated by spectral frequency of background reflectance. Therefore, a smooth and flat background had better be selected to minimize the influence to the carrier spectrums. The distorted im-age is processed as a set of 1-D signal vectors by band-pass filters to separate out each channel. Cutoff frequencies of each band represent the individual pat-terns like that in traditional Phase Shift FTP and are used to retrieve the depth of the measured object based on the traditional Phase Shift FTP method [7] as follows:
0 ( , ) ( , ) / 2
h x y x y L f d (5) where and are experimental setup parameters,
represents the reconstructed height. d
)
0 L ( ,
h x y
2.2. Influence of Sampling on CFTP
Expression (3) indicates the continuous image, but in practical experiment it will be digitally sampled to dis-crete signals by projector and camera, and the disdis-crete distorted pattern S x y( , ) is captured as
( , ) ( , ) ( / , / )
( , ) ( / ) ( / )
S x y P x y comb x x y y
P x y comb x x comb y y
(6)
where comb x( /x y, /y) is Pectinate Function, x and are sampling spacing along phase direction and orthogonal direction respectively so that
y
1 /
x
f x and represent the sampling frequency along
the two directions respectively. Here suppose
1 /
y
f y
1 21 /
1 / ( max{ , })
y x
f y mf
f x nf f f f
(7)
where and are multiple units, respectively represents the multiple relationship between sampling frequency and the selected experimental setup frequen-cies along the two orthogonal axes, and both them are positive numbers. These two introduced parameters en-able us to calculate the proper sampling frequencies based on the known baseband and carrier frequencies, and the selecting criterions of sampling frequencies are determined as long as and n are definitely.
m n
m
Eq.4 shows that besides the frequency of background reflectance (i.e. A( , ) ), there are four peak values along the orthogonal direction, namely f1, 2f ; in each peak there are three peak spectrums along the phase direction, namely 0, f. To simplify the investigation, we will discuss the sampling effects along the two orthogonal directions respectively.
2.2.1. Sampling Analysis along Phase Direction Any a peak value of
was selected, e.g. f1, there are three peak spectrums in the channel along the phase direction:1 1 1 1
( , ) ( , ) ( , ) * ( , )
F f B f f f f f (8)
1 1 * 1 1 1 ( , ) ( , ) | | ( ) [ ( , ) ( , ) * ( , ) ] s N
F f F f y comb y
B f Nmf
f f Nmf
f f Nmf
(9)where is the convolution operator and is integer. Eq.9 indicates that the spectrums of
* N
1 ( ,
F f ) repeat periodically. To against the overlapping of spectrums, we must make sure is separated from * in the same period, and also make sure ( *) is separated from
* ( )
comes from the adjacent periods, in another word, the sampling frequency is restricted, there must be at least four sampling dots in one period [9] so that
4 , or 4
y
f mf f m (10)
2.2.2. Sampling Analysis along the Orthogonal Direction
Any a peak value of was selected to study the cor-responding four peak spectrums of along the or-thogonal direction, e.g. f:
2 1 ( , ) ( , ) ( , ) ( , ) ( , ) 1 2
F f f f f f
f f f
f
(11)
Here suppose f2f1
comb
. Consider expression (7) and Pectinate Function along the orthogonal direction, the discrete spectrums of
( /x x)
( , )
F f can be calculated as (12):
*
2 2 1 2
1 2 2 2
( , ) ( , ) | | ( )
[ ( , ) ( , )
( , ) ( , ) ]
s
N
F f F f x comb x
f Nnf f f Nnf f
f Nnf f f Nnf f
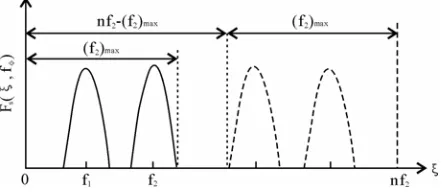
(12)Expression (12) indicates that the spectrums of ( , )
F f repeat periodically with period of . As shown in Figure 2, the real lines represent the starboard of
2
nf
( , )
F f , and the dashed represent the larboard spectrums of the adjoining period.
Figure 2 indicates that to escape the overlapping of spectrums, there must be have
1 max 2 min 2 max 2 2 max( ) ( )
( ) ( )
f f
f nf f
(13)
Imitating the definition of instantaneous frequency in domain of signal processing [5], we get
1 max 1 max
2 min 2 max
2 max 2 max
( ) (1 / 2 ) | / |
( ) (1 / 2 ) | / |
( ) (1 / 2 ) | / |
f f x
f f x
f f x
(14)
Eq.13can be modified by (5) and (14) such that
Figure 2.Replicated spectrum distribution.
max 2 1 0max 2 0
| / | ( )( / 2 )
| / | ( 2) ( / 2 )
h x f f L f d
h x n f L f d
(15)
According to (15), we can get
2 1
2
(
) /
n
f
f
f
21
(16)
If the condition f22f is selected in survey, there must be n3, so there has fxnf23f2.
2.3. Experiment
[image:3.595.62.283.604.702.2]To support the analysis above, a model face was used as a tentative test. The projector used was a Panasonic (PT- P2500) digital projector with resolution of 1024×768. The image sensor used was a low-aberrance color CCD camera (Prosilica, EC1350C, made in Canada) with resolution of 1360×1024 and pixel size of 4.65um× 1.65um, and the maximum frame rate is 18fps. The fo-cus of the camera lens (KOWA, LM12JCM, made in Japan) was 12mm. The image board was a 1394 card (KEC, 1582T, made in Taiwan). The reference plane as background was a piece of smooth and white board. Figure 3illustrates the experimental setup, in which the geometric parameters were set as =73mm and
=18mm, and the carrier frequencies 0
L
d f1 and f2
Figure 3. The diagram of the experimental setup.
the optimal angle value [4,5]. Because the specimen was a model face, the gesture and expression could be with-out consideration, however, with regard to a real human face, eyes exposure and shadows caused by gesture must be considered carefully.
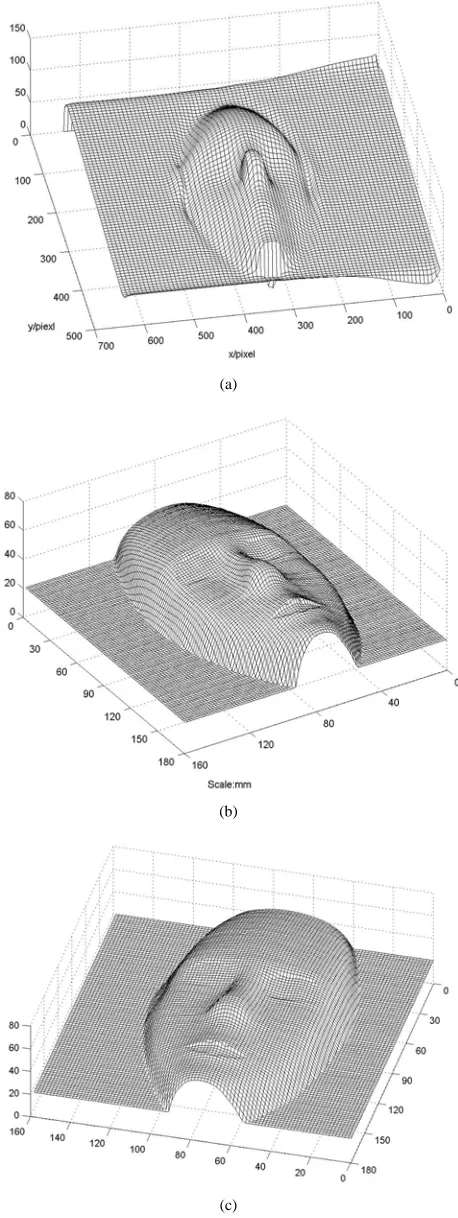
According to the analysis above, to avoid spectral aliasing, there must be have and . Figure 4 shows the captured distortion composite pattern.Figure 5 indicates the reconstructed profile. From the drawings, we can find that when sampling frequencies do not sat-isfy the sampling request, i.e. (a) when
4
m n3
m3 and , the rebuilt errors were big and the details of face were lost. However, when and , the de-tails could be retrieved as shown in (b) and (c) with good resolution.
2 n
4
m n3
3. DISCUSSION
The accurate acquisition of 3D human face appearance characteristics is very important for designing a facial contouring surgery, and a good work is based on an ex-act 3-D face modeling [10]. People hope to find a non- ontact, rapid, precise way to acquire 3-D digital face depth, and then based on it to simulate and design an optimal plan for face surgery by modem technologies such as computer aided design etc [11].
Figure 4. The captured distortion composite pat-tern modulated by height of the face model.
(a)
(b)
(c)
[image:4.595.310.539.83.692.2] [image:4.595.97.247.541.696.2]At present, there are about three types of 3D face modeling method to extract human face profile: one is the method based on computer tomography (CT) tech-nology [12,13,14] and another one is based on passive optical 3D sensing technique [15,16,17] and the other is based on active optical 3D sensing technique [18,19,20].
The 3D reconstruction method based on CT technol-ogy is sensitively to skeleton and is convenient to be used for craniofacial plastics and oral and maxillofacial correction of abnormality and such fields, however, 3D profile of soft tissue is difficult to rebuilt by CT tech-nology, especially the human face surface features.
The passive optical 3D sensing technique such as ste-reo vision uses two or more camera systems to capture the scene in ambient light from different viewpoints and to determine the height by matching image features of the corresponding surface features. In this method, a lot of factors need to be noticed, such as ambient light, background, vision angle and face gesture, expression and shading and so on, for they would influence the measuring accuracy directly. Besides, there always need to process a mass of data operation like correlation analysis and matching operation etc. Generally, the pas-sive optical 3D sensing technique is more often used for 3D object recognition and understanding. Along with the development of computing technique, arithmetic speed is no longer a key limiting factor, and the passive optical 3D sensing technique is widely used in the field of ma-chine vision.
The active optical 3D sensing technique employs structured light to illuminate the specimen. The time or space in structured light will be modulated by height, and then the 3D information can be extracted from the observation light by certain unwrapping algorithm [5]. For its feature of non-contact, high resolution and highly automated, the active optical 3D sensing technique is used in most 3D sensing systems with the purpose of 3D surface-shape measurement.
Phase Measuring Profilometry (PMP) is one important method of active optical 3D sensing technique [5]. In PMP, sinusoidal fringes and phase shifting technique are employed to acquire the height information that we wanted. A flaw of PMP is that it has to capture at least three continuous modulated phase shifting fringes cor-responding to a static profile and therefore there will be some trouble for real-time dynamic measurement, and during the shooting process a little movement or facial expression changes of the target human face will poten-tially bring errors to the demodulated results. By using fast digital grating projection approach, a series of phase shifting fringes can be projected and shot within a short span of time. However, the images photographed by CCD camera would easily cause drawbacks such as trailing and distortion etc. due to rapid rotation of the phase shifting fringes, and then the inaccuracy of meas-urement will be raised. A one-shot technique, therefore,
becomes a trend [19,20].
Here a novel one-shot approach for 3D human face profile measurement is introduced. A composite pattern (CP) is used in place of the series phase shifting fringes in PMP, and only a single frame of CP is needed to pro-ject and capture. The CP efficiently combines some phase shifting fringes and the same number of carrier gratings, and so that the phase shifting technique can be also utilized in this approach. This one-shot technique can avoid some unwanted troubles such as trailing and distortion etc. that happened in PMP for needing only one projection and corresponding one capture. Based on the proposed approach, 3D digital model of real human face could be acquired more conveniently and exactly.
Here we used this novel method to reconstruct a model face and acquired a good stereogram under the proper sampling frequencies which were the focus of our investigation. Because of the complexity of the compos-ite pattern, another kind of spectrum overlapping would be brought in by the two modulating gratings during the digitization process. In this instance, choosing a proper sampling frequency is very important for the precise reconstruction. In the paper we discussed the sampling conditions along two directions and pointed out the rules, and then under the given sampling conditions we ac-quired a perfect digital 3D face profile.
4. CONCLUSIONS
Composite Fourier Transform Profilometry (CFTP) is an improved FTP method where a composite structured light is employed. To study the influence caused by sampling, the knowledge of pectinate function and con-volution theorem was used and the suggestion that how to select proper sampling frequencies was given, that is, the sampling frequency along the phrase variation direc-tion must be at least four times as the baseband and along the orthogonal direction it must be at least three times as the larger frequency of the two carrier frequen-cies.
5. ACKNOWLEDGEMENMTS
This study was supported by the National 973 Basic Research Program of China (No. 2010CB732600).
REFERENCES
[1] M. TAKEDA, K. MUTOH. (1983) Fourier transform profilometry for the automatic measurement 3-D object shapes. Appl. Opt., 24, 3977–3982.
[2] M. Takeda, H. Ina. (1982) Fourier-transform method of fringe-pattern analysis for computer-based topography and interferometry. J. Opt. Soc. Am, 1, 156–160. [3] S. Fu, Y. S. Wang, G. B. Han. (2004) Fourier transform
profilometry in 3-D measurement based on wavelet digital Filter. J.Optoelectronics·Laser, 2, 205–207. [4] W. J. Chen, X. Y. Su. (2000) Discussion on phase
Sinica, 10, 1429–1433.
[5] X. Y. Su, J. T. Li. (1999) Information Optics. Publish House of Science, Beijing, 332–335 (in Chinese). [6] C. Guan, L. G. Hassebrook. (2003) Composite
struc-tured light pattern for three-dimensional video. Optics Express, 5, 406–417.
[7] H. M. Yue, X. Y. Su. (2005) Improved fast fourier transform profilometry based on composite grating. Acta Optica Sinica, 6, 767–770.
[8] Y. S. Xiao, X. Y. Su, Q. C. Zhang. (2006) 3-D surface shape restoration for the breaking surface of dynamic process. Laser Technology, 3, 258–261.
[9] H. Yang, W. J. Chen. (1999) Influence of Sampling on Fourier-Transform Profilometry. Acta Optica Sinica, 7, 929–934.
[10] G. L. Murrell, N. K. McIntyre, and B Trotter. (2003) Facial contouring. Facial Plast Surg Clin North Am, 3, 391–397.
[11] R. Schmelzeisen and A. Schramm. (2003) Computer- assisted reconstruction of the facial skeleton. Arch Fa-cial Plast Surg, 5, 437–440.
[12] S. Prakoonwit, and R. Benjamin. (2007) Optimal 3D surface reconstruction from a small number of conven-tional 2D X-ray images. Journal of X-Ray Science and Technology, 4, 197–222.
[13] M. Deling, W. Biao, F. Peng, and Y. Fuguang. (2007) Oral Implant Orientation of 3-D Imaging Based on X-Ray Computed Tomography (CT). Asian J. Inform. Techno, 11, 1143–1147.
[14] Mahfouz, Badawi, A. Fatah, Kuhn, and Merkl. (2006) Reconstruction of 3D patient-specific bone models from biplanar xray images utilizing morphometric measurements. Proceedings of the 2006 International Conference on Image Processing, Computer Vision, and Pattern Recognition, 345–349.
[15] C. Zhang, F. S. Cohen, and H. RVSI. (2002) 3-D face structure extraction and recognition from images using 3-D morphing and distance mapping. IEEE Transac-tions on Image Processing, 11, 1249–1259.
[16] H. Hirschmuller, P. R. Innocent, and J. Garibaldi. (2002) Real-time correlation-based stereo vision with reduced border errors. Int. J. Comput. Vis., 1/2/3, 229–246. [17] S. Huq, B Abidi, A. Goshtasby, and M. A. Abidi. (2004)
Stereo matching with energy-minimizing snake grid for 3D face modeling. Proceedings of SPIE, 5404, pp. 339–350.
[18] M. Takeda and K. Mutoh. (1983) Fourier transform profilometry for the automatic measurement 3-D object shapes. Appl. Opt., 24, 3977–3982.
[19] H. M. Yue, X. Y. Su, and Z. R. Li. (2005) Improved fast fourier transform profilometry based on composite grating. Acta Optica Sinica, 6, 767–770.