Common Physical Framework Explains Phase Behavior and Dynamics of Atomic,
Molecular, and Polymeric Network Formers
Stephen Whitelam,1,*Isaac Tamblyn,2,† Thomas K. Haxton,1 Maria B. Wieland,3 Neil R. Champness,4 Juan P. Garrahan,3 and Peter H. Beton3,‡
1Molecular Foundry, Lawrence Berkeley National Laboratory, 1 Cyclotron Road, Berkeley, California 94720, USA
2Department of Physics, University of Ontario Institute of Technology, Oshawa, Ontario L1H 7K4, Canada
3School of Physics and Astronomy, University of Nottingham, Nottingham NG7 2RD, United Kingdom 4
School of Chemistry, University of Nottingham, Nottingham NG7 2RD, United Kingdom (Received 12 November 2013; revised manuscript received 3 February 2014; published 21 March 2014)
We show that the self-assembly of a diverse collection of building blocks can be understood within a common physical framework. These building blocks, which form periodic honeycomb networks and nonperiodic variants thereof, range in size from atoms to micron-scale polymers and interact through mechanisms as different as hydrogen bonds and covalent forces. A combination of statistical mechanics and quantum mechanics shows that one can capture the physics that governs the assembly of these networks by resolving only the geometry and strength of building-block interactions. The resulting framework reproduces a broad range of phenomena seen experimentally, including periodic and nonperiodic networks in thermal equilibrium, and nonperiodic supercooled and glassy networks away from equilibrium. Our results show how simple“design criteria”control the assembly of a wide variety of networks and suggest that kinetic trapping can be a useful way of making functional assemblies.
DOI:10.1103/PhysRevX.4.011044 Subject Areas: Interdisciplinary Physics, Soft Matter, Statistical Physics
I. INTRODUCTION
Molecular self-assembly is a promising strategy for making useful materials and has already produced many remarkable structures in the laboratory [1,2]. But it remains largely an empirical science, in the sense that we do not know in advance which components and which conditions will give rise to successful assembly. If we could go beyond empiricism, by identifying the physical concepts and rules that underpin molecular self-assembly, then presumably we could build materials with function-alities approaching those of biological materials. The pursuit of the underlying physical principles of self-assembly motivates a large body of theoretical work— Refs.[3–5]being three examples—and is the motivation for this paper.
Here, we take the view that in pursuit of the physical principles that underpin self-assembly, there is value in identifying physical mechanisms common to apparently
unlike systems. We shall show that the self-assembly of a diverse collection of building blocks, one example of which comes from our own work, can indeed be understood within a common physical framework. These building blocks range in size from atoms to micron-scale polymers made of DNA, and interact through mechanisms as differ-ent as hydrogen bonds and covaldiffer-ent forces. We show that in a qualitative sense, the self-assembly of these building blocks, which results in a range of phenomena that include periodic and nonperiodic networks in thermal equilibrium, and nonperiodic supercooled and glassy networks away from equilibrium, can be reproduced by a statistical mechanical“patchy-particle”simulation model. The model accounts only for the geometry and strength of building-block interactions, indicating that these two physical factors control the assembly of the real networks. Furthermore, we use quantum mechanics and analytic statistical mechanics techniques to show why we think this control exists: The thermodynamics of association of model building blocks and real building blocks into isolated polygons, which one might regard as the basic constituents of self-assembled networks, is in a qualitative sense the same. This similarity reveals that the model, despite containing none of the molecular or chemical detail of the real systems, nonetheless captures a key microscopic physical feature of the self-assembly of these systems and explains why—or at least suggests why we should not be *[email protected]
surprised when—the model and real building blocks, under-going Brownian motion, give rise to similar equilibrium and dynamic phenomena.
In what follows, we introduce the set of experimental examples we will focus on (Sec. II). We do a quantum mechanical (density-functional theory, or DFT) analysis of one of these examples (Sec.III) to calculate the free-energy cost of arranging molecules into isolated polygons. This calculation allows us to show that the experimental network is trapped far from equilibrium, but it also quantifies a key microscopic feature of this system, namely,
[image:2.612.68.542.195.544.2]the thermodynamics of association of molecules into the basic polygon constituents of the network. We then introduce (Sec.IV) a statistical mechanical patchy-particle model able to form networks. We show within a simple analytic approximation that the thermodynamics of asso-ciation of model particles into polygons is similar to that of the real system studied in Sec.III. This similarity then provides a partial explanation for why equilibrium (Sec.V) and dynamic (Sec.VI) simulations of the model reproduce the range of behavior seen experimentally. We conclude in Sec.VII.
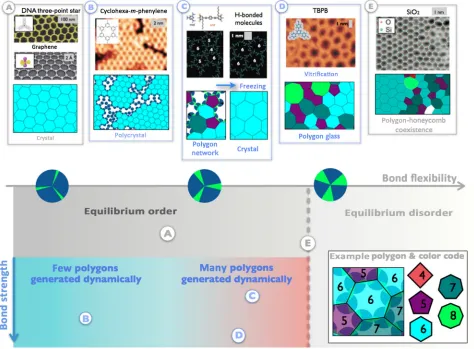
FIG. 1. Spanning a length scale of 3 orders of magnitude, the networks formed by a diverse collection of building blocks can be reproduced in simulation by accounting only for the geometry and strength of building-block interactions. Threefold-coordinated building blocks can, in equilibrium, form (A) the periodic honeycomb network [6,7] or (E) a nonperiodic polygon network[8]. Dynamically, they can self-assemble as (B) honeycomb polycrystals[9], (C) a polygon network that evolves to the honeycomb[10], or (D) a kinetically trapped polygon-network glass. Model building blocks whose interactions (parametrized by strengthϵand flexibility
In isolation, each of the techniques we have used in this paper—self-assembly experiments, DFT calculations of assembled molecules, analytic statistical mechanical treatments of networks, and equilibrium and dynamic simulations of patchy-particle models—has been used extensively by other authors; references are given in the text. The focus of this paper is not the use of these methods individually but the chain of connections we have drawn between experiment, the quantum mechanics of molecular interactions, and the behavior of a statistical mechanical model. We have therefore chosen to consign much of the technical detail of the individual methods to Appendixes, referenced from the relevant section of text, and have focused the narrative on developing this chain of con-nections. Our hope is that by doing so, we have written a paper that appeals to a broad readership, particularly those who are not expert with one or another of the techniques we have used.
II. SELF-ASSEMBLY ACROSS SCALES Let us now introduce the experimental examples on which we will focus. Panels A–E of Fig. 1 summarize a range of phase behavior and dynamics exhibited by a diverse collection of building blocks. These building blocks self-assemble into planar networks by making three pair-wise bonds. When bonds are distributed regularly around the building block, the network formed is the periodic honeycomb: Consider carbon atoms [6] or a DNA star polymer[7] (panel A), as well as a host of other systems
[11]. Threefold coordination also permits the formation of nonperiodic variants of the honeycomb. Zachariasen showed in a sketch in 1932 [12] that irregular threefold coordination results in a network of polygons of different sizes. Such a network is seen in the case of silica [8]
(panel E) on a surface. Furthermore, a range of dynamics is associated with network self-assembly. The coval-ently associating molecule cyclohexa-m-phenylene forms
polycrystals, sections of honeycomb network punctuated by grain boundaries [9] (panel B). Certain hydrogen-bonding molecules self-assemble initially as a nonperiodic polygon network that subsequently relaxes to the honey-comb [10] (panel C). A distinct dynamics is seen in the case of the trigonal molecule tris(4-bromophenyl)benzene (TBPB) [13] (panel D): This molecule forms a polygon network that does not evolve to the honeycomb. Preparation of this network is described in AppendixA.
III. MICROSCOPIC UNDERPINNING OF ONE PARTICULAR EXPERIMENT
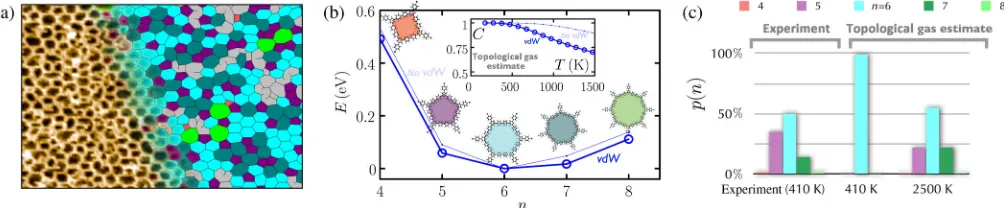
[image:3.612.56.558.525.629.2]The spectrum of behavior seen within this class of building blocks can be reproduced within a simple physical framework that resolves only coarse details of the geometry and energetics of building-block interactions (Fig. 1, simulation snapshots and lower panel). This framework is inspired by resolving, for the particular case of TBPB, the collective microscopic mechanisms that determine the basic polygon units of the network. In Fig. 2(a), we show a portion of the polygon network generated during TBPB self-assembly at 410 K on a gold surface (see the Supplemental Material[14]). As described in Appendix B, we use DFT, using functionals with (vdW-DF2 [15]) and without (B3LYP [16,17]) van der Waals interactions, to calculate the relative energy cost, per molecule, for arranging molecules into isolated, regular n-gons. These n-gons approximate the basic elements of the network. This energy cost captures the essence of the thermodynamics of molecules’ polygon-forming tenden-cies [18,19]. It is shown in Fig. 2(b). Three features are apparent: Molecules favor the hexagon, whose geometry is commensurate with the symmetry of the molecule; mole-cules may form other polygons, at an energy cost on a scale approaching eV (calculations done on interacting loops give similar numbers; see Appendix B); and the shape of the potential is not symmetric in n, as is sometimes assumed in idealized foam models[20].
Simple estimates based on the energy cost of forming isolated polygons of TBPB molecules suggest that the experimental network is trapped far from equilibrium. To a first approximation, we see that the energy cost to turn a pair of hexagons into a heptagon and a pentagon is of order eV=2, indicating that in equilibrium at experimental tem-peratures, the network should be a tiling of hexagons with characteristic linear distance between defects of order microns. As seen in Fig.2(a), this is not the case. At one further level of refinement, a“topological-gas”calculation
[20] (see Appendix C), a mean-field thermodynamic estimate that assumes the network to be composed of isolated polygons whose average size is 6, indicates that the network in thermal equilibrium should be the honeycomb up to a temperature of at least 500 K [Fig.2(c)]. We there-fore conclude that the polygon network seen in experiments is probably a nonequilibrium, glassy one. (At this level of approximation, we are not considering irregular polygons or interactions between polygons, and so we cannot prove conclusively that the network seen is a nonequilibrium one.) Note that the inclusion of van der Waals forces in our DFT calculations changes considerably our numerical estimate of the network-ordering temperature, but not this qualitative conclusion [inset to Fig.2(b)].
IV. A STATISTICAL MECHANICAL MODEL OF NETWORK FORMATION
Motivated by our microscopic insight into this particu-lar system, and by the ability of coarse-grained models to capture key physical features of complicated systems
[3,5,21–25], we next build a simple physical model of interacting“building blocks”in an attempt to capture the essence of TBPB’s self-assembly. The model accounts only for the geometry and strength of interactions between building blocks and pays no attention to the atomic or chemical detail through which these features arise in the real system. Although our original focus was TBPB, we find that by varying two parameters of the model— binding strength and flexibility—we can reproduce the behavior of all the systems described in Fig. 1. This finding suggests that the same two factors control the self-assembly of those systems, independent of their molecular details.
Following work on“patchy-particle”simulation models
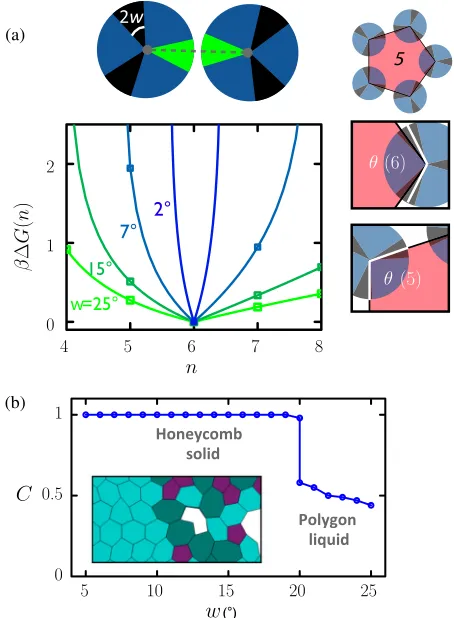
[26–29], we consider striped disks living on a smooth, two-dimensional substrate [Fig.3(a)]. Three stripes, each of angular width 2w, are placed regularly around the disk. Disks bind in a pairwise fashion, stripe to stripe[30], with energy of interaction −ϵ. Full details of the interaction potential are described in AppendixD. In figures in which discs are shown, stripes are green when bound in this fashion. The parameterwdetermines the flexibility of disk interactions: The broader the stripe (the larger isw), the less precisely need two disks align in order to bind.
[image:4.612.323.550.48.357.2]βΔGðnÞ ¼−ln½z1ðnÞ=z1ð6Þ; (1)
where z1ðnÞ≡maxð0;2w−πjn−6j=3nÞ is the angle a disk can rotate without its stripes breaking contact with either of its two neighbors. Equation(1)is plotted in Fig.3(a). This rotational entropy is largest for the hexagon because disks may rotate the full angular width of the stripe without breaking energetic contact. In other polygons, bound disks have less rotational freedom [as can be seen by looking at sketches of, e.g., the pentagon vertex shown next to the free-energy plot in Fig.3(a)], and so the free energy per disk is larger than in the hexagon. Rotational entropy therefore favors network order[31]. The microscopic origin of this thermodynamics (rotational entropy) is therefore different than for the TBPB molecules of Fig.2(the energy cost of irregular bond angles). Despite this microscopic difference, the essence of both systems’polygon-forming tendencies is the same: They favor hexagons, and they can achieve, with some free-energy cost, other polygons. Within the model, this cost is controlled by w, the binding flexibility. This similarity suggests that the model, although simple, captures the physics essential to TBPB polygon formation and, by extension, network formation (because polygons are the key constituent of the latter).
Note that the strategy of considering the free-energy cost of arranging building blocks into important micro-scopic elements of a larger structure was used with success in Ref. [31] [compare Fig. 2(b) of that paper with our Fig. 3(a)]: Here, the same strategy allows us to compare model building blocks and real molecules in order to develop the connection between the two.
V. MODEL REPRODUCES THERMODYNAMICS SEEN IN DIFFERENT EXPERIMENTS
The similarity of model building blocks and TBPB molecules with respect to their thermodynamics of polygon formation leads to similar behavior in the nonequilibrium regime in which TBPB is prepared; this similarity is described below. Moreover, by varying model parameters controlling building-block binding flexibility (w) and strength (ϵ), the model also reproduces the behavior of the other systems shown in Fig.1. Thermodynamically, a mean-field topological-gas estimate applied to the model (details given in Appendix E) predicts a crossover from a honeycomb network at small w (favored by the disks’ rotational entropy) to a polygon network at largew(favored by configurational entropy). The latter is a 2 D analog of a 3 D patchy colloid liquid shown to be stable with respect to its crystal at zero temperature[32]: That reference therefore identified the physics (the entropy associated with bond flexibility) that permits the fully connected polygon net-work to be stable with respect to the honeycomb one.
Turning to standard equilibrium Monte Carlo simulations of the disks themselves (see AppendixF), which account for interactions and fluctuations absent from the topological-gas
mean-field estimate, we show in Fig.3(b)that the essence of the mean-field estimate, the change from an ordered network to a disordered one as a function of bond flexibilityw, is confirmed by thermodynamic simulations
[33]. (Note that in snapshots, we draw polygons atop disks, but we simulate the disks themselves.) In simu-lations, however, the transition from order to disorder is not a smooth crossover but a true phase transition. Temperature-concentration phase diagrams are shown in Fig. S4, demonstrating that in some regions of phase space, there exists coexistence between ordered and dis-ordered networks. The thermodynamics of the patchy-disk model therefore interpolates between the examples of network order given in panel A of Fig.1(graphene and the DNA star[7]) and the order-disorder coexistence shown in panel E of Fig.1(silica). This finding, combined with our analysis of the DFT results of Ref.[18] (Fig. S2), leads us to interpret the silica patterns described in Refs.[8,18]
as thermodynamic phase coexistence between honeycomb and polygon networks[34], albeit frozen because of the low temperatures at which images were taken.
VI. MODEL ALSO REPRODUCES DYNAMICS SEEN IN DIFFERENT EXPERIMENTS
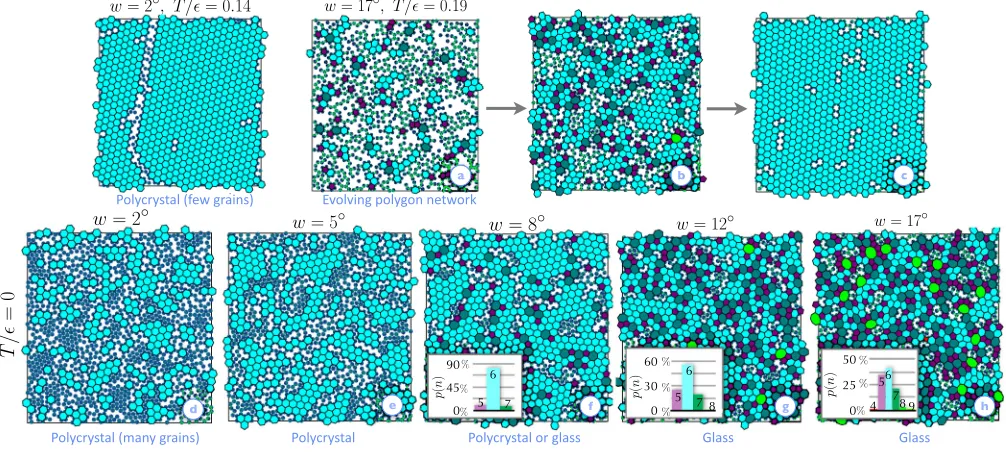
A range of nonequilibrium behavior also emerges upon variation of binding energy and flexibility. In Figs.4and5, we report the results of dynamical simulations [35], described in Appendix G, in which disks are allowed to exchange with and diffuse on an initially empty substrate. When interactions are inflexible (i.e., when w is small), only hexagons may form. Dynamically generated networks in this regime are polycrystalline, having few grain boun-daries in the weak-bond (nucleation) regime and many grain boundaries in the strong-bond (spinodal) regime (Fig. S5). This behavior is like that of the covalent polycrystalline networks shown in panel B of Fig.1 [9].
dynamics is similar to that displayed by TBPB, the inspiration for the model.
Glasses’ polygon distributions are sensitive to rates of particle deposition, indicating that they are not simply frozen versions of the disordered network stable in equi-librium at larger w (Figs. S6 and S7). Instead, they are
[image:6.612.55.558.49.275.2] [image:6.612.85.528.359.547.2]nonequilibrium structures whose polygon statistics is determined by collective microscopic motions (Fig. S8). The strong visual similarity between our simulations and experiments (Fig. S9) indicates that the model captures the physics that determines experimental patterns: Molecules’ substantial binding flexibility allows the formation, via a FIG. 5. Model capturing the microscopics of Fig.2captures the range of nonequilibrium behavior seen in experiments. We report network orderC(the number of hexagons divided by the total number of all polygons) in a space of inverse bond strengthT=ϵand stripe widthw, from dynamical simulations. Whenwis small, polycrystals assemble (see also Fig.4, left). For largerw, disordered polygon networks at early times (left panels) evolve into the stable honeycomb at later times (right panel; see also Fig.4, upper right), as long as bonds are weak enough to break frequently as the network assembles. Otherwise, glasses are formed. Disks with unbreakable bonds (bottom) self-assemble into structures that interpolate between polycrystals (smallw) and glasses (largew). Timetis measured in millions of Monte Carlo cycles. Lower-case letters a–h match snapshots in Fig.4.
diffusive dynamics, of a range of polygons. These polygons are then “frozen in” because bonds are too strong to be broken: We calculate from DFT the bond strength of TBPB be 5 eV, an effectively unbreakable150kBTat experimental temperatures. Our simulations also provide an explicit demonstration of the nonequilibrium origin suggested for isolated polygons made from the covalently associating molecule 1, 3, 5-triiodobenzene [19].
VII. CONCLUSIONS
We have shown that the thermodynamic and dynamic properties of self-assembled networks whose basic length scales span 3 orders of magnitude can be reproduced within a common physical framework. This framework, developed using a combination of quantum mechanics and statistical mechanics, resolves only the geometry and strength of binding of network-forming building blocks, not their chemical and atomic details. This finding indicates that there exist basic “design criteria”—here, geometry and strength of binding—that control the assembly of the building blocks of Fig. 1. Our results also indicate that structure formation driven by irreversible bonds, sometimes not classed as “self-assembly” [2], can nonetheless be considered within the same physical framework as assembly driven by reversible bonds: The behavior of covalently associating molecules and those interacting via reversible bonds can be reproduced in different param-eter regimes of the same model. The key limitation of our work is that it is, of course, qualitative, with respect to the comparison between experiments and the statistical mechanical model. Nonetheless, quantum mechanics allows one to quantify the microscopic interactions between molecules, and so to make our approach quantitative with respect to a particular system, one could consider a statistical mechanical model with an interaction potential just compli-cated enough to permit exact reproduction of real molecules’ free-energy cost of polygon formation. We also note that we see no impediment to doing a similar study of other geometries in 2 D[39]or in 3 D: Indeed, recent work has shown that simplified model particles that again focus only on geometry and energy scales of binding[40,41](the latter being a 3 D equivalent of the model studied here) can in 3 D capture important structural and thermodynamic features seen in experiments done on water, and atomistic simulations of water and silica.
Our results also suggest ways of making functional materials by using kinetic trapping to generate defined nonequilibrium assemblies. Kinetic trapping, the failure of a set of self-assembling components to achieve the structure lowest in free energy, is often regarded as a nuisance, not a virtue. But, the nonperiodic polygon networks studied here are generated by kinetic trapping. They have microscopic environments similar to the honeycomb, but mesoscopic environments that are substantially different, and so have properties not attainable to their periodic, equilibrium
counterparts. Atomic-scale polygon-network graphene has recently been predicted in simulations [42]; this material would have novel conductance properties [43]. Given that patchy-particle models like the one used here first appeared as models of colloids, we predict that colloids —perhaps three-patch “lock-and-key” ones [44]—could self-assemble as a nonperiodic polygon network, provided that their interactions are made sufficiently strong and flexible (Fig. 5). Such a material would have novel photonic properties[45].
ACKNOWLEDGMENTS
This work was done as part of a User project at the Molecular Foundry, Lawrence Berkeley National Laboratory, supported by the Director, Office of Science, Office of Basic Energy Sciences, of the U.S. Department of Energy under Contract No. DE-AC02–05CH11231. This research used resources of the National Energy Research Scientific Computing Center, which is supported by the Office of Science of the U.S. Department of Energy under Contract No. DE-AC02-05CH11231. I. T. acknowledges support from SOSCIP, NSERC, and ACEnet. M. B. W., N. R. C., J. P. G., and P. H. B. were supported by EPSRC Grant No. EP/K01773X/1.
APPENDIX A: TBPB-NETWORK PREPARATION
APPENDIX B: DENSITY-FUNCTIONAL THEORY
Treatment of nanometer-scale, aperiodic structures using accurate electronic structure methods is challenging. Although simulation of a single molecule of TBPB (whose chemical formula is C24H15Br3) is feasible from the standpoint of computational expense, the minimum-energy, closed-loop motif includes six such units. Energetically accessible (and experimentally observed) defects com-prised of eight or more units are possible. And, if we consider interactions between polygons, then we must simulate larger structures still. The largest geometries we consider include over 900 electrons (398 atoms). This structure had a length of 6.5 nm along the principal axis. To overcome these challenges, we have developed a procedure based on several stages of relaxation and equi-libration, each at increasing levels of theory and fidelity. Initial structures are relaxed using an interactive molecular-dynamics package [48] using the Merck molecular force field (MMFF94) [49]. Our approach allows for efficient visualization, geometry preconditioning, and motif searching.
Next, we use a minimal, localized basis set to quench the structure at the level of a hybrid-DFT functional (B3LYP
[16,17]). In the final and most computationally demanding step, we use a more complete (6–31G⋆⋆) set of basis functions to completely relax the system within using the vdW-DF2[15]framework. We use the Q-Chem code[50]
for all of our DFT calculations. To understand and estimate effects due to dispersion interactions, we also compute energies of relaxed structures with the same6–31G⋆⋆basis set using B3LYP. From this comparison, we find that the potential-energy surface predicted with vdW interactions (vdw-DF2) is more shallow and has a larger anharmonic component. B3LYP calculations are well fit by assuming the energy cost per polygon to be quadratic in the internal angle of the polygon, givingUB3LYPðnÞ ¼kð1–6=nÞ2, with k¼2.14eV. Note that this expression is asymmetric inn. vdW-DF2 calculations are fit instead by the functional form
UvdW-DF2ðnÞ ¼ k
4½θðnÞ−θð6Þ4 ð4< n <8Þ 1
2k2½θðnÞ−θð6Þ2 ðotherwiseÞ;
(B1)
with k2¼3.6eV and k4¼30eV. A topological-gas estimate (see Appendix C) allows us to compare the thermodynamics implied by the two interaction models: van der Waals forces are important quantitatively, but both functionals predict that the experimental network is glassy at 410 K.
Interacting loops.—To check our understanding of this system at one further level of refinement, we perform relaxations (using the vdW-DF functional) of interacting 5–7 and 6–6 loops. Such relaxations are very costly, taking several months of computation time; we therefore use a basis set slightly smaller (6–31G⋆) than the one used for isolated loops. We find the 6–6 combination to be favored
energetically over the 5–7 one, to the tune of 0.452 eV. Doing calculations on isolated loops using the same (slightly reduced) basis set gives a similar number, 0.435 eV, indicating that isolated-loop calculations give a reasonable representation of the behavior of molecules in connected networks.
APPENDIX C: TOPOLOGICAL-GAS MODEL A topological gas is a set of M noninteracting n-gons subject to the requirement that their average sizehniis 6. This requirement comes from pretending that the n-gons actually form a fully connected network whose vertices are threefold-coordinated particles [20,51]. The partition function for such a gas is
Z¼X n1
zðn1Þ
X
nM
zðnMÞexp
−λX i
ðni−6Þ
∝XnzðnÞexpð−λnÞ M
; (C1)
where zðnÞ, the key input of the model, is the thermal weight of a loop ofnsides, andλis a Lagrange multiplier introduced to fix the average loop size. The loop-size distribution ispðnÞ ¼ hPMi¼1δni;ni, or
pðnÞ ¼ zðnÞe−nλ
⋆
P
nzðnÞe−nλ
⋆; (C2)
withλ⋆ chosen to satisfyPnnpðnÞ ¼6. The input to the model is zðnÞ ¼exp½−βUðnÞ, the thermal weight of an isolated n-gon, which we take from DFT calculations or analytic approximations of the disk model. In the inset to Fig.2(b), we use as inputs to the topological-gas model the fitsUB3LYPðnÞandUvdW-DF2ðnÞdisplayed in AppendixB.
APPENDIX D: PATCHY-DISK MODEL
Our disk model consists of hard stripy disks of diameter a. Disks can move in continuous space on a smooth, two-dimensional substrate. Disks are decorated by three stripes, sectors of opening angle2w. Stripes are arranged regularly around the disk (i.e., stripe bisectors make an angle2π=3to the bisectors of the neighboring stripes). Disks bind in a pairwise fashion, with energy of interaction−ϵ, if (1) disk centers lie within a distanceaþΔ, whereΔ¼a=10, and (2) two disks’ center-to-center vector cuts through one stripe on each disk [see the dotted grey line in Fig.3(a)]. This angular interaction is a 2 D version of the Kern-Frenkel potential[30]. To ensure that a stripe can bind to only one other stripe, we restrict the patch-opening angle tow <arcsinðaa=þ2ΔÞ ¼arcsinð5=11Þ≈27.0°.
by considering the angle each disk in a regularn-gon may rotate while its two stripes are bound to stripes on neighbor-ing disks. (See Ref. [31] for an elegant general theory accounting for rotational entropy in periodic assemblies.) We assume particle centers to be fixed (i.e., we neglect vibrational entropy). To estimate rotational entropy, we note that each internal angle of a regularn-gon is θðnÞ ¼ ðn−2Þπ=n, while θð6Þ ¼2π=3 is the angle between adjacent stripes on a disk. The anglez1ðnÞa disk can rotate without its stripes breaking contact with either of two neighbors in an n-gon is its stripe width 2w minus the (magnitude of) the difference between θðnÞ and θð6Þ, i.e., z1ðnÞ ¼maxð0;2w−jθð6Þ−θðnÞjÞ. This expression can be written as
z1ðnÞ ¼max
0;2w− π 3njn−6j
: (D1)
This angle is largest for the hexagon, where it is equal to2w, the width of the patch. To this level of approximation, the thermal weight of ann-gon iszðnÞ ¼z1ðnÞn. Rotational entropy therefore favors network order (networks made of hexagons). In Fig. 3(a), we plot for different choices of w the (normalized) free energy per disk associated with this rotational partition function, namely, βΔGðnÞ ¼ −ln½z1ðnÞ=z1ð6Þ.
APPENDIX E: TOPOLOGICAL-GAS ESTIMATE APPLIED TO PATCHY-DISK MODEL
We can get a rough sense for how the thermodynamics of the disk-model network depends on bond flexibility by using the polygon free-energy cost [Eq. (1)] as the input βεðnÞto the topological-gas model. We have
pðnÞ ¼Pexp½−λ⋆n−βϵðnÞ nexp½−λ⋆n−βϵðnÞ;
(E1)
where
ϵðnÞ ¼−nkBT× ln max
0;2w− π 3njn−6j
(E2)
is the free-energy cost of a loop of n sides. (Here, for simplicity, we ignore the possibility of broken bonds and network compressibility, although both effects arise in simulations of disks.)
The Helmholtz free energy per loop of the network is fnet¼−TSþUor
fnet¼kBT X
n
pðnÞlnpðnÞ þX n
pðnÞ½ϵðnÞ þλ⋆n: (E3)
The first term in Eq.(E3)is −T times the configurational entropy of the network-loop distribution. This entropy favors network disorder: It is large for a broad distribution of loop sizes and zero for the pure honeycomb network
[for which pðnÞ ¼δn;6]. The second term contains the “internal energy”ϵðnÞof each loop [Eq.(E2)]. For the disk model, this internal energy is entropic in origin and comes from the rotational entropy of particles in the loop. It is largest for the honeycomb network, and so this entropy favors network order. The piece λ⋆n enforces the Euler constraint that the average loop size is 6 and can be regarded as an effective loop chemical potential. Equation(E1)predicts a smooth crossover from an ordered network to a disordered one beginning at a patch width of about w¼10°. Simulations [Fig. 3(b)] show instead an order-disorder phase transition closer tow¼20°. This numerical difference is expected because (1) our analytic estimate for disks’ polygon-forming thermodynamics ignores vibrational entropy and (2) the topological-gas approximation we have used ignores polygon-polygon interactions, and hence surface tension. (Note, though, that polygon interactions can be included within a topological-gas framework [20].) Nonetheless, analytic study of the disk model identifies the physics responsible for the order-disorder phase transition seen in equilibrium simulations.
APPENDIX F: EQUILIBRIUM SIMULATIONS OF THE DISK MODEL
We calculate network thermodynamics in Fig. 3(b) by performing direct coexistence simulations, Gibbs ensemble simulations, and fixed-pressure Monte Carlo simulations
[33], in all cases using approximately 1000 disks per simulation. Figure S4 shows two characteristic phase diagrams in the conventional temperature-density plane.
For larger widths [e.g., w¼25°; see Fig. S4(b)], a polygon-liquid phase emerges at intermediate tempera-tures. We simulate these phases in the Gibbs ensemble
[52]. As shown in Fig. S4(b), we find that we can fit a binodal of the form expected for the two-dimensional Ising universality class
ðϕliquid−ϕgasÞ8¼c
1ðTc−TÞ; (F1)
1
2ðϕliquidþϕgasÞ ¼ϕcþc2ðTc−TÞ; (F2)
whereðϕc; TcÞis the critical point,c1andc2are constants, and Eq. (F2) is the empirical law of rectilinear diameter. As for smaller w, we obtain gas-solid coexistence den-sities using direct coexistence simulations, finding that the solid is a honeycomb network. Although we could use direct coexistence simulations to observe polygon-liquid– honeycomb-solid coexistence above the triple point, the interfaces between the slabs are not stable enough to accurately calculate the properties of the coexisting phases. We expect that due to low interfacial tension between the phases, such direct coexistence simulations would have to be conducted with much larger systems. Instead, we estimate the properties of the coexisting liquid and solid phases by performing fixed-pressure simulations at a range of pressures. Since we initialize the simulations in the solid phase, we characterize the coexisting liquid as the highest-pressure system that melts and the solid as the lowest-pressure system that remains a stable solid, using lowest-pressure steps of size 0.2ϵa2, where a is the disk diameter. Depending on temperature, we initialize the systems either as the honeycomb or as hexagonal crystals. Starting from a strongly unstable crystal (hexagonal at low T or honey-comb at high T) leads to prohibitively slow equilibration. As shown in Fig. S4(b) forw¼25°, the solid phase crosses over from a honeycomb crystal with ϕ≃0.56 to a hexagonal crystal withϕ≃0.80as temperature increases. In Fig.3(b), we define the network order at coexistence as the network order of the first condensed phase upon compression. Choosing T=ϵ¼0.16, the first condensed phase is the honeycomb solid forw≤20∘and the polygon liquid forw≥21∘.
APPENDIX G: DYNAMICAL SIMULATIONS OF THE DISK MODEL
Figures4and5are obtained from dynamical simulations of the following nature. The substrate is initially empty. Disks are allowed to bind to or unbind from the substrate (assuming an implicit solution of disks in contact with the substrate) and to translate and rotate diffusively on the substrate. To approximate on-substrate diffusive motion, we use the virtual-move Monte Carlo algorithm [35,53]. This algorithm moves particles locally according to gradients of potential energy and collectively so as to
approximate the diffusion expected of overdamped motion. We checked that conventional single-particle moves repro-duce (in a qualitative sense) the classes of structures— polycrystals, glasses, etc.—described in the text. We expect, therefore, that our qualitative conclusions are likely to be independent of precise details of the dynamic protocol used.
To move particles to and from the substrate, we use grand-canonical Monte Carlo moves, namely, single-particle insertions (proposed anywhere in the box) and deletions (of randomly chosen single particles), proposed with equal likelihood. The acceptance-rate ratio for these moves is[33]
paccðN→Nþ1Þ paccðNþ1→NÞ
¼ppropðNþ1→NÞ ppropðN→Nþ1Þ
V
Nþ1eβμ−βΔE; (G1)
where V is the box volume, ΔE is the energy change resulting from the proposed move, ppropðN→Nþ1Þ is the rate at which the insertion move is proposed, and ppropðNþ1→NÞ is the rate at which the deletion move is proposed.
Choosing grand-canonical and on-substrate moves with fixed probabilities (method 1) givesppropðN →Nþ1Þ ¼ ppropðNþ1→NÞ, and so appropriate choices for insertion-and deletion-acceptance rates are
paccðN →Nþ1Þ ¼min
1; V
Nþ1eβμ−βΔE
(G2)
and
paccðN →N−1Þ ¼min
1;N
Ve−βμ−βΔE
: (G3)
However, choosing diffusion and grand-canonical moves with fixed probabilities results (particularly at low temper-ature, where bound disks rarely unbind) in a dynamics in which the effective on-substrate basic diffusion rate becomes more sluggish as the substrate becomes host to more particles. To illustrate this effect, consider the case in which diffusion and grand-canonical moves are chosen with equal likelihood. If one particle is present on the substrate, then its frequency of motion with respect to that of particle deposition is2∶1. But, if 100 particles lie on the substrate, the frequency of motion of each, relative to that of particle deposition on the substrate, is1∶50.
relative proposal rate of on-substrate diffusion and particle addition is then independent ofN. No modification of the on-substrate move-acceptance rates is needed: If N par-ticles lie on the substrate, then both forward and reverse diffusive moves are proposed with rate N=ðNþ1Þ, and so this factor cancels from the detailed balance condition for those moves. This dynamics is still approximate, in a physical sense, because it assumes that removal of disks from the substrate is not important. (The rate for this process could, in principle, be scaled independently of the deposition rate, but we have chosen not to do so.) Simulation results in the text are from method 2, but those from method 1 are qualitatively similar (meaning that the regimes of parameter space in which we see polycrystals, glasses, evolving polygon networks, etc., are similar). Larger differences are observed within each method by varying the relative rates of deposition (see Figs.4and5). The chemical potential μ is chosen so that the disk-packing fraction in the absence of attractive interactions is 25%. In Figs. S6 and S7, the case of “fast deposition” corresponds to the procedure just outlined, while “slow deposition”corresponds to a similar dynamics in which the basic rate of grand-canonical moves is reduced by 2 orders of magnitude.
[1] D. Philp and J. Fraser Stoddart, Self-Assembly in Natural and Unnatural Systems,Angew. Chem., Int. Ed. Engl.35, 1154 (1996).
[2] G. M. Whitesides and B. Grzybowski,Self-Assembly at All Scales,Science295, 2418 (2002).
[3] M. F. Hagan and D. Chandler,Dynamic Pathways for Viral Capsid Assembly,Biophys. J.91, 42 (2006).
[4] A. W. Wilber, J. P. K. Doye, A. A. Louis, E. G. Noya, M. A. Miller, and P. Wong, Reversible Self-Assembly of Patchy Particles into Monodisperse Icosahedral Clusters,J. Chem. Phys.127, 085106 (2007).
[5] E. Rabani, D. R. Reichman, P. L. Geissler, and L. E. Brus, Drying-Mediated Self-Assembly of Nanoparticles, Nature (London)426, 271 (2003).
[6] A. K. Geim and K. S. Novoselov, The Rise of Graphene, Nat. Mater.6, 183 (2007).
[7] Y. He, Y. Chen, H. Liu, A. E. Ribbe, and C. Mao, Self-Assembly of Hexagonal DNA Two-Dimensional (2 D) Arrays,J. Am. Chem. Soc.127, 12 202 (2005).
[8] L. Lichtenstein, M. Heyde, and H.-J. Freund, Crystalline-Vitreous Interface in Two Dimensional Silica,Phys. Rev. Lett.109, 106101 (2012).
[9] M. Bieri, M. Treier, J. Cai, K. Aït-Mansour, P. Ruffieux, O. Gröning, P. Gröning, M. Kastler, R. Rieger, X. Fenget al., Porous Graphenes: Two-Dimensional Polymer Synthesis with Atomic Precision,Chem. Commun. (Cambridge) 45, 6919 (2009).
[10] C.-A. Palma, P. Samor̀ı, and M. Cecchini, Atomistic Simulations of 2 D Bicomponent Self-Assembly: From Molecular Recognition to Self-Healing, J. Am. Chem. Soc.132, 17 880 (2010).
[11] L. Bartels,Tailoring Molecular Layers at Metal Surfaces, Nat. Chem.2, 87 (2010).
[12] W. H. Zachariasen, The Atomic Arrangement in Glass, J. Am. Chem. Soc.54, 3841 (1932).
[13] M. O. Blunt, J. C. Russell, N. R. Champness, and P. H. Beton,Templating Molecular Adsorption Using a Covalent Organic Framework,Chem. Commun.46, 7157 (2010). [14] See Supplemental Material at http://link.aps.org/
supplemental/10.1103/PhysRevX.4.011044 for figures supplementing Figs. 1–5, and for details of the image processing done to produce Fig. 2a.
[15] M. Dion, H. Rydberg, E. Schröder, D. C. Langreth, and B. I. Lundqvist, Van der Waals Density Functional for General Geometries,Phys. Rev. Lett.92, 246401 (2004). [16] A. D. Becke, Density-Functional Thermochemistry. III.
The Role of Exact Exchange, J. Chem. Phys. 98, 5648 (1993).
[17] P. J. Stephens, F. J. Devlin, C. F. Chabalowski, and M. J. Frisch,Ab Initio Calculation of Vibrational Absorption and Circular Dichroism Spectra Using Density Functional Force Fields,J. Phys. Chem.98, 11623 (1994).
[18] L. Lichtenstein, C. Büchner, B. Yang, S. Shaikhutdinov, M. Heyde, M. Sierka, R. Włodarczyk, J. Sauer, and H.-J. Freund,The Atomic Structure of a Metal-Supported Vitreous Thin Silica Film,Angew. Chem., Int. Ed.51, 404 (2012).
[19] S. Schlögl, W. M. Heckl, and M. Lackinger, On-Surface Radical Addition of Triply Iodinated Monomers on Au (111)—the Influence of Monomer Size and Thermal Post-processing,Surf. Sci.606, 999 (2012).
[20] G. Schliecker,Structure and Dynamics of Cellular Systems, Adv. Phys.51, 1319 (2002).
[21] T. E. Ouldridge, A. A. Louis, and J. P. K. Doye, DNA Nanotweezers Studied with a Coarse-Grained Model of DNA,Phys. Rev. Lett.104, 178101 (2010).
[22] C. Mayer and C. N. Likos,A Coarse-Grained Description of Star-Linear Polymer Mixtures,Macromolecules40, 1196 (2007).
[23] C. De Michele, L. Rovigatti, T. Bellini, and F. Sciortino, Self-Assembly of Short DNA Duplexes: From a Coarse-Grained Model to Experiments through a Theoretical Link, Soft Matter8, 83 88 (2012).
[24] N. Duff and B. Peters,Nucleation in a Potts Lattice Gas Model of Crystallization from Solution,J. Chem. Phys.131, 184101 (2009).
[25] P. R. ten Wolde and D. Frenkel, Enhancement of Protein Crystal Nucleation by Critical Density Fluctuations,Science277, 1975 (1997).
[26] Z. Zhang and S. C. Glotzer, Self-Assembly of Patchy Particles,Nano Lett.4, 1407 (2004).
[27] P. Tartaglia and F. Sciortino,Association of Limited Valence Patchy Particles in Two Dimensions, J. Phys. Condens. Matter 22, 104108 (2010).
[28] J. P. K. Doye, A. A. Louis, I-C.Lin, L. R. Allen, E. G. Noya, A. W. Wilber, H. C. Kok, and R. Lyus,Controlling Crystallization and Its Absence: Proteins, Colloids and Patchy Models, Phys. Chem. Chem. Phys. 9, 2197 (2007).
[30] N. Kern and D. Frenkel, Fluid-Fluid Coexistence in Colloidal Systems with Short-Ranged Strongly Directional Attraction,J. Chem. Phys.118, 9882 (2003).
[31] X. Mao, Q. Chen, and S. Granick,Entropy Favours Open Colloidal Lattices,Nat. Mater. 12, 217 (2013).
[32] F. Smallenburg and F. Sciortino,Liquids More Stable Than Crystals in Particles with Limited Valence and Flexible Bonds,Nat. Phys.9, 554 (2013).
[33] D. Frenkel and B. Smit, Understanding Molecular Simulation: From Algorithms to Applications(Academic, Orlando, FL, 1996).
[34] For work focusing on the nature of melting in 2 D, see, e.g., Refs.[36,46,47].
[35] S. Whitelam, Approximating the Dynamical Evolution of Systems of Strongly Interacting Overdamped Particles, Mol. Simul.37, 606 (2011).
[36] S. Mehraeen, N. Cordella, J. S. Yoo, and A. J. Spakowitz, Impact of Defect Creation and Motion on the Thermody-namics and Large-Scale Reorganization of Self-Assembled Clathrin Lattices,Soft Matter7, 8789 (2011).
[37] F. Banhart, J. Kotakoski, and A. V. Krasheninnikov, Structural Defects in Graphene,ACS Nano5, 26 (2011). [38] D. Sherrington, L. Davison, A. Buhot, and J. P. Garrahan,
Glassy Behaviour in Simple Kinetically Constrained Models: Topological Networks, Lattice Analogues and Annihilation-Diffusion,J. Phys. Condens. Matter14, 1673 (2002). [39] H. M. Harreis, A. A. Kornyshev, C. N. Likos, H. Löwen, and
G. Sutmann,Phase Behavior of Columnar DNA Assemblies, Phys. Rev. Lett.89, 018303 (2002).
[40] V. Molinero and E. B. Moore, Water Modeled as an Intermediate Element between Carbon and Silicon,J. Phys. Chem. B113, 4008 (2009).
[41] I. Saika-Voivod, F. Smallenburg, and F. Sciortino, Understanding Tetrahedral Liquids through Patchy Colloids,J. Chem. Phys.139, 234901 (2013).
[42] A. Kumar, M. Wilson, and M. F. Thorpe, Amorphous Graphene: A Realization of Zachariasen’s Glass,J. Phys. Condens. Matter24, 485003 (2012).
[43] E. Holmström, J. Fransson, O. Eriksson, R. Lizárraga, B. Sanyal, S. Bhandary, and M. I. Katsnelson, Disorder-Induced Metallicity in Amorphous Graphene,Phys. Rev. B
84, 205414 (2011).
[44] S. Sacanna, W. T. M. Irvine, P. M. Chaikin, and D. J. Pine, Lock and Key Colloids, Nature (London) 464, 575 (2010).
[45] M. Florescu, S. Torquato, and P. J. Steinhardt, Designer Disordered Materials with Large, Complete Photonic Band Gaps, Proc. Natl. Acad. Sci. U.S.A. 106, 20 658 (2009).
[46] R. S. Singh, M. Santra, and B. Bagchi,Anisotropy Induced Crossover from Weakly to Strongly First Order Melting of Two Dimensional Solids,J. Chem. Phys. 138, 184507 (2013).
[47] E. P. Bernard and W. Krauth, Two-Step Melting in Two Dimensions: First-Order Liquid-Hexatic Transition,Phys. Rev. Lett.107, 155704 (2011).
[48] M. D. Hanwell, D. E. Curtis, D. C. Lonie, T. Vandermeersch, E. Zurek, and G. R. Hutchison, Avogadro: An Advanced Semantic Chemical Editor, Visualization, and Analysis Platform,J. Cheminf.4, 17 (2012).
[49] T. A. Halgren, Merck Molecular Force Field. I. Basis, Form, Scope, Parameterization, and Performance of MMFF94,J. Comput. Chem.17, 490 (1996).
[50] Y. Shao,Advances in Methods and Algorithms in a Modern Quantum Chemistry Program Package,Phys. Chem. Chem. Phys.8, 3172 (2006).
[51] G. Schliecker and S. Klapp, Why Are the Equilibrium Properties of Two-Dimensional Random Cellular Structures So Similar?,Europhys. Lett.48, 122 (1999). [52] A. Z. Panagiotopoulos and M. R. Stapleton, The Gibbs
Method for Molecular-Based Computer Simulations of Phase Equilibria,Fluid Phase Equilib.53, 133 (1989). [53] S. Whitelam and P. L. Geissler, Avoiding Unphysical