Please cite this article as: F. Nourzadeh, S. Ebrahimnejad, K. Khalili-Damghani, A., Development of a Model for Locating Hubs in a Competitive Environment under Uncertainty: A Robust Optimization Approach, International Journal of Engineering (IJE), IJE TRANSACTIONS A: Basics Vol. 33, No. 1, (January 2020) 124-133
International Journal of Engineering
J o u r n a l H o m e p a g e : w w w . i j e . i rDevelopment of a Model for Locating Hubs in a Competitive Environment under
Uncertainty: A Robust Optimization Approach
F. Nourzadeha, S. Ebrahimnejad*b, K. Khalili-Damghania, A. Hafezalkotoba
a Department of Industrial Engineering, South Tehran Branch, Islamic Azad University, Tehran, Iran b Department of Industrial Engineering, Karaj Branch, Islamic Azad University, Karaj, Iran
P A P E R I N F O
Paper history: Received 25 August 2019
Received in revised form 30 September 2019 Accepted 08 November 2019
Keywords: Competitive Location
Multivariate Lagrange Interpolation Function Location Hub
Robust Optimization
A B S T R A C T
This article explores the development of previous models to determine hubs in a competitive environment. In this paper, by comparing parameters of the ticket price, travel time and the service quality of hub airports, airline hubs are divided into six categories. The degree of importance of travel time and travel cost are determined by a multivariate Lagrange interpolation method, which can play an important role in allocating travelers to follower airline hubs. Then, based on the seasonal demand of travelers, we consider travel demand as uncertain parameters. To determine the robust counterpart of this category of hub location models, a robust optimization method is used. Finally, models are tested in a case study. The central results show that the follower airline's income has a considerable growth and can absorb nearly 2% of travelers of the leader airline due to lower travel costs and travel time compared to that of leader airline.
doi: 10.5829/ije.2020.33.01a.14
1. INTRODUCTION1
In this paper, to determine the exact location of hubs we develop the model of Marianov et al. [1] by defining a new type of capture sets under uncertainty. We divide the nominated airports for follower airline's hub into six independent categories by comparing parameters of travel cost, travel time and service quality of hubs. By employing multivariate Lagrange interpolation function, we determine the degree of importance of time and cost of travel from the traveler's perspective. The results show that the follower airline's income has a considerable growth compared to the Marianov et al. [1] model and can absorb nearly 2% of travelers of the leader airline due to lower travel costs and travel time compared to that of leader airline.
Marianov et al. [1] proposed the first hub location problem in a competitive environment. In their model for the hub location of follower player, the leader player has already selected its hub-and-spoke network. The flow from origin to destination passes through only one path (including the maximum of two hubs). They also presented two models for the follower player. In the first model, if the cost of traveler movement by the follower
*Corresponding Author Email: [email protected] (S. Ebrahimnejad)
is lower than the leader, then all of the travelers are attracted to leader player hubs. However, in the second model, three capture sets are presented based on the compared cost of travel by the follower and leader player. The members of those sets will attract 50, 75 and 100% of travelers, respectively.
research. Marianov et al. [1] and Wagner [2] used the values of 0.7, 0.9, and 1.1 as well as 50, 75, and 100% in their capture sets. In this paper, the multinomial Lagrange interpolation method was used to calculate the exact values determined by them. Moreover, the bounds of variables belonged to these sets were determined by considering the degree of importance of parameters of travel time and travel cost from the viewpoint of travelers, the quality of airports and airlines, safety, and delays of airlines.
In the real world, ignoring even one small uncertainty in data will result in an optimal solution that can be insignificant and meaningless. Therefore, various approaches were developed in the literature to gain more realistic optimal solutions. The robust optimization approach is one of the most important approaches in this area. The approaches presented by Soyster [3], Ben-Tal and Nemirovski [4], and Bertsimas and Sim [5] are the main approaches for robust optimization, which are employed in articles related to hub location under uncertainty. Concerning the possibility of controlling the conservativeness of robust solutions and linearity of the method of Bertsimas and Sim [5], was used in this approach to demonstrate the uncertainty in parameters of travel demand to gain more realistic solutions.
To compare the presented model in this paper and the model of Marianov et al. [1], we examined a case study, in which Emirate airline is the leader airline, and follower airline consists of three airlines named Mahan Airline, Iran Air, and Aseman Airline. The spokes were selected from a pool of cities, which passed the largest number of travelers from European countries to East Asian countries by the hubs of Emirate airline. The findings showed that the follower airline's coalition income has a considerable growth compared to the model of Marianov et al. [1].
In the next section, the literature review is presented. In section 3, the model of Marianov et al. [1] is developed. Then, to determine the degree of importance of travel time and cost, we introduced a multivariate Lagrangian interpolation function. In section 4, the model described in the third section will be presented in uncertainty mode by employing Bertsimas and Sim's approach [5]. In section 5, the model for a real problem is implemented and compared with the model of Marianov et. al [1]. Also, we investigated the impact of change in the problem's parameters on the value of the objective function and presented managerial insights. Concluding remarks is presented in the last section of this paper.
2. LITERATURE REVIEW
The most important research related to the subject of this paper is presented here. Sasaki and Fukushima [6]
proposed a new model called "Stackelberg Hub Location" to explore the competition among a large company and several medium-sized firms. They suggested that a leader company could lose a huge percentage of travelers regardless of competition strategies. Based on the Stackelberg hub location model. Sasaki [7] began to design a hub network, in which two companies compete over maximizing their profits. Sasaki et al. [8] proposed a model for the hub location in a
competitive environment. Whereas Sasaki and
Fukushima [6] and Sasaki [7] allowed only using one hub in the path of flow passing from origin to destination, they studied more than one hub in their model. Eiselt and Marianov [9] proposed a hub location problem in a competitive environment in which customers based on the parameters of the ticket price and flight time used the gravity-like function to select airline. They implemented their model for the follower player as a new entrant player to the Australian Postal network.
Code Sharing Agreement is a commercial agreement in air transportation, in which two or more airlines share a common flight. In this paper, we consider the alliance between Mahan Airline, Iran Air, and Aseman Airline using Code Sharing Agreement. Lin [10] assessed the economic effects of alliance and cooperation between an international airline and a local airline. He suggested that two Stackelberg equilibrium points were achievable when a set of allied airlines was identified as the leader (follower) player. Lin [10] also demonstrated that in addition to an increase in the social welfare of travelers, the alliance might reduce international traveler excess and local direct travelers. Zou and Chen [11] investigated the effects of code sharing and global alliance on the performance of airlines simultaneously. The results showed that the profit margin of an airline was positively associated with the number of partners in code sharing. Yimga [12] investigated the relationship between alliances and on-time performance. He found evidence that code-sharing alliances improve the on-time performance rate.
A variety of are reviewed in articles. Some of the most attractive solving methods are as follows:
Tavakkoli-Moghadam et al. [16] developed a multi-objective mathematical model for a capacitated single hub location problem to determine the location and the capacity of hub node. The model is solved by a multi-objective imperialist competitive algorithm. The authors minimized the total cost of the networks and minimize the maximum travel time between nodes.
Ghodratnama et al. [17] presented a new mathematical model for a p-hub location-allocation problem and compared three Meta-heuristics a namely genetic algorithm, particle swarm optimization, and simulated annealing to solve it. Bashiri and Rezanezhad [18] presented a multi-objective model for uncapacitated single allocation and used the ε-constraint algorithm for small size instances and NSGA-II to obtain Pareto solutions. The model aims to minimize the total investment and transportation costs, minimizes the maximum traveling time between the pair of nodes, maximizes the total reliability of available paths and forces allocating near nodes to more reliable hubs. Alizadeh et al. [19] presented a new multi-objective mathematical model for a capacitated hub maximal covering problem. They solved the model by dominated sorting genetic algorithm (NSGA-II) and non-dominated ranking genetic algorithm (NRGA). Karimi, et al. [20] formulated the multi-modal single allocation capacitated p-hub covering problem. They presented a heuristic based on the taboo search algorithm to solve the problem.
3. PROBLEMS STATEMENT AND MATHEMATICAL MODEL
In this section, we developed the model of Marianov et al. [1] for an alliance of airlines with a lower market share. The notations used in the proposed deterministic model are as follows:
Sets:
𝑁𝑖𝑗1= {𝑘 ∈ 𝐾|𝑐𝑖𝑘+ 𝑐𝑘𝑗< 𝐶𝑖𝑗, 𝑡𝑖𝑘+ 𝑡𝑘+ 𝑡𝑘𝑗≥ 𝑇𝑖𝑗, 𝑉𝑘< 𝑉}
𝑁𝑖𝑗2= {𝑘 ∈ 𝐾|𝑐𝑖𝑘+ 𝑐𝑘𝑗< 𝐶𝑖𝑗, 𝑡𝑖𝑘+ 𝑡𝑘+ 𝑡𝑘𝑗≥ 𝑇𝑖𝑗, 𝑉𝑘≥ 𝑉}
𝑀𝑖𝑗1 = {𝑘 ∈ 𝐾|𝑐𝑖𝑘+ 𝑐𝑘𝑗≥ 𝐶𝑖𝑗, 𝑡𝑖𝑘+ 𝑡𝑘+ 𝑡𝑘𝑗< 𝑇𝑖𝑗, 𝑉𝑘< 𝑉}
𝑀𝑖𝑗2 = {𝑘 ∈ 𝐾|𝑐𝑖𝑘+ 𝑐𝑘𝑗≥ 𝐶𝑖𝑗, 𝑡𝑖𝑘+ 𝑡𝑘+ 𝑡𝑘𝑗< 𝑇𝑖𝑗, 𝑉𝑘≥ 𝑉}
𝑃𝑖𝑗1= {𝑘 ∈ 𝐾|𝑐𝑖𝑘+ 𝑐𝑘𝑗< 𝐶𝑖𝑗, 𝑡𝑖𝑘+ 𝑡𝑘+ 𝑡𝑘𝑗< 𝑇𝑖𝑗, 𝑉𝑘< 𝑉}
𝑃𝑖𝑗2= {𝑘 ∈ 𝐾|𝑐𝑖𝑘+ 𝑐𝑘𝑗< 𝐶𝑖𝑗, 𝑡𝑖𝑘+ 𝑡𝑘+ 𝑡𝑘𝑗< 𝑇𝑖𝑗, 𝑉𝑘≥ 𝑉}
𝐾′= 𝑁𝑖𝑗1∪ 𝑁𝑖𝑗2 𝐾"= 𝑀𝑖𝑗1∪ 𝑀𝑖𝑗2
𝐾′′′= 𝑃𝑖𝑗1∪ 𝑃𝑖𝑗2 𝐾 = 𝐾′∪ 𝐾′′∪ 𝐾′′′
Indices:
𝐼, 𝑖 Set and counter of origins 𝐽, 𝑗 Set and counter of destinations
𝐾, 𝑘 Set and counter of all candidate hubs
Parameters:
𝑐𝑖𝑘 Ticket price for passing a traveller from𝑖to 𝑘 𝑐𝑘𝑗 Ticket price for passing a traveller from 𝑘to𝑗
𝐶𝑖𝑗 Total airfare of passing a traveller from𝑖to𝑗through leader hub(s)
𝑡𝑘 Average time delay for transferring a traveller in 𝑘 𝑡𝑖𝑘 Time needed to pass travelers from𝑖 to 𝑘
𝑡𝑘𝑗 Time needed to pass travelers from 𝑘 to𝑗
𝑇𝑖𝑗 Total time needed to pass from 𝑖 to𝑗
𝑊𝑖𝑗 Total flow passing from moved by the leader 𝑖 to𝑗which has already
𝛤𝑘 Capacity of 𝑘
𝐸𝑘 Minimum passing flow to select 𝑘as the hub 𝑉𝑘 Service quality of 𝑘controlled by follower airline
𝑉 Average service quality of airports controlled by leader airline
𝑈𝑓 Quality of follower airline
𝑈𝑙 Quality of leader airline 𝑆𝑓 Safety of follower airline
𝑆𝑙 Safety of leader airline
𝑡𝑓 Average travel time delay transferring a traveller by follower airline
𝑡𝑙 Average travel time delay transferring a traveller by leader airline
𝑓𝑐 Importance of cost for a traveller 𝑓𝑡 Importance of time for a traveller
𝑓𝑞 Importance of service quality of airport for a traveller
𝑀 Large positive number
𝑝1, 𝑝2 Reduction factor of 𝑊𝑖𝑗for sets 𝑁𝑖𝑗1,𝑁𝑖𝑗2
𝑞1, 𝑞2 Reduction factor of 𝑊𝑖𝑗for sets𝑀𝑖𝑗1,𝑀𝑖𝑗2
𝑟1, 𝑟2 Reduction factor of 𝑊𝑖𝑗for sets𝑃𝑖𝑗1,𝑃𝑖𝑗2
𝛽1, 𝛽2 Discount factor for ticket price 𝛾1, 𝛾2 Discount factor for ticket price
Decision variables:
ℎ𝑘 Equals 1 if zero 𝑘is selected as a hub, otherwise, Equals
𝑥𝑘𝑗𝑖1 Amount of flow passing from 𝑖to𝑗through 𝑘 ∈ 𝑁𝑖𝑗1
𝑥𝑘𝑗𝑖2 Amount of flow passing from 𝑖to 𝑗through 𝑘 ∈ 𝑁 𝑖𝑗2
𝑦𝑘𝑗𝑖1 Amount of flow passing from 𝑖to𝑗through 𝑘 ∈ 𝑀 𝑖𝑗1
𝑦𝑘𝑗𝑖2 Amount flow of passing from 𝑖to 𝑗through 𝑘 ∈ 𝑀𝑖𝑗2
𝑧𝑘𝑗𝑖1 Amount flow of passing from 𝑖to 𝑗through 𝑘 ∈ 𝑃𝑖𝑗1
3. 1. Objective Function
𝑧 = 𝑚𝑎𝑥 ∑𝑘∈𝐾∑𝑖∈𝐼−𝐾∑𝑗≠𝑖∈𝐽−𝐾∑2𝑠=1(𝑥𝑘𝑗𝑖𝑠+ 𝑦𝑘𝑗𝑖𝑠 + 𝑧𝑘𝑗𝑖𝑠)(𝛾1𝑐𝑖𝑘+ 𝛽1𝑐𝑘𝑗)+ ∑𝑖∈𝐼−𝐾∑𝑗∈𝐾∑2𝑠=1(𝑥𝑗𝑗𝑖𝑠+𝑦𝑗𝑗𝑖𝑠+ 𝑧𝑗𝑗𝑖𝑠)(𝛾2𝑐𝑖𝑗)+ ∑𝑘∈𝐾∑𝑗∈𝐽−𝐾∑2𝑠=1(𝑥𝑘𝑗𝑘𝑠+ 𝑦𝑘𝑗𝑘𝑠+ 𝑧𝑘𝑗𝑘𝑠)(𝛽
2𝑐𝑘𝑗) (𝛽1≤ 𝛾1≤ 𝛽2≤ 𝛾2)
(1)
The first term of the objective Function (1) represents the total income from selling tickets to travelers passing from origin 𝑖 (per each origin) to destination 𝑗 (to all destinations) through hubs 𝑘of the follower airline. Accordingly, none of the follower airline's hubs can be the origin or destination of travel. The second term of the objective Function (1) represents the total income from selling tickets to travelers who their destinations are one of the hubs of follower airline. The third term of the objective Function (1) represents the total income from selling tickets to travelers who their origins are one of the hubs of follower airline. Here is the reason why there is a relationship between ticket prices in the objective Function (1) such that 𝛽1≤ 𝛾1≤ 𝛽2≤ 𝛾2. When travelers use any other origin of follower airline's hubs to reach any other destination of follower airline's hubs, their profitability for the airline will be higher, and they deserve more discounts. In other words, 𝛽1, 𝛾1≤ 𝛾2 and 𝛽1, 𝛾1≤ 𝛾2. In this way, because travelers use follower airline's hub in the second part of their travel, airport costs are decreased. Also, because travelers from different origins aim to reach the same destination, taking advantage of a bigger airplane with a lower ticket price seems more logical; therefore 𝛽1≤ 𝛾1. When the origin or destination is one of the follower airline's hubs, the amount of discount is lower due to shorter travel. So, when the origin is follower airline's hub, we have𝛽2≤
𝛾2. Because airport costs are lower, travelers from other origins are going to reach the aforementioned destination.
3. 2. Constraints Constraints (2) to (7) show that the flow is established when a hub exists.
∑𝑘∈𝑁𝑖𝑗1𝑥𝑘𝑗𝑖1≤ 𝑊𝑖𝑗∗ 𝑝1∀𝑖 ∈ 𝐼, 𝑗 ∈ 𝐽 (2)
∑𝑘∈𝑁𝑖𝑗2𝑥𝑘𝑗𝑖2≤ 𝑊𝑖𝑗∗ 𝑝2∀𝑖 ∈ 𝐼, 𝑗 ∈ 𝐽 (3)
∑ 𝑦𝑘𝑗𝑖1
𝑘∈𝑀𝑖𝑗1 ≤ 𝑊𝑖𝑗∗ 𝑞1∀𝑖 ∈ 𝐼, 𝑗 ∈ 𝐽 (4)
∑𝑘∈𝑀𝑖𝑗2𝑦𝑘𝑗𝑖2≤ 𝑊𝑖𝑗∗ 𝑞2∀𝑖 ∈ 𝐼, 𝑗 ∈ 𝐽 (5)
∑ 𝑧𝑘𝑗𝑖1
𝑘∈𝑃𝑖𝑗1 ≤ 𝑊𝑖𝑗∗ 𝑟1∀𝑖 ∈ 𝐼, 𝑗 ∈ 𝐽 (6)
∑ 𝑧𝑘𝑗𝑖2
𝑘∈𝑃𝑖𝑗2 ≤ 𝑊𝑖𝑗∗ 𝑟2∀𝑖 ∈ 𝐼, 𝑗 ∈ 𝐽 (7)
According to Constraint (8), the maximum flow passing from all origins to all destinations through follower
airline hubs is equal to [𝑊𝑖𝑗( 𝑈𝑓
𝑈𝑙)(
𝑆𝑓
𝑆𝑙)(
𝑡𝑙
𝑡𝑓)]. Also, this constraint shows multiple allocations.
∑𝑠=12 (∑𝑘∈𝐾𝑥𝑘𝑗𝑖𝑠+ ∑𝑘∈𝐾𝑦𝑘𝑗𝑖𝑠+ ∑𝑘∈𝐾𝑧𝑘𝑗𝑖𝑠)≤ 𝑊𝑖𝑗(
𝑈𝑓 𝑈𝑙)(
𝑆𝑓 𝑆𝑙)(
𝑡𝑙 𝑡𝑓)∀𝑖, 𝑗
(8)
Constraint (9) shows that the maximum incoming flow to hub 𝑘equals𝛤𝑘.
∑𝑖∈𝐼∑𝑗≠𝑖∈𝐽∑2𝑠=1𝑥𝑘𝑗𝑖𝑠 + 𝑦𝑘𝑗𝑖𝑠+ 𝑧𝑘𝑗𝑖𝑠 ≤ 𝛤𝑘ℎ𝑘∀𝑘 ∈ 𝐾 (9)
Constraint (10) shows that the minimum flow passing for using spoke 𝑘as a hub is equal to𝐸𝑘.
𝐸𝑘− ∑𝑖∈𝐼∑𝑗∈𝐽∑2𝑠=1(𝑥𝑖𝑠𝑘𝑗+𝑦𝑘𝑗𝑖𝑠 + 𝑧𝑘𝑗𝑖𝑠) ≤ 𝑀(1 − ℎ𝑘)∀𝑘 ∈ 𝐾
(10)
Constraint (11) guarantees that for each origin 𝑖and destination𝑗, only variables𝑥𝑘𝑗𝑖𝑠related to airports 𝑘 in set
𝐾′can be non-zero, and the remaining variables are equal to zero.
𝑥𝑘𝑗𝑖𝑠 = 0∀𝑖 ∈ 𝐼, 𝑗 ∈ 𝐽; ∀𝑠 = 1,2; 𝑘 ∈ 𝐾 − 𝐾′ (11)
Constraint (12) guarantees that for each origin 𝑖and destination𝑗, only variables𝑦𝑘𝑗𝑖𝑠related to airports 𝑘in set
𝐾"can be non-zero, and the remaining variables are equal
to zero.
𝑦𝑘𝑗𝑖𝑠 = 0∀𝑖 ∈ 𝐼, 𝑗 ∈ 𝐽; ∀𝑠 = 1,2; 𝑘 ∈ 𝐾 − 𝐾" (12)
Constraint (13) guarantees that for each origin 𝑖and destination𝑗, only variables 𝑧𝑘𝑗𝑖𝑠 related to airports 𝑘in set
𝐾"′can be non-zero, and the remaining variables are equal
to zero.
𝑧𝑘𝑗𝑖𝑠 = 0∀𝑖 ∈ 𝐼, 𝑗 ∈ 𝐽; ∀𝑠 = 1,2; 𝑘 ∈ 𝐾 − 𝐾"′ (13)
Constraints (14) and (15) show the domain of variables.
ℎ𝑘∈ {0,1}∀𝑘 ∈ 𝐾 (14)
𝑥𝑘𝑗𝑖1, 𝑥𝑘𝑗𝑖2, 𝑦𝑘𝑗𝑖1, 𝑦𝑘𝑗𝑖2, 𝑧𝑘𝑗𝑖1, 𝑧𝑘𝑗𝑖2 ∈ 𝐼+∪ {0}∀𝑖 ∈ 𝐼, 𝑗 ∈
𝐽, 𝑘 ∈ 𝐾 (15)
3. 3. Determining the Importance of Travel Time, Travel Cost and Service Quality 𝑓𝑐, 𝑓𝑡 and 𝑓𝑞 represent the degree of importance of the parameters of travel time, travel cost and service quality of hubs for travelers. To determine them, we used data gathered by questionnaires from air travelers with different income levels, ages, and travel purposes. Also, we introduced the interpolation function of importance for time and cost in air travels by using a multivariate Lagrange interpolation
method. Lagrange interpolation function with 𝑚
variables and degree 𝑛 is defined as Equation (16) ([21]):
𝑓(𝑋1, 𝑋1, ⋯ , 𝑋𝑚) = ∑𝑒𝑖.1≤𝑛𝛼𝑒𝑖𝑋
𝑒𝑖 (16)
where 𝑒𝑖= (𝑒1𝑖, ⋯ , 𝑒𝑚𝑖) and ∑𝑚𝑗=1𝑒𝑗𝑖= 1.
In order to uniquely determine𝑓, we require 𝜌 =
(𝑛 + 𝑚
(𝑥1,𝑖, ⋯ , 𝑥𝑚,𝑖, 𝑓𝑖) ∈ 𝑅𝑚+1 , 1 ≤ 𝑖 ≤ 𝜌, 𝑓𝑖=
𝑓(𝑥1,𝑖, ⋯ , 𝑥𝑚,𝑖) (17)
By calculating the degree of importance of travel time, travel cost and service quality of airport and by taking quality, safety and travel time delay of the follower and leader airline into account, parameters 𝑝1, 𝑝2, 𝑞1, 𝑞2 and
𝑟1, 𝑟2 are determined as Equation (18).
𝑝1= 𝑓𝑐∗ ( 𝑈𝑓 𝑈𝑙) ∗ (
𝑆𝑓 𝑆𝑙) ∗ (
𝑡𝑙 𝑡𝑓)
(18) 𝑝2= (𝑓𝑐+ 𝑓𝑞) ∗ (
𝑈𝑓 𝑈𝑙) ∗ (
𝑆𝑓 𝑆𝑙) ∗ (
𝑡𝑙 𝑡𝑓)
𝑞1= 𝑓𝑡∗ ( 𝑈𝑓 𝑈𝑙) ∗ (
𝑆𝑓 𝑆𝑙) ∗ (
𝑡𝑙 𝑡𝑓)
𝑞2= (𝑓𝑡+ 𝑓𝑞) ∗ ( 𝑈𝑓 𝑈𝑙) ∗ (
𝑆𝑓 𝑆𝑙) ∗ (
𝑡𝑙 𝑡𝑓)
𝑟1= (𝑓𝑐+ 𝑓𝑡) ∗ ( 𝑈𝑓 𝑈𝑙) ∗ (
𝑆𝑓 𝑆𝑙) ∗ (
𝑡𝑙 𝑡𝑓)
𝑟2= (𝑓𝑐+ 𝑓𝑡+ 𝑓𝑞) ∗ ( 𝑈𝑓 𝑈𝑙) ∗ (
𝑆𝑓 𝑆𝑙) ∗ (
𝑡𝑙 𝑡𝑓)
4. ROBUST OPTIMIZATION
In this section, we presented a robust counterpart of the model proposed in section 3 by employing Bertsimas and Sim's approach [5]. Given the impact of seasonal changes (such as travel in the high season) and weather conditions on the number of travelers, we consider 𝑤𝑖𝑗as uncertain. The values of the uncertain parameters 𝑤̃𝑖𝑗 are selected based on a symmetric distribution in the interval
[𝑤𝑖𝑗− 𝑤̑𝑖𝑗, 𝑤𝑖𝑗+ 𝑤̑𝑖𝑗]with an average of 𝑤𝑖𝑗.
The notations used in the proposed robust model are as follows:
Sets:
𝐹𝑐𝑜𝑛𝑠𝑡= {(𝑖, 𝑗)|𝑊
𝑖𝑗ℎ𝑎𝑠𝑛𝑜𝑖𝑠𝑒(𝑊̑𝑖𝑗> 0)}, 𝑐𝑜𝑛𝑠𝑡 = 1, … ,7
∪7 |𝐹𝑐𝑜𝑛𝑠𝑡| ≤ |𝐼| × |𝐽|
𝑜𝑛𝑠𝑡=1
Parameters:
𝑊̑𝑖𝑗 Deviation from 𝑤𝑖𝑗
𝛤𝑖𝑗𝑐𝑜𝑛𝑠𝑡 Number of uncertain parameters 𝑤𝑖𝑗
Decision variables:
𝑃𝑖𝑗𝑓𝑐𝑜𝑛𝑠𝑡𝑐𝑜𝑛𝑠𝑡, 𝑧𝑖𝑗𝑐𝑜𝑛𝑠𝑡 Dual auxiliary variables
𝐻
The variable defined to include right-hand side vector 𝑏as a column of technical matrix 𝐴
4. 1. Robust Model Formulation Given the fact that uncertain parameters
𝑤
𝑖𝑗are included inConstraints (2) to (8), we employed Bertsimas and Sim's approach [5] and by defining variable H, we showed the above mentioned constraints in the form of Constraints (19) to (26):
∑ 𝑥𝑘𝑗𝑖1
𝑘∈𝑁𝑖𝑗1 − 𝑊𝑖𝑗(𝑓𝑐)( 𝑈𝑓 𝑈𝑙)(
𝑆𝑓 𝑆𝑙)(
𝑡𝑙
𝑡𝑓)𝐻 ≤ 0∀𝑖 ∈ 𝐼, 𝑗 ∈ 𝐽 (19)
∑𝑘∈𝑁𝑖𝑗2𝑥𝑘𝑗𝑖2− 𝑊𝑖𝑗(𝑓𝑐+ 𝑓𝑞) (𝑈𝑓 𝑈𝑙) (
𝑆𝑓 𝑆𝑙) (
𝑡𝑙
𝑡𝑓) 𝐻 ≤ 0 ∀𝑖 ∈ 𝐼, 𝑗 ∈ 𝐽
(20)
∑𝑘∈𝑀𝑖𝑗1𝑦𝑘𝑗𝑖1− 𝑊𝑖𝑗(𝑓𝑡)(𝑈𝑓 𝑈𝑙)(
𝑆𝑓 𝑆𝑙)(
𝑡𝑙
𝑡𝑓)𝐻 ≤ 0∀𝑖 ∈ 𝐼, 𝑗 ∈ 𝐽 (21)
∑𝑘∈𝑀𝑖𝑗2𝑦𝑘𝑗𝑖2− 𝑊𝑖𝑗(𝑓𝑡+ 𝑓𝑞) (𝑈𝑓 𝑈𝑙) (
𝑆𝑓 𝑆𝑙) (
𝑡𝑙
𝑡𝑓) 𝐻 ≤ 0 ∀𝑖 ∈ 𝐼, 𝑗 ∈ 𝐽
(22)
∑𝑘∈𝑃𝑖𝑗1𝑧𝑘𝑗𝑖1− 𝑊𝑖𝑗(𝑓𝑐+ 𝑓𝑡) (𝑈𝑓 𝑈𝑙) (
𝑆𝑓 𝑆𝑙) (
𝑡𝑙
𝑡𝑓) 𝐻 ≤ 0 ∀𝑖 ∈ 𝐼, 𝑗 ∈ 𝐽
(23)
∑ 𝑧𝑘𝑗𝑖2
𝑘∈𝑃𝑖𝑗2 ≤ 𝑊𝑖𝑗(𝑓𝑐+ 𝑓𝑡+ 𝑓𝑞) ( 𝑈𝑓 𝑈𝑙) (
𝑆𝑓 𝑆𝑙) (
𝑡𝑙
𝑡𝑓) 𝐻 ≤ 0 ∀𝑖 ∈ 𝐼, 𝑗 ∈ 𝐽
(24)
∑2𝑠=1(∑𝑘∈𝐾𝑥𝑘𝑗𝑖𝑠 + ∑𝑘∈𝐾𝑦𝑘𝑗𝑖𝑠 + ∑𝑘∈𝐾𝑧𝑘𝑗𝑖𝑠) − 𝑊𝑖𝑗(
𝑈𝑓 𝑈𝑙)(
𝑆𝑓 𝑆𝑙)(
𝑡𝑙
𝑡𝑓)𝐻 ≤ 0 ∀𝑖 ∈ 𝐼, 𝑗 ∈ 𝐽
(25)
0 ≤ 𝐻 ≤ 1 (26)
Given the fact that Constraints (19) to (26) are defined for each 𝑖and each𝑗, constraints itself subjects to
maximum 𝑖 × 𝑗constraints. Since each of those
constraints had only ones 𝑤𝑖𝑗, we got 𝛤𝑖𝑗𝑐𝑜𝑛𝑠𝑡∈
[0, |𝐹𝑐𝑜𝑛𝑠𝑡|] , where,𝐹𝑐𝑜𝑛𝑠𝑡 ⊆ {0,1}. Based on research by Bertsimas and Sim [5], Constraint (19) is turned into Constraint (27).
∑ 𝑥𝑘𝑗𝑖1
𝑘∈𝑁𝑖𝑗1 − 𝑊𝑖𝑗(𝑓𝑐)( 𝑈𝑓 𝑈𝑙)(
𝑆𝑓 𝑆𝑙)(
𝑡𝑙 𝑡𝑓)𝐻 +
𝑚𝑎𝑥 ∀(𝑖,𝑗)∈𝐹1{
⌊𝛤𝑖𝑗1⌋𝑤̑𝑖𝑗(𝑓𝑐)( 𝑈𝑓 𝑈𝑙)(
𝑆𝑓 𝑆𝑙)(
𝑡𝑙 𝑡𝑓)𝐻
+(𝛤𝑖𝑗1− ⌊𝛤𝑖𝑗1⌋)𝑤̑𝑖𝑗(𝑓𝑐)( 𝑈𝑓 𝑈𝑙)(
𝑆𝑓 𝑆𝑙)(
𝑡𝑙 𝑡𝑓)𝐻
} ≤ 0
∀𝑖 ∈ 𝐼, 𝑗 ∈ 𝐽
(27)
Similarly, Constraints (20) to (26) are modified.
Then, by proving the theorem 1, we showed that Constraint (27) is equal to a linear optimization problem. The way of proving the theorem proving for other similar constraints was the same.
Theorem 1. For providing 𝐻∗, Function (28):
𝛽1(𝐻∗, 𝛤𝑖𝑗1) =
𝑚𝑎𝑥 ∀(𝑖,𝑗)∈𝐹1{
⌊𝛤𝑖𝑗1⌋𝑤̑𝑖𝑗(𝑓𝑐)( 𝑈𝑓 𝑈𝑙)(
𝑆𝑓 𝑆𝑙)(
𝑡𝑙 𝑡𝑓)𝐻
∗
+(𝛤𝑖𝑗1− ⌊𝛤𝑖𝑗1⌋)𝑤̑𝑖𝑗(𝑓𝑐)( 𝑈𝑓 𝑈𝑙)(
𝑆𝑓 𝑆𝑙)(
𝑡𝑙 𝑡𝑓)𝐻
∗}
is equal to the linear programming problem below.
𝛽1(𝐻∗, 𝛤𝑖𝑗1) = 𝑚𝑎𝑥 𝑤̑𝑖𝑗(𝑓𝑐)( 𝑈𝑓 𝑈𝑙)(
𝑆𝑓 𝑆𝑙)(
𝑡𝑙 𝑡𝑓)𝐻
∗𝑧 𝑖𝑗
𝑠. 𝑡. 𝑧𝑖𝑗≤ 𝛤𝑖𝑗1 0 ≤ 𝑧𝑖𝑗≤ 1∀(𝑖, 𝑗) ∈ 𝐹1
(29)
Proof. We proved the theorem in two cases:
Case 1:𝛤𝑖𝑗1 is an integer.
So 𝛤𝑖𝑗1∈ [0,1], then𝛤𝑖𝑗1= 1. In this case, 𝛽1(𝐻∗, 𝛤𝑖𝑗1) is equal to:
𝛽1(𝐻∗, 𝛤𝑖𝑗1) =
𝑚𝑎𝑥
∀(𝑖,𝑗)∈𝐹1{𝑤̑𝑖𝑗(𝑓𝑐)( 𝑈𝑓 𝑈𝑙)(
𝑆𝑓 𝑆𝑙)(
𝑡𝑙 𝑡𝑓)𝐻
∗}=
𝑤̑𝑖𝑗(𝑓𝑐)( 𝑈𝑓 𝑈𝑙)(
𝑆𝑓 𝑆𝑙)(
𝑡𝑙 𝑡𝑓)𝐻
∗
(30)
Because the optimization problem was a maximization one, then, we considered𝑧𝑖𝑗 = 𝛤𝑖𝑗1= 1. Therefore, the problem can become feasible and the optimal value of objective function is equal to:
𝑤̑𝑖𝑗(𝑓𝑐)( 𝑈𝑓 𝑈𝑙)(
𝑆𝑓 𝑆𝑙)(
𝑡𝑙 𝑡𝑓)𝐻
∗
(31)
Hence, in this case, Equation (29) is correct.
Case 2: 𝛤𝑖𝑗1 is non-integer.
So 𝛤𝑖𝑗1∈ [0,1], then ⌊𝛤𝑖𝑗1⌋ = 0. In this case, 𝛽1(𝐻∗, 𝛤𝑖𝑗1) is equal to:
𝛽1(𝐻∗, 𝛤𝑖𝑗1) = 𝑚𝑎𝑥∀(𝑖,𝑗)∈𝐹1{(𝛤𝑖𝑗
1−
0)𝑤̑𝑖𝑗(𝑓𝑐)( 𝑈𝑓 𝑈𝑙)(
𝑆𝑓 𝑆𝑙)(
𝑡𝑙 𝑡𝑓)𝐻
∗}=
𝛤𝑖𝑗1𝑤̑𝑖𝑗(𝑓𝑐)( 𝑈𝑓 𝑈𝑙)(
𝑆𝑓 𝑆𝑙)(
𝑡𝑙 𝑡𝑓)𝐻
∗
(32)
Because the optimization problem was a maximization one, then we considered 𝑧𝑖𝑗 = 𝛤𝑖𝑗1. Therefore, the problem can become feasible and the optimal value of objective function is equal to:
𝛤𝑖𝑗1𝑤̑ 𝑖𝑗(𝑓𝑐)(
𝑈𝑓 𝑈𝑙)(
𝑆𝑓 𝑆𝑙)(
𝑡𝑙 𝑡𝑓)𝐻
∗
(33)
Hence, in this case, Equation (29) is correct.
By using theorem 1 and taking advantage of Strong duality theorem, it can be shown that the robust counterpart of robust model presented in section 3 is as following:
(1,10 − 15)
(34) ∑𝑘∈𝑁𝑖𝑗1𝑥𝑘𝑗𝑖1− 𝑊𝑖𝑗(𝑓𝑐)(𝑈𝑓
𝑈𝑙)( 𝑆𝑓 𝑆𝑙)(
𝑡𝑙 𝑡𝑓)𝐻+𝑧𝑖𝑗
1𝛤 𝑖𝑗1+ ∑𝑓1∈𝐹1𝑃𝑖𝑗𝑓1 1 ≤ 0∀𝑖 ∈ 𝐼, 𝑗 ∈ 𝐽
∑𝑘∈𝑁𝑖𝑗2𝑥𝑘𝑗𝑖2− 𝑊𝑖𝑗(𝑓𝑐+ 𝑓𝑞)( 𝑈𝑓 𝑈𝑙)(
𝑆𝑓 𝑆𝑙)(
𝑡𝑙 𝑡𝑓)𝐻+𝑧𝑖𝑗
2𝛤 𝑖𝑗2+ ∑𝑓2∈𝐹2𝑃𝑖𝑗𝑓2 2 ≤ 0 ∀𝑖 ∈ 𝐼, 𝑗 ∈ 𝐽
∑𝑘∈𝑀𝑖𝑗1𝑦𝑘𝑗𝑖1− 𝑊𝑖𝑗(𝑓𝑡)(𝑈𝑓 𝑈𝑙)(
𝑆𝑓 𝑆𝑙)(
𝑡𝑙 𝑡𝑓)𝐻+𝑧𝑖𝑗
3𝛤 𝑖𝑗3+
∑𝑓3∈𝐹3𝑃𝑖𝑗𝑓3 3 ≤ 0∀𝑖 ∈ 𝐼, 𝑗 ∈ 𝐽
∑𝑘∈𝑀𝑖𝑗2𝑦𝑘𝑗𝑖2− 𝑊𝑖𝑗(𝑓𝑡+ 𝑓𝑞)(𝑈𝑓 𝑈𝑙)(
𝑆𝑓 𝑆𝑙)(
𝑡𝑙 𝑡𝑓)𝐻+𝑧𝑖𝑗
4𝛤 𝑖𝑗4+ ∑𝑓4∈𝐹4𝑃𝑖𝑗𝑓4 4 ≤ 0 ∀𝑖 ∈ 𝐼, 𝑗 ∈ 𝐽
∑𝑘∈𝑃𝑖𝑗1𝑧𝑘𝑗𝑖1− 𝑊𝑖𝑗(𝑓𝑐+ 𝑓𝑡)(𝑈𝑓 𝑈𝑙)(
𝑆𝑓 𝑆𝑙)(
𝑡𝑙 𝑡𝑓)𝐻+𝑧𝑖𝑗
5𝛤 𝑖𝑗5+ ∑𝑓5∈𝐹5𝑃𝑖𝑗𝑓5 5 ≤ 0 ∀𝑖 ∈ 𝐼, 𝑗 ∈ 𝐽
∑𝑘∈𝑃𝑖𝑗2𝑧𝑘𝑗𝑖2− 𝑊𝑖𝑗(𝑓𝑐+ 𝑓𝑡+ 𝑓𝑞)(𝑈𝑓 𝑈𝑙)(
𝑆𝑓 𝑆𝑙)(
𝑡𝑙 𝑡𝑓)𝐻 +𝑧𝑖𝑗6𝛤𝑖𝑗6+ ∑𝑓6∈𝐹6𝑃𝑖𝑗𝑓6 6≤ 0 ∀𝑖 ∈ 𝐼, 𝑗 ∈ 𝐽
∑2𝑠=1(∑𝑘∈𝐾𝑥𝑘𝑗𝑖𝑠 + ∑𝑘∈𝐾𝑦𝑘𝑗𝑖𝑠 + ∑𝑘∈𝐾𝑧𝑘𝑗𝑖𝑠) − 𝑊𝑖𝑗(
𝑈𝑓 𝑈𝑙)(
𝑆𝑓 𝑆𝑙)(
𝑡𝑙 𝑡𝑓)𝐻+𝑧𝑖𝑗
7𝛤 𝑖𝑗7+ ∑𝑓7∈𝐹7𝑃𝑖𝑗𝑓7 7 ≤ 0 ∀𝑖, 𝑗
𝑊̑𝑖𝑗((𝑓𝑐) ( 𝑈𝑓 𝑈𝑙) (
𝑆𝑓 𝑆𝑙) (
𝑡𝑙
𝑡𝑓)) 𝐻 ≤ 𝑧𝑖𝑗
1 +𝑃
𝑖𝑗𝑓1 1
∀𝑖 ∈ 𝐼, 𝑗 ∈ 𝐽, 𝑓1∈ 𝐹1
𝑊̑𝑖𝑗((𝑓𝑐+ 𝑓𝑞)( 𝑈𝑓 𝑈𝑙)(
𝑆𝑓 𝑆𝑙)(
𝑡𝑙
𝑡𝑓))𝐻 ≤ 𝑧𝑖𝑗
2+ 𝑃
𝑖𝑗𝑓2 2 ∀𝑖 ∈ 𝐼, 𝑗 ∈ 𝐽, 𝑓2∈ 𝐹2
𝑊̑𝑖𝑗((𝑓𝑡) ( 𝑈𝑓 𝑈𝑙) (
𝑆𝑓 𝑆𝑙) (
𝑡𝑙
𝑡𝑓)) 𝐻 ≤ 𝑧𝑖𝑗
3+ 𝑃
𝑖𝑗𝑓3 3
∀𝑖 ∈ 𝐼, 𝑗 ∈ 𝐽, 𝑓3∈ 𝐹3
𝑊̑𝑖𝑗((𝑓𝑡+ 𝑓𝑞)( 𝑈𝑓 𝑈𝑙)(
𝑆𝑓 𝑆𝑙)(
𝑡𝑙
𝑡𝑓))𝐻 ≤ 𝑧𝑖𝑗
4+ 𝑃
𝑖𝑗𝑓4 4 ∀𝑖 ∈ 𝐼, 𝑗 ∈ 𝐽, 𝑓4∈ 𝐹4
𝑊̑𝑖𝑗((𝑓𝑐+ 𝑓𝑡)( 𝑈𝑓
𝑈𝑙)( 𝑆𝑓 𝑆𝑙)(
𝑡𝑙
𝑡𝑓))𝐻 ≤ 𝑧𝑖𝑗
5+ 𝑃
𝑖𝑗𝑓5 5 ∀𝑖 ∈ 𝐼, 𝑗 ∈ 𝐽, 𝑓5∈ 𝐹5
𝑊̑𝑖𝑗((𝑓𝑐+ 𝑓𝑡+ 𝑓𝑞) ( 𝑈𝑓 𝑈𝑙) (
𝑆𝑓 𝑆𝑙) (
𝑡𝑙
𝑡𝑓)) 𝐻 ≤ 𝑧𝑖𝑗
6+
𝑃𝑖𝑗𝑓6 6 ∀𝑖 ∈ 𝐼, 𝑗 ∈ 𝐽, 𝑓6∈ 𝐹6
𝑊̑𝑖𝑗(( 𝑈𝑓 𝑈𝑙) (
𝑆𝑓 𝑆𝑙) (
𝑡𝑙
𝑡𝑓)) 𝐻 ≤ 𝑧𝑖𝑗
7+ 𝑃
𝑖𝑗𝑓7 7
∀𝑖 ∈ 𝐼, 𝑗 ∈ 𝐽, 𝑓7∈ 𝐹7
𝑧𝑖𝑗𝑐𝑜𝑛𝑠𝑡, 𝑃𝑖𝑗𝑓𝑐𝑜𝑛𝑠𝑡𝑐𝑜𝑛𝑠𝑡≥ 0
∀𝑖 ∈ 𝐼, 𝑗 ∈ 𝐽, 𝑓𝑐𝑜𝑛𝑠𝑡∈ 𝐹𝑐𝑜𝑛𝑠𝑡, 𝑐𝑜𝑛𝑠𝑡 ∈ {1,2, ⋯ ,7}
5. COMPUTATIONAL RESULTS
Aseman Airline could play the role of follower airlines. Also, the results are compared with the results of the Marianov et al. [1] model implementation.
By using the results of 400 distributed questionnaires, can be shown that:
𝑓𝑡= 47%, 𝑓𝑐= 30%, 𝑓𝑞= 23% (35)
According to Equation (35) and assuming that 𝑈𝑓 𝑈𝑙 = 0.4, 𝑆𝑓
𝑆𝑙 = 0.2 and 𝑡𝑙
𝑡𝑓= 0.25, values of parameters
𝑝1, 𝑝2, 𝑞1, 𝑞2, 𝑟1 and 𝑟2 are presented as Equation (36) by substituting the above-mentioned values into Equation (18):
𝑝1= 0.006, 𝑝2= 0.011
𝑞1= 0.009, 𝑞2= 0.014
𝑟1= 0.015, 𝑟2= 0.02
(36)
The data needed for the implementation of the model can be found in Appendix A.
5. 1. Implementation of Deterministic Model
Based on the above-mentioned information, we implemented the model with values 𝛽1= 1 and 𝛾1= 1. The optimal value of the objective function was 𝑍∗=
889,333$. Whereas the optimal value of Marianov et al. [1] model is 𝑍∗= 848,566$. The optimal solution is achieved by using the GAMS software and the Baron solving method. Therefore, it can be concluded that the location of hubs in this paper leads to a significant increase in the incomes of the follower airline. Table 1 shows the share of follower airline's hubs from leader airline’s travelers.
According to Table 1, in our mode Imam Khomeini
and Mashhad airports with 627 and 328 travelers had the largest international traffics among Iranian airports, respectively and in Marianov et al. [1] model Imam Khomeini and Isfahan airports with 485 and 316 travelers had the largest international traffics among Iranian airports, respectively.
Considering the $859 as the average travel cost per passenger, it can be concluded that the transportation cost of 138 passengers (the difference between 8,460 and 8,322) is $118,542. Thus, transporting 8,322 passengers via the Mariano et al. [1] network would result in $5,084,192 in revenue for the follower airline. As a result, it can be concluded that by exploiting the model presented in this paper as well as using the follower airline for passenger transportation, an extra $44 per passenger would be generated in revenue for the follower airline.
As shown in Table 1, in our model, nearly 2% of 75,710 travelers of leader airline (1,467 travelers) were attracted by hubs of follower airline. Based on information about Emirate Airline, it could be said that the cost of passing existing travelers was $1,252,088. Therefore, we concluded that the alliance of Iranian airlines and using their competitive edge not only lead to an increase in their market share by $889,333 but also decreased the ticket costs for travelers by 362,775 dollars. In fact, if 𝛽1= 1 and 𝛾1= 1, on average, there would be about $247 reduction in ticket price per traveler. Furthermore, it could be said that the time needed to move all existing travelers (in Table 1) by Emirate Airline was about 21,000 hours, while this time for an alliance of Iranian airlines was about 18,607 hours. In fact, when we use the alliance of Iranian airlines and their under-controlled hubs, travel time per traveler was decreased about 40 minutes on average.
TABLE 1. Number of travelers passing from the follower's airports
Number of travelers
𝒋𝟏 𝒋𝟐 𝒋𝟑 𝒋𝟒 𝒋𝟓
Our paper Marianov Our paper Marianov Our paper Marianov Our paper Marianov Our paper Marianov
𝑖1
38(𝑘1)
43(𝑘4)
32(𝑘1) 47(𝑘3)
14(𝑘8)
14(𝑘4)
38(𝑘1)
57(𝑘4)
81(𝑘1)
24(𝑘5)
26(𝑘5)
43(𝑘6) 36(𝑘6) 20(𝑘4) 13(𝑘6) 17(𝑘8) 24(𝑘5) 57(𝑘6)
𝑖2
24(𝑘2) 55(𝑘1) 25(𝑘1) 25(𝑘1)
14(𝑘2) 14(𝑘1)
38(𝑘2) 38(𝑘1) 36(𝑘1) 20(𝑘5)
57(𝑘5) 8(𝑘3) 29(𝑘2) 29(𝑘3) 43(𝑘8) 43(𝑘4) 32(𝑘2) 47(𝑘6)
𝑖3
43(𝑘1)
81(𝑘3)
38(𝑘2) 38(𝑘1) 19(𝑘2) 28(𝑘1)
81(𝑘1)
38(𝑘1)
68(𝑘1)
20(𝑘4)
38(𝑘5) 43(𝑘6) 43(𝑘3) 21(𝑘6) 30(𝑘4) 43(𝑘4) 47(𝑘5)
𝑖4 28(𝑘5)
19(𝑘1) 19(𝑘1) 12(𝑘3)
7(𝑘6) 10(𝑘6)
21(𝑘1)
21(𝑘1)
21(𝑘1) 28(𝑘5)
22(𝑘6) 21(𝑘6) 28(𝑘6) 19(𝑘2) 19(𝑘2) 12(𝑘5)
𝑖5
38(𝑘2) 57(𝑘1) 38(𝑘1)
19(𝑘1)
14(𝑘6)
19(𝑘1)
43(𝑘1)
57(𝑘1)
43(𝑘1)
57(𝑘1)
38(𝑘4) 20(𝑘2)
Different modes are presented in Table 2 for discounting the ticket price via our model. These modes are provided for situations in which the airline's revenue is significantly higher than the revenue obtained via the Mariano et al. [1] model.
5. 2. Implementation of Robust Model Based on the above-mentioned information, we implemented the robust model in a situation where all parameters 𝑤𝑖𝑗 were uncertain. By uncertainty of all parameters 𝑤𝑖𝑗, we mean that:
𝛤𝑖𝑗𝑐𝑜𝑛𝑠𝑡= 1, ∀𝑖 ∈ 𝐼, 𝑗 ∈ 𝐽, 𝑐𝑜𝑛𝑠𝑡 ∈ {1,2, … ,7} (37)
Also, we supposed that:
𝑤̑𝑖𝑗= 0.1 ∗ 𝑤𝑖𝑗∀𝑖 ∈ 𝐼, 𝑗 ∈ 𝐽 (38)
The optimal value of the objective function for 𝛽1= 1 and 𝛾1= 1 was 𝑍∗= 822,896$.
Given the results of implementing the model in the mode of uncertainty, it was clear that Iranian airlines were accounted for 1.8% of travelers of Emirate Airline (i.e. 1,345 travelers). In fact, the number of travelers absorbed by Iranian airlines was decreased by 122 people in uncertainty mode, which in turn led to a decrease in revenue of Iranian airlines by $66,437.
Based on information about Emirate Airline, it could be said that the cost of passing existing travelers was $1,252,088. Therefore, we concluded that an alliance of Iranian airlines and using their competitive edge not only lead to an increase in their market share by $822,896 but also decreased the ticket costs for travelers by $429,192. In fact, if 𝛽1= 1 and 𝛾1= 1, on average, there would be about $364 reduction in ticket price per traveler. Furthermore, it could be said that the time needed to move all existing travelers (in Table 1) by Emirate Airline was about 21,000 hours, while this time for an alliance of Iranian airlines was about 19,516 hours. In fact, when we use the alliance of Iranian airlines and their under-controlled hubs, travel time per traveler was decreased by about 59 minutes on average.
5. 3. Sensitivity Analysis and Managerial Insights
To assess the impact of quality and safety of follower airline and the number of their under-controlled hubs in value of 𝑧, We implemented the model with different values for 𝑈𝑓, 𝑈𝑙, 𝑆𝑓, 𝑆𝑙and|𝐾| in the mode of uncertainty. The results are presented in Tables 3 to 4. Table 3 indicates the impact of the number of airports controlled by follower airline on the value of the objective function.
TABLE 2. Discount factor
Discount factors 𝜷𝟏= 𝟏,
𝜸𝟏= 𝟎. 𝟗𝟎𝟒
𝜷𝟏= 𝟎. 𝟗,
𝜸𝟏= 𝟏
𝜷𝟏= 𝟎. 𝟗,
𝜸𝟏= 𝟎. 𝟗𝟔
𝑧 829,276 850,640 829,358
TABLE 3. Sensitivity analysis of the number of airports
6 7
6 5
|𝑲|
822,896 812,335
806,761 779,997
𝑧
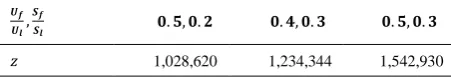
TABLE 4. Sensitivity analysis of quality and safety
𝟎. 𝟓, 𝟎. 𝟑
𝟎. 𝟒, 𝟎. 𝟑
𝟎. 𝟓, 𝟎. 𝟐
𝑼𝒇
𝑼𝒍,
𝑺𝒇
𝑺𝒍
1,542,930 1,234,344
1,028,620 𝑧
As shown in Table 3, an increase in the number of hub airports of the follower airline led to an increase in the value of the objective function. By simple calculations, it could be shown that adding one airport to airports controlled by follower airline led to a 1% increase in revenue of follower airline.
Table 4 shows the impact of the quality and safety of the follower airline on the value of the objective function. The first column of Table 4 showed that a 10% increase in quality of follower airline led to a 25% increase in the value of the objective function. While a 10% increase in safety of follower airline (second column of Table 4) led to a 50% increase in revenue of follower airline. Therefore, it could be concluded that the safety of airlines was more effective in traveler attraction and revenue increase. The third column of Table 4 showed that a 10% increase in each of the parameters of quality and safety of follower airline led to a nearly 88% increase in the value of the objective function.
To examine the impact of the number of uncertain parameters, we considered Table 5. According to Table 5, the more uncertain parameters in the model, the worst value of the objective function. For example, when all 25 parameters 𝑤𝑖𝑗 were uncertain, with the following deviation value:
𝑤̑𝑖𝑗= 0.3 ∗ 𝑤𝑖𝑗 (39)
TABLE 5. Impact of uncertain parameter
𝒛∗
𝒘̑𝒊𝒋
𝜞𝒊𝒋𝒄𝒐𝒏𝒔𝒕
752,522
0.1(𝑤𝑖𝑗)
15 0.2(𝑤𝑖𝑗) 703,113
648,804
0.3(𝑤𝑖𝑗)
743,839
0.1(𝑤𝑖𝑗)
20 0.2(𝑤𝑖𝑗) 685,724
622,722
0.3(𝑤𝑖𝑗)
725,891
0.1(𝑤𝑖𝑗)
25 0.2(𝑤𝑖𝑗) 649,382
568,208
Then, the value of the objective function was equal to $568,208, which was $254,688 lower than the optimal value of a certain model ($822,896). Some managerial insights from the study findings are summarized below.
However, calculations results based on cost and travel time parameters, suggest the transfer of some international travelers through Iranian airports, but given the low quality of services provided at these airports, it is necessary for satisfying the travelers and increasing numbers of them in the future, increase the quality of services provided in them. Given the geographical location of airports in Iran, under the conditions of post-sanctions and if the quality and satisfaction of Iranian airlines reach the level of quality and satisfaction of Emirate airline, their earnings will increase to 2.5 times the current level.
6. CONCLUSION
In this paper, to determine the exact location of hubs we develop the model of Marianov et al. [1] by defining a new type of capture sets under uncertainty in which the follower airline attracted a percentage of the leader airline's travelers. We divided the nominated airports for follower airline's hub into six independent categories by comparing parameters of travel time, travel cost, and service quality of airports of follower airline and leader
airline. By employing multivariate Lagrange
interpolation function, we determined the degree of importance of time and cost of travel from the traveler's perspective. By using the degree of importance of time and cost of travel, as well as comparing the parameters of quality, safety, and delays between leader airline and follower airline, we allocated travelers to those six-fold sets. Based on the seasonal demand of travelers used by local travelers; we considered travel demand of hubs as uncertain parameters. To determine the robust counterpart of this category of hub location problem, a robust optimization method of Bertsimas and Sim [5] was used. The results show that the follower airline's income has a considerable growth compared to the Marianov et al. [1] model and can absorb nearly 2% of travelers of the leader airline due to lower travel costs and travel time compared to that of leader airline. By examining the change in model's parameters, we found that improvement of quality and safety of constituent airlines in follower airlines and an increase in the number of their under-controlled hubs had a positive impact on revenue of follower airline.
7. REFERENCES
1. Marianov, V. Serra, D. and ReVelle, C., "Location of hubs in a competitive environment", European Journal of Operational Research, Vol. 114 , No. 2, (1999), 363-371.
2. Wagner, B., "A note on "location of hubs in a competitive environment"", European Journal of Operational Research, Vol. 184, No. 1, (2008), 57-62.
3. Soyster, A. L., "Convex programming with set-inclusive constraints and applications to inexact linear programming",
Operations research, Vol. 21, No. 5, (1973), 1154-1157. 4. Ben-Tal, A. and Nemirovski, A., "Robust solutions of uncertain
linear programs", Operations research letters, Vol. 25, No.1, (1999), 1-13.
5. Bertsimas, D. and Sim, M., "The price of robustness", Operations research, Vol. 52, No.1, (2004), 35-53.
6. Sasaki, M. and Fukushima, M., "Stackelberg hub location problem", Journal of the Operations Research Society of Japan, Vol. 44, No. 4, (2001), 390-402.
7. Sasaki, M., "Hub network design model in a competitive environment with flow threshold", Journal of the Operations Research Society of Japan, Vol. 48, No. 2, (2005), 158-171. 8. Sasaki, M. Campbell, J. F. Krishnamoorthy, M. and Ernst, A. T.,
"Designing hub and spoke transportation systems for a competitive environment", in International Conference on Industrial Engineering and Systems Management, (2009), 13-15. 9. Eiselt, H. A. and Marianov, V., "A conditional p-hub location problem with attraction functions", Computers & Operations Research, Vol. 36, No. 12, (2009), 3128-3135.
10. Lin, M. H., "Strategic airline alliances and endogenous Stackelberg equilibria", Transportation Research Part E: Logistics and Transportation Review, Vol. 40, No. 5, (2004), 357-384.
11. Zou, L. and Chen, X., "The effect of code-sharing alliances on airline profitability", Journal of Air Transport Management, Vol. 58, (2017), 50-57.
12. Yimga, J. O., "Airline code-sharing and its effects on on-time performance", Journal of Air Transport Management, Vol. 58, (2017), 76-90.
13. Nikoofal, M. E. and Sadjadi, S. J., "A robust optimization model for p-median problem with uncertain edge lengths", The International Journal of Advanced Manufacturing Technology, Vol. 50, No. 1-4, (2010), 391-397.
14. Ghaffari-Nasab, N. Ghazanfari, M. and Teimoury, E., "Robust optimization approach to the design of hub-and-spoke networks",
The International Journal of Advanced Manufacturing Technology, Vol. 76, No. 5-8, (2015), 1091-1110.
15. Zetina, C. A. Contreras, I. Cordeau, J. F. and Nikbakhsh, E., "Robust uncapacitated hub location", Transportation Research Part B: Methodological, Vol. 106, (2017), 393-410.
16. Tavakkoli-Moghaddam, R. Gholipour-Kananib, Y. and Shahramifarc, M., "A multi-objective imperialist competitive algorithm for a capacitated single-allocation hub location problem", International Journal of Engineering-Transactions C: Aspects, Vol. 26, No. 6, (2013), 605-612.
17. Ghodratnama, A., Tavakkoli-Moghaddam, R. and Baboli, A., "Comparing three proposed meta-heuristics to solve a new p-hub location-allocation problem", International Journal of Engineering-Transactions C: Aspects, Vol. 26, No. 9, (2013), 1043-1058.
18. Bashiri, M. and Rezanezhad, M., "A reliable multi-objective phub covering location problem considering of hubs capabilities",
International Journal of Engineering-Transactions B: Applications, Vol. 28, No. 5, (2015), 717-729.
20. Karimi, H., Bashiri, M. and Nickel, S., "Capacitated single allocation p-hub covering problem in multi-modal network using tabu search", International Journal of EngineeringTransactions C: Aspects, Vol. 29, No. 6, (2016), 797-808.
21. Saniee, K., "A Simple Expression for Multivariate Lagrange Interpolation", SIAM undergraduate research online, Vol. 1, No. 1, (2008), 1-9.
8. APPENDIX A
Data Needed for Implementation of the Model
Origins, destinations, and hub candidates of the follower airline are presented in Tables A1 and A2. Also, the service quality of airports and the capacity of hub candidates as well as the minimum number of passing travelers for being them as the hub are presented in Table
A3.The weekly average number of travelers transferred
by Emirate airport in the first six months of the year 2018 is presented in Table A4.
TABLE A1. Origins and destinations
Origin Destination
Label Airport Label Airport
𝑖1 Hamburg 𝑗1 Beijing
𝑖2 London 𝑗2 Bangkok
𝑖3 Stockholm 𝑗3 Kuala Lumpur
𝑖4 Paris 𝑗4 Delhi
𝑖5 Rome 𝑗5 Karachi
TABLE A2. Hub candidates of follower airline
𝑘8 𝑘7 𝑘6 𝑘5 𝑘4 𝑘3 𝑘2 𝑘1 Label Zahedan Yazd Bandar Abbas Shiraz Isfahan Tabriz Mashhad Imam Khomeini Airport
TABLE A3. Service quality, capacity and Minimum number
of passing travelers for being airport, as a hub
Airport quality(*) Service Capacity Minimum number
𝑘1 3 125,136 2,700
𝑘2 3 110,469 2,400
𝑘3 3 33,721 700
𝑘4 3 57,813 1,300
𝑘5 3 61,018 1,400
𝑘6 1 34,009 700
𝑘7 1 21,111 500
𝑘8 1 18,989 400
Dubai 4 - -
TABLE A4. Number of travelers
𝒋𝟓
𝒋𝟒
𝒋𝟑
𝒋𝟐
𝒋𝟏
Number of travelers
4,020 4,020 1,340 3,350 4,020 𝑖1 3,350 4,020 1,340 2,680 4,020 𝑖2 3,350 4,020 2,010 4,020 4,020 𝑖3 2,010 2,010 670 2,010 2,010 𝑖4 4,020 4,020 1,340 4,020 4,020 𝑖5
Development of a Model for Locating Hubs in a Competitive Environment under
Uncertainty: A Robust Optimization Approach
F. Nourzadeha, S. Ebrahimnejadb, K. Khalili-Damghania, A. Hafezalkotoba
a Department of Industrial Engineering, South Tehran Branch, Islamic Azad University, Tehran, Iran b Department of Industrial Engineering, Karaj Branch, Islamic Azad University, Karaj, Iran
P A P E R I N F O
Paper history: Received 25 August 2019
Received in revised form 30 September 2019 Accepted 08 November 2019
Keywords: Competitive Location
Multivariate Lagrange Interpolation Function Location Hub Robust Optimization هدیکچ نیا هلاقم هب روظنم نییعت تیعقوم باه ،اه لدم یاه نیشیپ لئاسم ناکم یبای روحم ار رد یاضف یتباقر هعسوت یم دهد . رد نیا هلاقم اب هسیاقم یاهرتماراپ هنیزه و نامز رفس و تیفیک تامدخ ،یهاگدورف اهروحم هب 6 هتسد میسقت یم دنوش . هجرد تیمها یاهرتماراپ نامز و هنیزه رفس اب هدافتسا زا شور نورد یبای دنچ هریغتم ژنارگلا صخشم یم ،دوش هک شقن یمهم ار رد صیصخت رفاسم هب یاهروحم نیلاریا وریپ یزاب یم دنک . رد همادا رب ساسا یاضاقت یلصف ،نارفاسم رتماراپ یاضاقت رفس ار هب تروص یعطقریغ رد رظن یم میریگ . یارب نییعت یاتمه راوتسا نیا هتسد زا لدم یاه ناکم یبای ،روحم شور هنیهب یزاس راوتسا هدافتسادروم رارق یم دریگ . ،تیاهنرد لدم هئارا هدش رد هلاقم یارب کی هلئسم یعقاو هدایپ یزاس یم ،دوش جیاتن یکاح زا نآ تسا هک دمآرد تکرش یاه ییامیپاوه وریپ دشر لباق یهجوت دراد و یم دناوت اب هجوت هب شهاک رد هنیزه و نامز ،رفس ًابیرقت 2 ٪ زا نارفاسم نیلاریا ربهر ار هب دوخ صاصتخا دهد .