299
Copyright © 2016. Vandana Publications. All Rights Reserved.
Volume-6, Issue-6, November-December 2016
International Journal of Engineering and Management Research
Page Number: 299-305
An Improved Image Steganography using High Potential Pixel Value
for Secret Data Hiding
Rajkumari Nagle1, Gaurav Soni2
1
M.Tech Student, Department of Computer Science & Engineering Technocrats Institute of Technology, Bhopal, INDIA
2Assistant Professor, Department of Computer Science & Engineering Technocrats Institute of Technology, Bhopal,
INDIA
ABSTRACT
In this proposed methodology introduced a new secret data hiding scheme for the image that is based on energy and cost matrix. The aim of steganography is to hide an information message within harmless cover medium in such way that it's not possible even to observe that secrete information. It doesn't replace cryptography however rather boosts the security using its obscurity options. In the projected its obscurity features. In the proposed algorithm we have used energy and cost matrix based pixel calculation for hide the data which improve the security level. In encryption, information is transformed in such a way that it cannot be detect by hacker. But during encryption, message is changed so it become distorted and intruder may suspect about the presence of important information. The output of our technique provides higher results because with the assistance of cropping an increased security than hiding data highly secured random theory based energy and cost matrix based pixels thus with this object destined steganography. The proposed shows good result as compare to other method on the basics of PSNR (Peak-Signal-to-Noise Ratio), mean square error (MSE) Payload capacity (PC) and structural similarity index measurement (SSIM). A part from performance parameter result like PSNR and MSE proposed method shows good result in terms of visually. Some method shows good PSNR and other parameter but when visual not shows good pixel values. Proposed Scheme shows good result in terms of visually as well as standard parameters.
Keywords— Steganography, Secret data (SD), Random pixel Selection, cover image (CI) and Stego image (SI)
I.
INTRODUCTIONWith advancements in digital communication technology and therefore the growth of PC power and storage, the difficulties in ensuring individuals‟ privacy become more and more difficult. The degrees to that people appreciate privacy dissent from one person to another. Numerous strategies are investigated and developed to shield personal privacy. Encoding is perhaps the most obvious one, and then comes steganography.
Encryption lends itself to noise and is usually determined while steganography isn't discernible. Interest
from the scientific community has escalated in the past few years in reference to steganography. This exhibits itself in the establishment of recent dedicated conferences and books, increased funding from defense ministries, and the birth of varied industrial firms. Unnecessary to mention that in a few countries, the burgeoning concern that results in this generosity is as a result of the widespread paranoia of criminals and terrorists who might or might not use this methodology to communicate. Therefore, funding in those countries was biased towards counter-attacking steganography and paid little concern to enhancing the privacy of individuals. Steganography algorithms to back up the human would like for privacy and another camp finding ways to defeat the recently developed strategies, stego analysis. This position is kind of different from the perspective taken with cryptography as an example. Governments invested with vast money and resources to create an unbreakable encoding algorithmic program. This has never been the case with steganography.
300
Copyright © 2016. Vandana Publications. All Rights Reserved.
II.
PROPOSED METHODOLOGY
The structure of proposed method is broadly divide into the two parts. Transmitter end and receiver end. The flow charts of both end is also described in this chapter. First describe the transmitter end. The transmitter end is based on the encoder part. In this end generate the information and also create the cover image (CI) and stego image (SI).
A. Transmitter end (Encoder Part)
The transmitter end is the important part of the proposed method. In the transmitter end is also known as an encoder part of the proposed method. In this part create the stego image (SI). Stego image is the summation of secret data and hiding object that is cover image (CI). In this part there are three important terms used here.
Cover image (CI)
Secret Data (SD)
Stego image (SI) Cover image (CI)
Cover image is the image in which secret data (SD) is hide. In the proposed work focused on spatial domain. It means that secret (SD) data is hide into the only in pixels. There are different type of cover image data sets are available in the field of image processing. In the proposed method used a standard data set images.
Secret Data (SD)
Secret data is the data in which is hide into the cover image. The quality of proposed work is based on the secret data. Secret data is generated at the user end and embedded into the cover image. Similar that secret data is obtain at the receiver end by stego image (SI). There are different type of secret data probable based on user end. In general secret data is in binary form, images and also ASCII based data available.
Stego Image (SI)
Stego image is created or generated when embedded the secret data into a cover image. The output if the summation of cover image and secret data is known as a stego image (SI).
Stego image is generated at the transmitter end (Tx) and flow in the communication channel (Internet world) like wide area network. This stego image is received at the receiver end (Rx). After the receiving of stego image apply the encoding process and obtain the secret information.
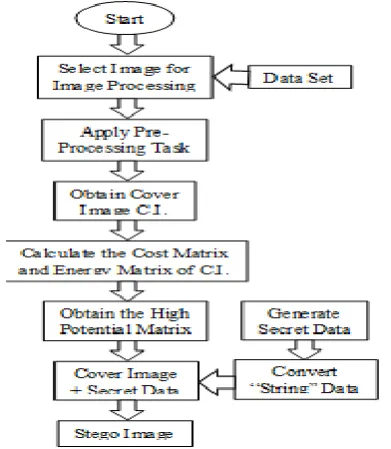
B. Steps of Transmitter End
In this part of proposed method shows the steps of implementation of proposed work.
First step– In this step select the image from data set. Selected image further processed for data hiding work. This selected image further convert into a cover image (CI). This cover image is used to create the stego image.
Second Step – After selecting the processing image apply preprocessing task in this image. In the preprocessing of the image, some basic image processing operation will perform in the selected image like gray scale converting, image resizing and other basic operations.
Third Step – After the completing of preprocessing task of the image.The image obtain that is cover image (CI). Cover
image is used to further processing of the proposed task of the image.
Fourth Step– In the cover image calculate the two important values that energy cost matrix of the selected cover image.
Energy Matrix (EM) of the image
An image which is nothing but a matrix is treated as a Markov Random Field (MRF) with each pixel as a node, each of which is associated with a random variable. Thus an undirected graph is formed. Each of the nodes (here, pixels) has neighbors which are actually the adjacent pixels. The distribution over the Markov Random Field is dependent on energy functions and clique potentials. Now, energy is used in many different contexts within the vast field of Image Processing. The key to MRF is that, through local communication, vast pieces of information can be propagated along the graphical model. Use this definition of energy as a „Measure of Information‟ in the proposed algorithm. For the purpose of explanation, consider an Image (I) with a 4 ×4 dimension. An eight bit image pixel with values in the range of 0 to 255 has been used. The given RGB image is converted to its grayscale. Apply Zeros and ones padding on the matrix.
The function optimally finds the correspondence between the pixel under consideration and its neighbors. The correspondence has been found out in both the directions and their conglomerated to obtain the energy function. Combine all E(x, y) to obtain the energy matrix E. The energy map E is thus obtained for the image. Calculating gradient of the image in both X and Y directions can then taking the mean square of the same can be regarded as yet another energy hypothesis.
212 73 145 199 Matrix = 149 193 19 239 140 192 13 33
Cost matrix (CM) of the image
301
Copyright © 2016. Vandana Publications. All Rights Reserved.
followed for the entire energy matrix E and thus we calculate the cost matrix C.
After calculation of the energy and cost matrix of the cover image. Cost matrix provide the pixel values of the image. The select pixel convert into a binary form then remove the LSB bit of the pixel value and add the secret information of the pixel.
Fifth Step - After embedding the secret information in the cover image. Create the stego image (SI). That is send to the communication channel.After completing the “stego image”. Transmitter end process is completed.
Fig2. Process of Encoding (Encoder) Transmitter end
C. Receiver end (Decoder Part)
Figure 3 shows the process of decoder used to detect the information from stego image. Receiver end is the vice versa of transmitter end of the proposed system. Here also explain the steps of the receiver end.
Fig. 3. Receiver end decoder Process
D. Receiver end steps
First Step– First collet the stego image form the communication channel. Select the collected “stego” image.
Remove all the add zeros and ones of the from “stego” image.
Second Step – Select the stego image. Now calculate the energy and cost matrix of the stego image. After the calculation of the cost matrix obtain the pixel values where the hidden data is available.
Third Step – Check the pixel and select the LSB bit for data extraction of the secret data. Secret data is collect in the form of binary pixel values.
Fourth Step- Convert this binary information into the “String from or data from”. Separate the both things secret data and cover image.
Fifth Step – After obtain the secret data match the secret data of transmitter end.
Sixth Step – Calculate the quality check parameter of the cover image and “stego” image.
For quality measurement of the proposed work used the different parameters. They are PSNR, MSE, SSIM and payload capacity of the image. These are some quality check parameter. After satisfied the quality check parameter also see the visual result of proposed work visually obtain the good result in terms of visual results.
III.
SIMULATION AND RESULT
The result of our proposed method for data hiding of gray scale images shown in this section, simulation of our proposed method and result calculation. We have done our proposed work with the help the MATLAB R2012b software and simulate our whole proposed methodology in graphical user interface (GUI). The performance of the proposed algorithm is tested for different gray scale images that is shown in below figure. Basic configuration of our system is: Processor: Intel (R) Quad Core (VM) i3–3110 Central Processing unit @, 2.40 GHz with 4GB RAM: System type: 64-bit Operating System. MATLAB based simulation result shows good PSNR value for stego image and better quality of stego image as compare to other method that is shown in table II. In the field of image data hiding, people normally have anxiety about the stego image, the payload capacity of the embedded secret information or data, and mean square error of the output that is distributed in a communication channel. These criteria can be evaluated by PSNR in dB, Payload Capacity in bits, BR in Bits/pixel (B/P) respectively. For calculate the similarity of the cover image and stego image calculate the structural similarity index measurement (SSIM) of the both images. Performance of our proposed method are quantitatively measured by PSNR, MSE, and payload capacity (PC) and SSIM values defined by:
Mean Square Error (MSE): The MSE measures the standard amendment between the actual image (X) and denoised image (Y) and is given by:
Shows the cover image
Shows the stego image
Start
Calculate the Cost Matrix and Start
302
Copyright © 2016. Vandana Publications. All Rights Reserved.
The MSE has been extensively used to quantify image quality and once used alone; it doesn‟t correlate powerfully enough with sensory activity quality. It ought to be used, therefore in conjunction with alternative quality metrics and perception.
Peak Signal to Noise Ratio (PSNR): The PSNR is computed as:
Where S is that the size of actual image.
The PSNR is higher for an excellent worth image and lower for a poor quality image. It measures image fidelity, that is, however closely the distorted image resembles the actual image. In our research work on the basis of our image size 255x255, we mentioned PSNR and MSE are as follows.
Structural Similarity Index Measurement (SSIM):
The structural similarity (SSIM) index is a method for predicting the perceived quality of digital television and cinematic pictures, as well as other kinds of digital images and videos.
Comparison of proposed method with other methods. Payload Capacity (PC): The payload capacity shows the load data of the stego image. That give the information of the data load capacity of the image.
PC = string (size) / (wxh) wxh – Shows the block size of the image.
These are parameters of result which is used to evolution of the quality of proposed work.
Fig4. GUI of proposed method
A. Transmitter end (Encoder Process) Steps 1
Browse –Browse is push button used to select the image for processing. For perform this operation use uigetfile get
file Matlab function that is used to create such type of environment that is shown in below figure 5.
Fig5. Browse Button output
The above figure 5 is figure of different image that is used in the proposed method.
Step 2
Secret Data Generation
Secret data is enter blank editor space where by default is “hi” is already present. In this space use to create the secret data or information which is embedded to the cover image and create the stego image. This next process is shown in figure 6.
Cover image – “For add the secret data in the image that is
“Cameraman.jpg” image used as a cover image. There are different type of images are used for the cover image purpose.
Secret data is – “Hello my name is rajkumari i am
M.tech student from TIT Science College”
Fig6. Cover image and secret data which is embedded to the cover image
303
Copyright © 2016. Vandana Publications. All Rights Reserved.
Generation of the stego image is shown in below figure 7. The stego image creation is done by using Red color “Encoder” push button. Encoder push button is used to create the stego image. This image contain the secret information.
Fig7. Stego image generation
Step 4
Result Parameter Calculation – After the calculation of the “stego image” and “cover image”. Calculate the PSNR, MSE and SSIM. These parameters calculate here because the formula of these parameter is shows the relationship between the cover image and stego image.
After the Stego image generation. The transmitter end process is over. The next process is receiver end. In the next step is selection of the stego image. That is shown in next step.
B. Receiver end Process Step 5
Select the Stego Image –In next step, select the stego at the receiver end. In the receiver encoding the “stego –image “and regenerate the secret data. Which is embedding in the transmitter end. For select the stego image again use a browse button and select the “stego image”.
Fig8. Stego image selection “Stego_im1.bmp”
After the selection of the “stego image”. The next process is decode the embedded message.
Step 6
Decode the Stego image – Below figure 9 shows the “stego image selection”. This stego image is decoder and check the received information. For the encoding of this stego image use “decoder” push button.
Fig9. Receiver end “Stego image” selection
Decoding of the “stego image” is shown in below figure 10.
Fig10. Decoder output of “stego image “shown in receiver block
That is clearly see that the received message is same as to the transmitter end. The received message the encoder and decoder both are same.
That all the process of encoder and decoder end of the processed method. After completing the GUI based proposed method steps and result calculation environment. Further discuss the result comparison of proposed method with base paper method on the basic of PSNR, MSE and SSIM.
304
Copyright © 2016. Vandana Publications. All Rights Reserved.
that is shown in below. There five different images are selected for testing the proposed method. For comparison of proposed method different images „Cameraman.jpg‟ image is most suitable for the comparison of result of PSNR, MSE and SSIM. Cameraman image is easily available in all size and all format like size – 512 and 256 size. Similar that .jpeg, tif, .png and .bmp form. In the previous work “Cameraman.jpeg” and “Leena” based result comparison shown by the researcher‟s shows. In further compare the result of “Cameraman.jpeg” image for different value of Q = 1, 2, 3 and 4 and different size 512 and 256
Table 1 shows the result of proposed method as compare of the previous method on the basic on PSNR and MSE of the proposed method and previous method. This shows that proposed method shows a good result as compare to other method in terms of peak signal to noise ratio and mean square error..
That is the overall comparison of proposed method with previous method on the basics of PSNR and MSE for the different level of Q = 1,2,3,4 and the different size of the image 512 and 256. The above result shows that the proposed method shows good result at all the different level of Q and different image size of the image.
Fig. 12. (a) [q = 1] Fig. 12. (b) [q = 2]
Fig. 12. (c) [q = 3] Fig. 12. (d) [q =4] Fig. 12. “Stego” image of the proposed method
At last also show the output in the visual form, for this shows the cameraman image output at four different level q =1, 2, 3 and 4 level. Figure 12 (a) shows the output at [q =1] similar that at q =2, 3, and 4 resultant shown in the similar way 12 figure (b), figure 12. (c) and figure 12. (d).
IV.
CONCLUSION
Digital Steganography is an engrossing scientific area which comes under the security system. In this paper Steganography uses energy matrix based pixel identification and embed the secret data in highly potential pixels of images by using cost matrix. This concept enhances the security level since no one can extract secret data without having value of undefined region. The output of technique provides higher results because with the assistance of cropping an increased security than hiding data highly secured random marcov theory based energy and cost matrix based pixels thus with this object destined steganography. The proposed shows good result as compare to other method on the basics of PSNR (Peak-Signal-to-Noise Ratio), mean square error (MSE) and Payload capacity (PC).
REFERENCES
[1] Pulkit Khandelwal, Neha Bisht, Thanikaiselvan V, “Randomly Hiding Secret Data using Dynamic Programming for Image Steganography”, 2015, Intl. Conference on Computing and Network Communications (CoCoNet'15), IEEE.
[2] Amirtharajan, R. and J.B.B. Rayappan, 2013. Steganography-time to time: A review. Res. J. Inform. Technol., 5: 53-66.
[3] Amirtharajan, R., K. Karthikeyan, M. Malleswaran and J.B.B. Rayappan, 2013a. Kubera kolam: A way for random image steganography. Res. J. Inform. Technol., 5: 304-316. [4] Bin Li, Junhui He, Jiwu Huang and Yun Qing Shi. 2011. A Survey on Image Steganography and Steganalysis, Journal of Information Hiding and Multimedia Signal Processing. 2(2): 142-172.
305
Copyright © 2016. Vandana Publications. All Rights Reserved.
[6] Chan, C.K and L.M. Cheng. 2001. Improved hiding data in images by optimal moderately significant-bit replacement. IEE Electron. Lett. 37 (16): 1017–1018. [7] Chung-Ming Wang, Nan-I Wu, Chwei-Shyong Tsai and Min-Shiang Hwang. 2008. A high quality steganographic method with pixel-value differencing and modulus function. The Journal of Systems and Software. 81:150–158.
[8] Chung, K.L., C.H. Shen, L.C. Chang. 2001. A novel SVD- and VQ-based image hiding scheme. Pattern Recognition Lett. 22 (9): 1051–1058. 2015 Intl. Conference on Computing and Network Communications (CoCoNet'15), Dec. 16-19, 2015, Trivandrum, India. [9] Da-Chun Wu and Wen-Hsiang Tsai, 2003. A steganographic method for images by pixel-value differencing. Pattern Recognition Letters. 24: 1613–1626. [10] Hsien-Wen Tseng and Hui-Shih Leng. 2013. A Steganographic Method Based on Pixel-Value Differencing and the Perfect Square Number. Journal of Applied Mathematics. 2013: Article ID 189706, 8 pages [11] Ko-Chin Chang, Chien-Ping Chang, Ping S. Huang, and Te-Ming Tu. 2008, A Novel Image Steganographic Method Using Tri-way Pixel-Value Differencing. Journal of Multimedia. 3(2): 37-44.
[12] Praveenkumar, P., G. Ashwin, S.P.K. Agarwal, S.N. Bharathi, V.S. Venkatachalam, K. Thenmozhi and R. Amirtharajan, 2014a. Rubik's cube blend with logistic map on RGB: A way for image encryption. Res. J. Inform. Technol., 6: 207-215.
[13] Ran-Zan Wang, Chi-Fang Lin, Ja-Chen Lin. 2000. Hiding data in images by optimal moderately significant-bit replacement. IEE Electron. Lett. 36 (25): 2069–2070. [14] Ran-Zan Wang, Chi-Fang Lin, Ja-Chen Lin. 2001. Image hiding by optimal LSB substitution and genetic algorithm. Pattern Recognition. 34(3): 671–683.
[15] Shai Avidan and Ariel Shamir. 2007. Seam Carving for Content-Aware Image Resizing. In Proceedings of ACM SIGGRAPH. 26(3): Article No. 10.
[16] X. Song, S. Wang, and X. Niu. 2012. “An Integer DCT and Affine Transformation Based Image Steganography Method,” in Proc. of 8th International
Conference on Intelligent Information Hiding and Multimedia Signal Processing (IIH-MSP ‟12), pp. 102– 105, 2012.
[17] Thanikaiselvan, V., S. Kumar, N. Neelima and R. Amirtharajan, 2011. Data battle on the digital field between horse cavalry and interlopers. J. Theor. Applied Inform. Technol., 29: 85-91.
[17] Thanikaiselvan, V., S. Kumar, N. Neelima and R. Amirtharajan, 2011. Data battle on the digital field between horse cavalry and interlopers. J. Theor. Applied Inform. Technol., 29: 85-91.
[18] Thanikaiselvan, V., P. Arulmozhivarman, S. Subashanthini, and Rengarajan Amirtharajan. 2013. A Graph Theory Practice on Transformed Image: A Random Image Steganography. Sci. World J., Vol. 2013. 10.1155/2013/464107.
[19] Wu D.C and W.-H. Tsai. 2003. A steganographic method for images by pixel-value differencing. Pattern Recognition Letters. 24 (9-10): 1613–1626.
[20] Wu, H.C., N. I.Wu, C. S. Tsai, and M. S. Huang. 2005. Image steganographic scheme based on pixel-value differencing and LSB replacement methods. IEE Proceedings Vision Image and Signal Processing. 152(5): 611–615.
![Fig. 12. (c) [q = 3] Fig. 12. (d) [q =4] Fig. 12. “Stego” image of the proposed method](https://thumb-us.123doks.com/thumbv2/123dok_us/9752055.1959771/6.595.311.543.68.231/fig-c-fig-fig-stego-image-proposed-method.webp)
