Scholarship@Western
Scholarship@Western
Electronic Thesis and Dissertation Repository
4-12-2013 12:00 AM
Interpretation, Stratification and Validation of Sequence Variants
Interpretation, Stratification and Validation of Sequence Variants
Affecting mRNA Splicing in Complete Human Genome Sequences
Affecting mRNA Splicing in Complete Human Genome Sequences
Ben C. Shirley
The University of Western Ontario
Supervisor Dr. Peter K Rogan
The University of Western Ontario Graduate Program in Computer Science
A thesis submitted in partial fulfillment of the requirements for the degree in Master of Science © Ben C. Shirley 2013
Follow this and additional works at: https://ir.lib.uwo.ca/etd
Part of the Bioinformatics Commons
Recommended Citation Recommended Citation
Shirley, Ben C., "Interpretation, Stratification and Validation of Sequence Variants Affecting mRNA Splicing in Complete Human Genome Sequences" (2013). Electronic Thesis and Dissertation Repository. 1199. https://ir.lib.uwo.ca/etd/1199
This Dissertation/Thesis is brought to you for free and open access by Scholarship@Western. It has been accepted for inclusion in Electronic Thesis and Dissertation Repository by an authorized administrator of
Sequence Variants Affecting mRNA Splicing in
Complete Human Genome Sequences
(Thesis format: Monograph)
by
Ben Chambers Shirley
Graduate Program in Computer Science
A thesis submitted in partial fulfillment of the requirements for the degree of
Master of Science
The School of Graduate and Postdoctoral Studies The University of Western Ontario
London, Ontario, Canada
ii
Abstract
The Shannon Human Splicing Pipeline software has been developed to analyze variants on a genome-scale. Evidence is provided that this software predicts variants affecting mRNA splicing. Variants are examined through information-based analysis and the context of novel mutations as well as common and rare SNPs with splicing effects are displayed. Potential natural and cryptic mRNA splicing variants are identified, and inactivating mutations are distinguished from leaky mutations. Mutations and rare SNPs were predicted in genomes of three cancer cell lines (U2OS, U251 and A431), supported by expression analyses. After filtering, tractable numbers of potentially deleterious variants are predicted by the software, suitable for further laboratory investigation. In these cell lines, novel functional variants comprised 6–17 inactivating mutations, 1–5 leaky mutations and 6–13 cryptic splicing mutations. Predicted effects were validated by RNA-seq data of the three cell lines, and expression microarray analysis of SNPs in HapMap cell lines.
Keywords
iii
Co-Authorship Statement
iv
Table of Contents
Abstract ... ii
Co-Authorship Statement... iii
Table of Contents ... iv
List of Tables ... vi
List of Figures ... vii
List of Appendices ... viii
List of Abbreviations, Symbols, Nomenclature ... ix
1 Introduction ... 1
2 Literature Review ... 4
2.1 Overview of splicing mechanisms ... 4
2.1.1 The spliceosome and the splicing process ... 4
2.1.2 Donor and acceptor splice sites ... 5
2.1.3 Splice site recognition and variation ... 5
2.2 Molecular information theory ... 6
2.2.1 Basics of molecular information theory ... 8
2.2.2 Information weight matrices ... 9
2.2.3 Information theory and human splicing site mutations... 10
3 Shannon pipeline - Methods ... 12
3.1 Shannon pipeline software architecture ... 12
3.2 Perl scripts and modules ... 13
3.3 CLC-Bio integration ... 18
3.3.1 Java classes ... 18
3.4 Performance of the Shannon pipeline software ... 28
v
4.2 Displaying results... 34
4.3 Validation with RNA-seq expression data ... 34
4.4 Characterization of defective pathways ... 40
5 Discussion ... 43
6 Conclusion and future development... 45
Bibliography ... 47
Appendices ... 56
vi
List of Tables
Table 1. Shannon pipeline Java class list and brief descriptions ... 20
Table 2. Performance of Shannon Pipeline for mRNA splicing mutation prediction ... 30
Table 3. Enrichment for predicted splicing mutations after processing and filtering ... 33
vii
List of Figures
Figure 1. Types of splicing mutations that affect structure and/or abundance of resulting
transcripts ... 7
Figure 2. Flow chart of the Shannon Human Splicing Pipeline. ... 14
Figure 3. Shannon pipeline genome build, filtering, and display options. ... 24
Figure 4. Twelve DNA sequences and their corresponding information changes. ... 36
Figure 5. Predicted mutation splicing phenotype supported by RNA-seq... 39
viii
List of Appendices
ix
List of Abbreviations, Symbols, Nomenclature
A431 - epidermoid squamous carcinoma-derived cell line. API – A library of functions, data structures, classes, etc. which can be exploited by a programmer.
ASSA - Automated splice site analysis server. A tool to predict the effects of sequence changes that alter mRNA splicing in human diseases.
dbSNP – Single Nucleotide Polymorphism database. A public-domain archive of single nucleotide polymorphisms.
GCC – GNU Compiler Collection. The standard compiler for most Unix-line operating systems.
FASTA format – A text-based file containing nucleotide sequences (can also contain peptide sequences) for one or more region in a genome.
hg18 – Also called NCBI36. The March 2006 human reference sequence.
hg19 – Also called GRCh37. The February 2009 human reference sequence. The most recent patch is GRCh37.p11. Patch data generally contains alternate haplotype regions. HGNC – HUGO Gene Nomenclature Committee. HUGO- or HGNC-approved.
HUGO – Human Genome Organisation.
Indel - A genomic insertion or deletion. Indels range in size from a single nucleotide to multiple kilobases.
Java Swing – The primary Java GUI toolkit. It is an API which provides graphical user interface design functionality.
NGS – Next generation sequencing.
NMD – Nonsense-mediated mRNA decay. A surveillance pathway which reduces errors in gene expression by eliminating mRNA transcripts that contain a premature stop codon. PCR - Polymerase chain reaction. Used to amplify a small number of (or one) DNA
segments, resulting in many copies of the sequence.
qPCR – Quantitative real-time polymerase chain reaction. For one or more specific sequences in a sample, sequences can be detected and quantified.
Ri - Information content in bits.
RNA-seq – Uses high throughput sequencing to sequence cDNA in order to measure the levels of RNA transcripts and their isoforms in a sample.
SNP – Single nucleotide polymorphism. A single-nucleotide substitution in the genome. A SNV that has been characterized.
SNV – Single nucleotide variant. A single-nucleotide substitution in the genome.
U251 - glioblastoma-derived cell line
U2OS - osteosarcoma-derived cell line
1
Introduction
The volume of human next-generation sequencing (NGS) data requiring bioinformatic analysis has necessitated development of high-performance software for genome scale assembly and analysis 1. Genomic variations found in these analyses, particularly single nucleotide polymorphisms (SNPs), have traditionally been interpreted in terms of amino acid modifications in coding regions. Clinically-significant non-coding variants are a relatively unexplored source of pathogenic mutations and lack a general, high-throughput method to interpret their effects. In this thesis I present genome-scale software which I adapted and further developed to quantify the effect of mutations in the common classes of splice donor (U1) or acceptor (U2)-type sites in a high-throughput manner. Mutations predicted with this method will be useful for pinpointing potentially deleterious variants suitable for further laboratory investigation.
Clinical studies have deemed the vast majority of known variants in patients with Mendelian (single-gene) disorders to be of uncertain pathogenic significance (VUS) 2,3. Cis mutations can affect protein translation, mRNA processing and initiation of transcription. In silico methods have been developed for the first two of these cases (e.g.,
4,5
that filter out benign or small changes in mRNA splicing due to sequence variation will be essential for mutation discovery in exomes, complete genomes and high-density targeted deep sequencing projects. Examination of individual variants in the laboratory with functional assays is both expensive and inefficient as many variants are not likely to be deleterious, or differ significantly in their pathogenicity.
The Automated Splice Site Analysis (ASSA) 5 server evaluates single mutations that change splice site strength with information-based models 15. The average information, Rsequence, of a set of binding sites recognized by the same protein (such as U1 or U2)
describes the conservation of these sequences. Sequences are ranked according to their individual information content (Ri in bits) 15-17. Individual information content is a
portable, universal measure which allows direct comparison of binding sites across the genome or transcriptome, regardless of the sequence or protein recognizer. Functional binding sites have Ri > 0, corresponding to ∆G < 0 kcal/mol 18. Strong binding sites have
Ri >> Rsequence, while weak sites have Ri << Rsequence. Any sequence variation may change
its protein binding affinity, which is reflected by a change in the computed Ri of that
binding site. A 1-bit change in information content (∆Ri) corresponds to a ≥ 2 fold change
in binding affinity (100/2∆Ri). The ASSA server has been widely used and its sensitivity and specificity has previously been extensively validated in hundreds of studies of individual mutations (http://tinyurl.com/splice-server-citations). However, it requires approximately 30 seconds to examine a single variant and is therefore not suitable for comprehensive analysis of whole-genome sequencing data. The Shannon pipeline was implemented using the same mathematical approach and information weight matrices as ASSA to carry out batch information-based analysis of thousands of mutations from the BRCA1 and BRCA2 genes in the Breast Cancer Information Core Database 19. In the present study, the software has been adapted to perform a single matrix algebraic calculation across a genome with an efficient state machine that significantly increases computational speed over ASSA.
genome) without the use of a catalogue of repetitive sequences. This work allowed me to appreciate the scope and sheer size of genome-scale programming projects. In particular, although my program was executed on the Shared Hierarchical Academic Research Computing Network (SHARCNET) using 128 cores, the full execution time of the software was ~3 months. This inspired me to become involved with a software project operating on a genome-scale, which executed in a far shorter time. Additionally, my role in 22 was to assist in modifications to ASSA (and the newer ASSEDA). Implementing these modifications improved my understanding of molecular information theory and its applications related to splicing prediction.
Several years ago, C libraries were developed by Tyson Whitehead which calculate the information content of a genomic region based on information weight matrices 19,20. These libraries were designed to execute very quickly while not sacrificing specificity. Chromosomes are stored in memory one at a time and each base is stored using 17 bytes. The longest human chromosomes can therefore be represented using a few gigabytes of memory. Reference sequences for each chromosome are read from FASTA files and parsed at disk speed (parsed as fast as the disk can read the file). As a consequence, the libraries require only several seconds to parse each chromosome. Sequence blocks, four kilobytes in size, are extracted from the appropriate region of a parsed FASTA file and information analysis is performed. As the appropriate regions of the genome are extracted from memory on demand there is no need for indexing, thus execution speed is highly optimized.
2
Literature Review
2.1 Overview of splicing mechanisms
The human genome contains approximately 3,000,000,000 nucleotides 23. It is comprised of DNA which is made up of four nucleotides - adenine, thymine, cytosine, and guanine - denoted A, T, C, or G joined by phosphodiester bonds. These nucleotides form a code which eventually translates into proteins necessary for survival. Nucleotides (bases) can form base pairs with other nucleotides. For each base, there is another nucleotide which binds to it called its complementary base. The base A binds readily to the base T, and G binds with C. Base pairs are formed by hydrogen bonds (AT and GC base pairs experience 2 or 3 hydrogen bonds respectively). In the genome, DNA forms its double helix structure by pairing a strand to another complementary strand. Only ~1.1% of DNA directly codes for proteins and these regions are referred to as exons. Collections of exons and non-coding regions called introns between them (along with other regulatory elements such as promoters, enhancers, etc.) form genes. To ensure proper gene function, introns must be precisely removed to result in an mRNA suitable for translation to protein
24
.
2.1.1 The spliceosome and the splicing process
2.1.2 Donor and acceptor splice sites
Located at each end of an intron is a splice site denoted as a donor site at the 5′ end of the intron or acceptor site at the 3′ end. Both of these sites are referred to as natural sites (the splice site used in the absence of mutation). The efficiency of splicing is partially determined by the highly conserved GT and AG dinucleotides present at the donor and acceptor sites, respectively. These dinucleotides are certainly not the sole determinants of normal splicing however. The length of donor and acceptor sites have been defined as 10bp (-3, +6) and 28bp (-25, +2) respectively where 0 refers to the first nucleotide of the splice junction 26. In 1986, a study examined approximately 400 vertebrate genes and derived consensus sequences for both donor and acceptor sites 27. The strong conservation of these regions was evident – even across species barriers – which implied an important role in splicing.
Point mutations within splice sites affecting pre-mRNA splicing account for approximately 15% of human genetic disease 28. Mutation within any region of a donor or acceptor site can contribute to a reduction (or in rare cases, a strengthening) of the site’s binding affinity to the spliceosome. Weakened natural sites may cause aberrant splicing.
2.1.3 Splice site recognition and variation
(when only one splice site of an intron is affected) implied that splice sites are recognized as pairs 29. In addition, the size of exons is also a factor. Only 3.5% of exons are of length >300 nucleotides and less than 1% >400. This again implies that the sequence of splice sites is not the only determining factor in splice site recognition.
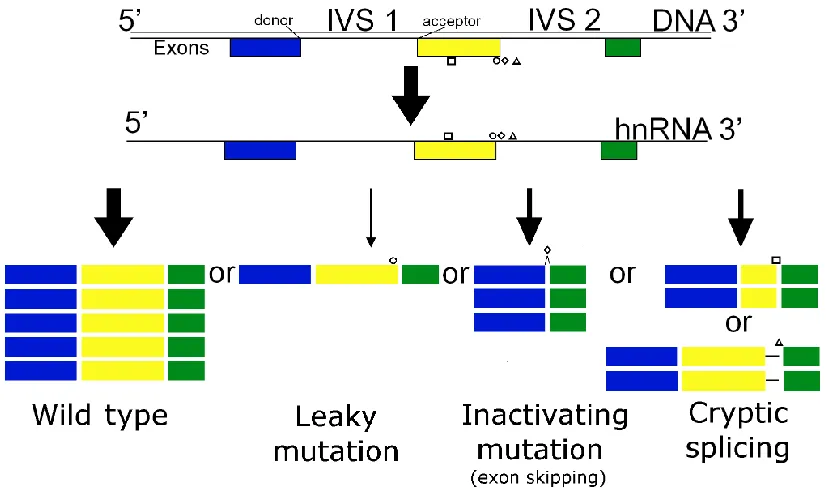
Up to ~50% of deleterious alterations in genes may be caused by splicing mutations 31. Although mutations located anywhere in a gene can impair the splicing process, most deleterious variants have been found in the GT/AG dinucleotides located at splice junctions 31. The GT/AG nucleotides are highly conservered. However, any nucleotide substitutions within splice sites may alter splicing outcome. There are three main potentially deleterious outcomes which can occur as a result of variation within splice sites (Figure 1). A mutation may weaken a splice site to such a degree that it no longer functions effectively. This may cause the affected exon to be missing from the resulting mRNA (exon skipping) or the exon to extend past the natural site into the intron (intron inclusion). Other mutations may weaken a splice site to a degree insufficient to cause exon skipping. Mutations of this type may result in a lesser expression of a normal splice isoform (leaky). Finally, mutations that strengthen nearby cryptic sites or weaken a natural site with a cryptic site nearby may lead to cryptic site binding. Cryptic site binding may shorten or extend an exon. Multiple mRNA splice isoforms can be produced. Variation in the nucleotide sequence of donor or acceptor sites can increase or decrease the abundance of a specific isoform in the population of mRNA.
2.2 Molecular information theory
Figure 1. Types of splicing mutations that affect structure and/or abundance of resulting transcripts
2.2.1 Basics of molecular information theory
Molecular information theory describes biological interactions by exploiting the mathematics of information theory 32 and applying it to biological systems. In particular, information-based methods can be used to calculate the information content of binding sites recognized by one kind of macromolecule (e.g., the spliceosome). Known binding sites must be aligned and examined, however the contributions of individual positions are not ignored as they are in consensus sequences. A consensus sequence aligns sequences and reports the most prevalent base at each position. The information content of sites recognized by a single macromolecule is denoted Rsequence. Two sources of information
are needed to compute Rsequence: 1) The nucleotide sequences where a macromolecule has
demonstrated the ability to bind. 2) The sequences must be viewed in the context of an entire communication system. Thus, the nucleotide composition of the genome in which the macromolecule functions must be determined 33.
Sequences recognized by a single macromolecule within a genome known to experience macromolecule binding are aligned in a manner to allow the greatest homology between bases. The Rsequence of the site can then be calculated. The general formula for uncertainty
can be modified as follows to represent nucleotide sequences
(2.1)
where B = {A,C,G,T}, and f (B,L) is the frequency of base B in position L is found in the sequence. This equation can be applied to a full genome by exploiting existing data on the nucleotide content of the human genome. If a set of random nucleotides sequences were extracted from the human genome and aligned, all four bases would be observed, with probabilities P(B). Thus, the equation can be modified as follows
When this formula is applied genome-wide, the resulting uncertainty is higher than when applied to only known binding sites. This implies there is a pattern in the nucleotide sequences located at splice sites. This was certainly an expected result, as splice site sequences were known to be conserved. For each position L, that decrease in uncertainty can be demonstrated by
(2.3)
Rsequence(L) is therefore a measure of the information gained (uncertainty lost) by aligning
the binding sites. Information is additive 16, thus the total information gained is equal to the decrease in uncertainty across all sites
(2.4)
where Hnb is the probability of obtaining a particular combination of n bases. Although
information itself is additive, this equation has been simplified by assuming that the frequencies of bases observed at one position are statistically independent of any other.
2.2.2 Information weight matrices
Information content can be defined as the number of choices needed to describe a sequence pattern, using a logarithmic scale in bits 33. These data can be represented as a weight matrix calculated by
(2.5)
Riw(b,l) (also referred to as RIBL) is a two dimensional array containing b rows and l
columns where b = {A,T,C,G}, l is the position in the splice site, and e(n(l))) is a sample size correction factor for the n sequences at position l used to create f(b,l). The 2 represents the bits of uncertainty a recognizer has before binding to a site containing 4 possible bases (log2(4)). As a whole, this matrix represents the sequence conservation of
binding strength, and other applications 34. The most frequent base at each position of the weight matrix is assigned the largest individual information (Ri in bits) value. Therefore,
a consensus sequence can be generated by selecting the highest Ri value at each position.
The individual information of a sequence can be compared to an information weight matrix in the following way
(2.6)
where j is an individual sequence and s(b,l,j) is a simple two dimensional array which represents the jth sequence. As j is a single sequence, frequencies are not involved in this matrix as such. Instead, elements in s(b,l,j) contain the value 0 at every position with the exception of base b at position l which contains 1.
2.2.3 Information theory and human splicing site mutations
The human genome can be viewed as a system which contains information. As is widely known, DNA triplets code for the synthesis of specific amino acids. However, this is not the only kind of information stored within the genome. As discussed in chapter 2.1, splice sites are comprised of similar, conserved DNA sequences. Information can be described as a decrease in uncertainty, therefore the similarity of splice sites implies that they contain information.
The effects of genetic variation (base substitutions) within a sequence can be calculated by examining the Ri or the common and variant alleles. The difference between their
respective information contents is denoted as ΔRi. As Ri is on a logarithmic scale, the
minimum change in binding affinity of two sites is 2ΔRi 15. Riw(b,l) matrices have been
computed for 56,985 acceptor and 56,286 donor sites 35. Matrices used by the Shannon pipeline are based on these models and were obtained using the same method, but are based on sites on both strands. Models in 35 were based on only on the positive (+) strand. Matrices used by the pipeline are based on 108,079 acceptor sites and 111,772 donor sites. The mean distribution of Ri values across these sites is denoted Rsequence where the
represents the average information required for splicing to occur at a splice site. It also reflects the strength of the splice site. Those splice sites which have Ri values << Rsequence
are weak sites, while those with Ri >> Rsequenceare strong sites. Non functional sites have
3
Shannon pipeline - Methods
3.1 Shannon pipeline software architecture
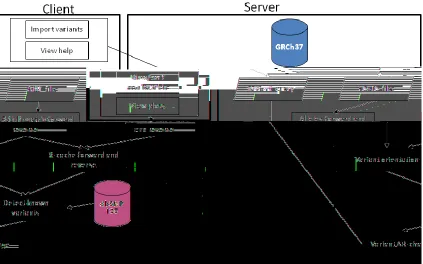
I have implemented the Shannon pipeline plugin using the CLC-Bio genomics developer toolkit to simplify access to this technology and interpretation by novice users. The same plugin can be executed on a single client computer, a remote server or a grid system, and benefits from automated software updates. The server version uses an architecture in which a Workbench client transmits variant data to the server, which performs the computations, and returns results that can be filtered and formatted on the client. A standalone version of the fully functional Genome Workbench plugin is also available. By contrast, the splicing mutation feature that is native in CLC-Bio Genomics’ products is limited to detecting changes in dinucleotides at the exon boundaries, which represent fewer than 5% of all splicing mutations detected by the Shannon pipeline.
The Shannon pipeline uses an efficient algorithm coded in C to quickly analyze genome-scale data sources for information changes (Figure 2). Methods for computing Ri and Ri
values determine the dot product of an information weight matrix and the unitary sequence vector for each genomic window and comparing the resultant scalar values of the reference and variant sequences 36. C libraries determine the information content of a position in the reference genome and after a variant is introduced. This method uses convolution-style sliding-window computation of all sequence changes for each complete chromosome sequence resident in RAM. To expedite processing, the software currently only handles single nucleotide variants (SNV) – which are the most prevalent type of variation. Changes in Ri introduced by genomic variation are computed by subtracting the
initial Ri value of a position by the sum over a surrounding window, then adding the new
value for each position (∆Ri). Perl scripts wrap these C libraries and annotate output.
(Build 66) and GRCh37 (hg19)/NCBI36 (hg18), respectively, allowing the software to execute with no active internet connection and incorporates all necessary annotations required to contextualize a potential mutation.
Input flat files containing sequence variants that differ from the reference genome are imported into the CLC-Bio Java environment. The file must be either Variant Call Format (VCF) 37 or a tab-delimited format with the following fields: [chromosome #] [unique identifier] [coordinate] [reference/variant]. Coordinates can be hg18 or hg19. All variants appearing in this study are hg19. Genomic insertions and deletions (indels) present in input files are not considered for analysis.
3.2 Perl scripts and modules
Two Perl scripts were previously written to perform variant annotation. I significantly modified these scripts by increasing memory/time efficiency and modularizing the code to simplify testing. To this end, I divided the two preexisting scripts into 5 Perl modules. I wrote an additional two Perl scripts and several modules to automate plugin installation and filtering of variants. I will briefly describe the functionality of the scripts and modules here. A straightforward Perl script that splits variants on each chromosome into separate files will not be described.
3.2.1.1
MainControl.pl
Figure 2. Flow chart of the Shannon Human Splicing Pipeline.
3.2.1.2
InstallShannonPipeline.pm
C libraries must be compiled before they can be executed. The C libraries are installed as Perl modules through the use of preexisting Perl wrappers. This Perl module automatically compiles the libraries if necessary. To check if the libraries are already installed I use “eval ‘require Rogan::FASTA” (Rogan::FASTA is the name of one of the modules). If the module is already installed, installation will not take place. Otherwise, a series of commands will be run, some of which are used for potential error reporting. The current directory is changed to the location where the libraries will be installed and the date and current directory are sent to stdout.log. All external commands are run by calling Perl’s system function using an array constructed specifically for each command. The commands are:
1) my $makeClean = qq(make clean 2>> ./stderr.log 1>> ./stdout.log);
2) my $createMakefile = qq(perl Makefile.PL LIB="./installeddir/" PREFIX="./extras/" 2>> ./stderr.log 1>> ./stdout.log);
3) my $makeCommand = qq(make 2>> ./stderr.log 1>> ./stdout.log); 4) my $makeInstall = qq(make install 2>> ./stderr.log 1>> ./stdout.log);
Command number 2 specifies LIB and PREFIX options to allow local installation without the need for root access. Each command is executed using system. System error codes are trapped and examined. If an error occurs in any of these steps, execution stops and error code 100 is sent to the Workbench, indicating a problem with installation.
3.2.1.3
Pipeline-Initial-Scan.pl
A parameters file created by Java code is examined to determine the location of appropriate FASTA files containing the reference genome, as well as the location of donor and acceptor information weight matrices. Chromosomes are examined one at a time. Before variants on a chromosome can be examined, the appropriate FASTA file is parsed into an efficient state machine using a C library. Donor and acceptor information weight matrices are also parsed. Each variant is examined using C libraries to determine its Ri before and after the contribution of a specific variant. The following information is
coordinate, 4) Ri before variant contribution, 5) Ri after variant contribution, 6) donor or
acceptor site, 7) strand, 8) variant coordinate, 9) variant (e.g., G/T). The process is repeated for all chromosomes.
3.2.1.4
WriteTracksAndFindIfWithinGene.pm
In addition to plot and tabular output, BED tracks are also generated by the pipeline. The tracks contain ΔRi for each variant and can be viewed in a genome browser. The module
reads the file generated by Pipeline-Initial-Scan.pl line by line. Hash tables are created which allow constant time searches named donorpos (positive strand, donor), donorneg, accpos, and accneg. Each variant is sent to a generalized function which accepts the appropriate hash, file handle to write to (appropriate track), chromosome number, and variant ΔRi. This function simultaneously appends to the appropriate track file as well as
adding each variant to the appropriate hash.
Ensembl Gene 66 is examined along with the list of variants. If a variant is found within transcript start and end coordinates, then it is within a gene. Variants meeting that requirement are added to an array which is returned by reference to MainControl.pl. Variants not found to be within an exon are not annotated further.
3.2.1.5
AnnotateNaturalSites.pm
This module determines if there is a nearby natural site close to the variant. The array of variants found to be within an exon by WriteTracksAndFindIfWithinGene.pm are examined along with natural site coordinates found in Ensembl Gene 66. Hash tables are built containing the locations of donor and acceptor natural sites on both strands. If a variant is found to affect a known natural site the variant is annotated as a natural site. Otherwise it is annotated as a cryptic site. The array is returned to the main Perl script for further annotation.
3.2.1.6
AnnotateExons.pm
the exon and Ri values of the cryptic and natural site can be compared after the
contribution of the cryptic variant is observed. The range to check for a nearby natural site is determined by a field in the parameters file created using Java code. Currently, this value is 300. Thus, a range of up to 300 bp around the cryptic site is examined and compared with natural sites from Ensembl Gene 66. Variants near a natural site are annotated 3′ or 5′ flanking and returned.
3.2.1.7
GetStrengthsOfNearestNaturalSites.pm
Nearby natural sites potentially found in AnnotateExons.pm are compared with the appropriate variant cryptic site to determine which site has the higher Ri value. If the
nearby natural site has the higher Ri, the variant is annotated as greater. Otherwise the
variant is annotated as less. If a variant does not have a nearby natural site within 300bp, a ‘-‘ is annotated to the variant as a placeholder. The resulting variants are returned for further annotation.
3.2.1.8
AnnotateKnownVariants.pm
3.2.1.9
FilterOutputData.pl
The user may request that output contain variants on only the positive strand, negative strand, or both. Additionally, the user may request that only donor sites, acceptor sites, cryptic sites, or natural sites be displayed. This script accesses those preferences as command-line arguments and eliminates variants matching the request criteria from the file to be imported to the Workbench.
3.3 CLC-Bio integration
The CLC-Bio Genomics Workbench is a commercial workspace for genomics research (www.clcbio.com). Files are not generally used in this workspace, instead files are imported as ClcObjects (objects). These objects represent specific biological data and are associated with appropriate editors, viewers, and other object types. The Workbench is also a host to third-party applications (plugins) generally implemented using pure Java. As the Shannon pipeline was coded in C and Perl, a Java-based connection to the CLC environment was required. Additionally, as run-time is a paramount concern for the pipeline given the number of variants it examines simultaneously, the existing C libraries could not be converted to Java while maintaining necessary execution speed. Thus, I designed the Java code not only to communicate with the CLC-Bio Workbench, but also with the Perl and C code on the command-line.
3.3.1 Java classes
3.3.1.1
Importing variant data
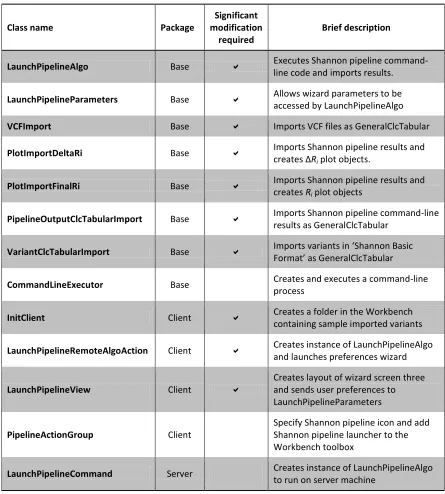
Table 1. Shannon pipeline Java class list and brief descriptions
Class name Package
Significant modification
required
Brief description
LaunchPipelineAlgo Base Executes Shannon pipeline
command-line code and imports results.
LaunchPipelineParameters Base Allows wizard parameters to be
accessed by LaunchPipelineAlgo
VCFImport Base Imports VCF files as GeneralClcTabular
PlotImportDeltaRi Base Imports Shannon pipeline results and
creates ΔRi plot objects.
PlotImportFinalRi Base Imports Shannon pipeline results and
creates Ri plot objects
PipelineOutputClcTabularImport Base Imports Shannon pipeline command-line
results as GeneralClcTabular
VariantClcTabularImport Base Imports variants in ‘Shannon Basic
Format’ as GeneralClcTabular
CommandLineExecutor Base Creates and executes a command-line process
InitClient Client Creates a folder in the Workbench
containing sample imported variants
LaunchPipelineRemoteAlgoAction Client Creates instance of LaunchPipelineAlgo
and launches preferences wizard
LaunchPipelineView Client
Creates layout of wizard screen three and sends user preferences to LaunchPipelineParameters
PipelineActionGroup Client
Specify Shannon pipeline icon and add Shannon pipeline launcher to the Workbench toolbox
A second import class I developed which imports variants in the format [chromosome #] [unique identifier] [coordinate] [reference/variant] will not be described in detail. All formatting checks use the same methods as described in the VCF import class. This class was devised primarily for testing in the early stages of pipeline development.
3.3.1.2
Manhattan-style plot importer
Visual representations of data allow overall trends to be observed and individual outliers to be easily identified. CLC-Bio’s API provides a class for this purpose named MAScatterPlot. My task was to prepare Shannon pipeline data for visualization as well as create plots using MAScatterPlot. It is required that data points are sorted before plot creation. I implemented a Quicksort algorithm to accomplish the sort. After sorting, data are separated into an array representing the X axis of the plot and an array representing the Y axis. MAScatterPlot allows tooltips to be displayed upon hovering the mouse pointer over a data point. Tooltips contents include chromosome, coordinate, ΔRi, Ri after
variant contribution, and rsID (if available). Separate plots are created to visualize both
ΔRi and final Rifor each chromosome {1..22,X,Y} as well as a genome-wide plot. Thus,
if variants are present on all chromosomes a total of 50 plots are generated.
3.3.1.3
Tabular results importer
All Shannon pipeline results are imported and displayed in tabular format. Results generated during command-line execution are recorded in a tab delimited file. The tabular import class functions similarly to the variant importer. The Shannon pipeline results file is read into memory and examined line by line and data are reordered and formatted. Column headers are named as well as the resulting tables.
Variants are split into four separate tables. ‘Complete Variant Information’ contains all variants. ‘Inactivating Variant Information’ and ‘Leaky Variant Information’ contain variants predicted to be inactivating or leaky respectively. ‘Cryptic Variant Information’ contains all variants located within cryptic splice sites. Column headers in Inactivating Variant Information and Leaky Variant Information tables are Chromosome, Coordinate (of splice site), Strand, Ri-initial, Ri-final, ΔRi, Type (donor or acceptor), Gene Name,
Input ID (unique variant ID). There are additional column headers in the Complete Variant Information and Cryptic Variant Information tables which are Location Type (intronic or exonic), Loc. Rel. to Exon (cryptic site is 5′-flanking or 3′-flanking compared to the nearest exon), Dist. From nearest nat. site, Loc. of nearest nat. site (coordinate of nearest natural site), Ri of Nearest Nat. Site, Cryptic Ri relative to nat. (greater or less),
rsID if Available, and Average Heterozygosity (if rsID is available).
Columns containing real numbers are rounded to two decimal places. Strand is represented as ‘0’ or ‘1’ in Shannon pipeline results and is converted to ‘+’ or ‘-‘ respectively. Some columns may have fields which contain no data such as Loc. Rel. to Exon if a nearby natural site is not found. In these cases the entry is filled with a null value to allow automatic sorting. By default, ClcGeneralTabular sorts columns when the header is clicked. To function intuitively, columns must contain only a single type of data or null values. If more than one type of data are present, sorting will default to lexicographical order.
3.3.1.4
User preferences
I created a wizard built upon CLC-Bio’s class ClcWizardStepView. The first screen of the wizard is created entirely by CLC-Bio and determines whether the Shannon pipeline should run on a client (local computer), server, or grid system. The second and fourth screens through which the user selects the location of Shannon pipeline input and where to save Shannon pipeline results are also generated by CLC-Bio. I have restricted the object types which may be used as Shannon pipeline input to GeneralClcTabular objects. This object type is generated by the import classes discussed in 3.3.1.1.
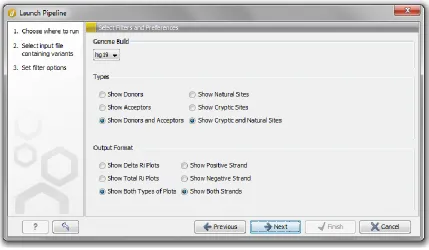
I created the third wizard screen (Figure 3) using Java Swing. A JComboBox allows the user to indicate which genome build is appropriate. Variants are represented in hg18 or hg19 coordinates. Four groups of three JRadioButtons are used to determine the following: 1) In the types frame, donor, acceptors, or both may be displayed to the user after pipeline execution. 2) cryptic sites, donor sites, or both types of sites may be displayed. 3) In the ‘Output Format’ frame, the user can opt to create delta Ri plots, final
default, the selections made are hg19, show donors and acceptors, show cryptic and natural sites, show both types of plots, and show both strands. Choices made at this step are recorded using the class LaunchPipelineParameters which extends CLC-Bio’s class AlgoParametersInterpreter. I tailored functions in the class to accept the specific choices users are offered. This class allows parameters to be accessed by the LaunchPipelineAlgo class (discussed in 3.3.1.6).
3.3.1.5
Ensembl, and dbSNP, and human genome distributions
Four large databases are required for variant annotation and Riprediction. Ensembl Gene
66 contains information needed for gene annotation. The Single Nucleotide Polymorphism Database 130/135 (dbSNP) is used to determine if a variant is novel. Two full reference genomes (hg18, hg19) in FASTA format are also required to examine variants on each respective genome build.
As CLC-Bio requires that a plugin can run with no internet connection, it was necessary to package the databases for release. In the initial stages of plugin development I attempted to package the necessary databases along with the plugin itself. However, this would have made updating the plugin difficult and would result in very large downloads for users every update. It was decided – with input from CLC-Bio – to instead package the databases in separate plugins. By employing this method, database plugins can be downloaded once by the user and any subsequent updates to the main plugin can be downloaded separately. This solution also lends itself to future updates of the reference genome versions and associated annotations, and the development of applications that enable mutation analysis in non-human genomes.
Figure 3. Shannon pipeline genome build, filtering, and display options.
This is a screenshot of the third wizard screen after selecting ‘Launch Pipeline’. By default, the displayed choices are selected. Genome build may be hg18 or hg19. In the types frame, donor, acceptors, or both may be displayed to the user after pipeline execution. Similarly, cryptic sites, donor sites, or both types of sites may be displayed. In the ‘Output Format’ frame, the user can opt to view delta Ri plots, final Ri plots, or both.
displayed to the user (and in the error log), informing them that the appropriate database plugin must be installed.
3.3.1.6
LaunchPipelineAlgo class and the command-line
Development of this class required the creation of Perl code as well. Specifics of the necessary Perl scripts can be found in 3.2.1.1 and 3.2.1.2. The overall workflow of a Shannon pipeline execution from the Workbench is as follows: 1) Variants are imported using importer classes described in 3.3.1.1. 2) The user selects preferences using a wizard which are recorded using the LaunchPipelineParameters class and LaunchPipelineAlgo reads these parameters. 3) Perl and C code is automatically installed if necessary. 4) A parameters file is created and the command-line portion of the Shannon pipeline is executed taking these preferences into account. 5) Shannon pipeline results are imported. 6) Imported Shannon pipeline results (objects) can be viewed in standard CLC-Bio editors. The class LaunchPipelineAlgo is involved in steps 2-5.
has been tested on the following system configurations: Perl 5.8.8, 5.10.1, 5.12.3, 5.14.2, GCC 4.1.2, 4.2.1, 4.4.3, 4.6.3, Ubuntu 2.6.32, CentOS 2.6.18, Fedora 3.1.0-7, Mac OS X (Lion) 10.7.4.
A parameters file is created which can be accessed by the command-line portion of the Shannon pipeline. This file contains both user preferences and hard-coded settings for the pipeline. These parameters include the human genome version, Ensembl version, dbSNP version, distance from a modified cryptic site to attempt to locate a natural site, maximum distance a cryptic site can be from a natural site to display comparisons between them, the locations of Ensembl Gene 66, dbSNP 130/135, hg18, hg19, and splice site information weight matrices. The parameters file is placed in the directory containing command-line Shannon pipeline code.
After Shannon pipeline results are generated by the command-line code, results must be imported. Previously described tabular and plot import classes are invoked to accomplish this task. Standard output and standard error files are imported simply as ClcStrings. If any import is unsuccessful, execution will continue but a note will be made in the log describing the nature of the failure.
3.3.1.7
Help documentation
I implemented a series of help screens using JavaHelp. Help is accessed through a question mark on the bottom left of the preferences wizard (can be seen in Figure 3). An electronic version of help screens can be found online at http://www.clcbio.com/files/usermanuals/shannon_pipeline.pdf. Help sections include Quick Start, Tables, Plots, Tracks, FAQ, and requirements. In the online version, an additional section describing plugin installation is included.
3.3.1.8
Client-Server architecture and distributions
can be built in two different formats. The first format contains Perl and C command-line based code while it is removed in the other format. This results in a one client distribution which can be run independently from a server (standalone) and one which serves only as a front end for the server distribution (dependent). The dependent distribution is beneficial for those users running a client computer which does not meet the requirements to run the Shannon pipeline. The standalone distribution offers greater flexibility and allows pipeline execution on either the client or server machines.
I encountered several hurdles while attempting to create a standalone distribution. First, CLC-Bio requires that only one copy of the program can be executed at a time for each license a user has obtained. The Workbench has built-in functionality which disallows multiple executions of the same plugin on either the workbench or server. However, this functionality does not prevent a user from running the Shannon pipeline on their client machine and a server machine at the same time. To prevent this, I added code within LaunchPipelineAlgo which checks if the Shannon pipeline is already being executed on the client or server machines. If the pipeline is being executed in one location, submitting a job to the other is disallowed and an error message is displayed to the user.
Distributions created through Ant are sent to CLC-Bio where they are encoded and posted on their website and within the Workbench plugin section for download. C files are encrypted independently from CLC-Bio using openssl. Upon a signal from LaunchPipelineAlgo, if C libraries are not already installed they are decrypted, compiled, and the source is deleted. To use the Shannon pipeline, a user must enter a license key provided by CLC-Bio. In total, 5 distributions currently exist for download: 1) Shannon pipeline server 2) Shannon pipeline client (standalone) 3) Shannon pipeline client (dependent) 4) hg18 databases 5) hg19 databases. Uninstallation is accomplished through the plugin widget in the Workbench. In the case of hg18 and hg19 database plugins, databases are deleted upon uninstallation.
spaces are present by submitting the command as an array. Doing this specifies where spaces in the command are by placing space delimited elements into the array. Spaces present in any single element of the array are automatically escaped properly. Secondly, most OS X distributions do not include GCC by default. GCC is required to compile the C libraries. Users must manually download either Xcode or other software containing GCC to be able to compile the libraries. This requirement is specified in the Shannon pipeline documentation.
3.4 Performance of the Shannon pipeline software
The unique identifier present in both the VCF or tab-delimited format serves several purposes. Input data may be stored in a hash allowing efficient annotation of individual variants or those originating from multiple exome or genome sequences. Given the minimum overhead from chromosome processing incurred to process each individual chromosome present in the input data (~1 hour if all chromosomes present in input file). This startup time is based largely on the annotation process. Unique identifiers allow input to be combined, thus reducing total run-time and required user interaction.
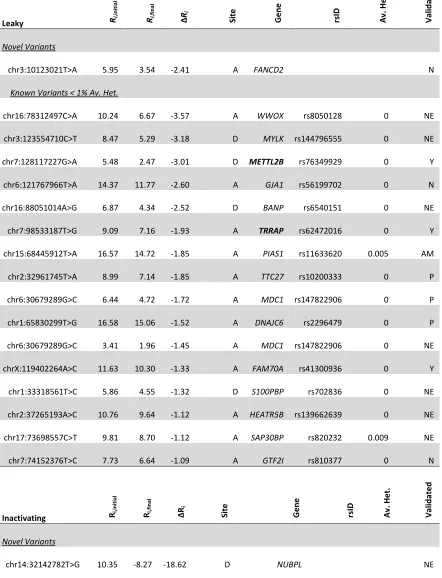
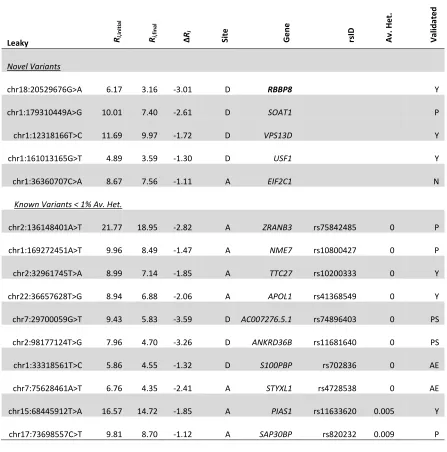
To assess performance, all point mutations detected in the complete genomes of the three cancer cell lines were analyzed using the pipeline. Variants in the cell lines U2OS (osteosarcoma-derived), A431 (epidermoid squamous carcinoma-derived) and U251 (glioblastoma-derived) were examined and filtered to create tractable sets of variants. Predicted splice-altering mutations not found in dbSNP135 (a list of ~54 million known nucleotide polymorphisms) and those with less than 1% average heterozygosity are reported (Appendix A).
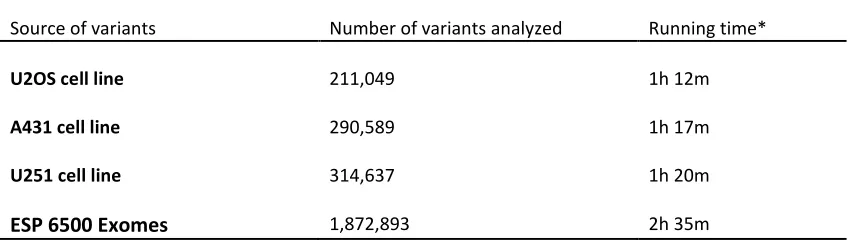
chromosome must be read and parsed. A complete analysis of 300 variants on a single small chromosome (e.g., chromosome 22) can be completed in 5 minutes. Variants distributed throughout all chromosomes require at least one hour to process. The Shannon pipeline should be executed on a machine with sufficient RAM to store the largest human chromosomes in memory with each base requiring 17 bytes of memory (≥ 4 gigabytes). When all chromosomes are represented, increasing the number of mutations results in an approximately linear increase in actual computation time, after accounting for the overhead required for memory management of genome sequences and annotations. For example, 2 hours 35 minutes is required to analyse 1,872,893 sequence variants from the most recent data release on the Exome Variant Server (http://evs.gs.washington.edu/EVS/).
Table 2. Performance of Shannon Pipeline for mRNA splicing mutation prediction
Source of variants Number of variants analyzed Running time*
U2OS cell line 211,049 1h 12m
A431 cell line 290,589 1h 17m
U251 cell line 314,637 1h 20m
ESP 6500 Exomes 1,872,893 2h 35m
4
Shannon pipeline - Results
4.1 Stratification of variants
Similar to ASSA, the pipeline analysis produces summary tables for different types of mutations (assuming each type is represented): 1) complete sets of all splicing variants, 2) mutations predicted to inactivate splice sites, 3) leaky splicing mutations that reduce but do not abolish splicing and 4) cryptic splice sites that are either activated, inactivated or reduced in strength. Inactivating variants are defined as those that reduce the Ri of the
affected binding site below 1.6 bits 35. Binding sites containing a leaky variant are defined as those, in which initial Ri is decreased upon mutation to Ri > 1.6. Finally,
candidate cryptic sites encompass all sites with higher affinity for binding than a corresponding natural site based on comparison of their respective Ri values. Tabular data
can be sorted by clicking the column header of each column. Data can be exported and viewed without modification in a spreadsheet program using CLC-Bio’s built in export functionality.
The 5′ end of the first exon and the 3′ end of the last exon of a gene are not splice sites. They instead form the boundary of the gene. Therefore, the Shannon pipeline does not report mutations that affect their ∆Ri at these positions; the exception being genes that
encode alternate splice forms using further upstream/downstream exons present in Ensembl 66. Variants which alter the strength of cryptic splice sites within the first and last exons are also considered. Use of a strengthened cryptic donor in the first exon or acceptor in the last exon could lead to a truncated exon. The Shannon pipeline considers the exonic cryptic sites of the opposite polarity (acceptors in first exons and donors for last exons), as their activation could potentially - but rarely - lead to the formation of a cryptic intron within these exons if a second pre-existing cryptic site of opposite polarity is present in the proper orientation.
±1 bit. One bit corresponds to an approximately 2 fold difference in binding affinity, which is the limit of detection of fold change by quantitative real-time polymerase chain reaction (qPCR) 39. The user then filters out those variants least likely to be functionally relevant. For example, a natural site that has experienced an increase in information content will generally not be of interest. The increase will likely only serve to widen the existing gap in Ri between the natural and nearby cryptic sites. Thus, it is recommended
those natural sites with positive ∆Rivalues as well as cryptic sites with reductions in Ri
value be removed. Pipeline generated annotations that are found in the tabular output help simplify the data filtering process. As discussed, tabular results are displayed in separate tables used to distinguish natural and cryptic splicing mutations. Recommended filters used for cryptic splicing mutations are based on criteria given in 34 (a) ∆Ri > 0, (b) cryptic
site is located within an exon or within an intron less than 300 bp from nearest natural site, (c) cryptic splice site Ri value exceeds the strength of the nearest natural site Riof the
same type and (d) intronic cryptic splice sites are selected 5′ to the exon if acceptors and 3′ to the exon, if donors. All reported variants are further categorized according to whether they had been previously reported or were novel by the Shannon pipeline. In
Table 3, only novel and known variants < 1% average heterozygosity in dbSNP are reported. Variants < 1% average heterozygosity are more likely to be functionally significant due to selection (deleterious variants are selected against). Nevertheless, any threshold for filtering based on heterozygosity can be used by the user.
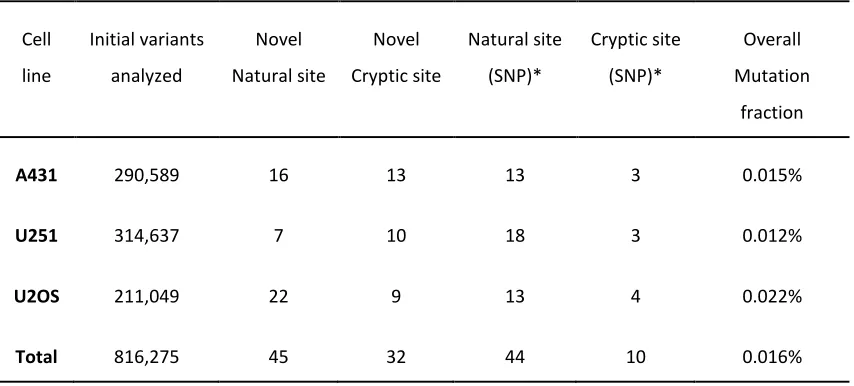
Filtering of cryptic splice sites exceeding the strength of and close to adjacent natural sites of the same phase eliminates many predicted unused cryptic sites with changes in Ri
Table 3. Enrichment for predicted splicing mutations after processing and filtering
Note *dbSNP135; <1% heterozygosity; minor allele
Cell
line
Initial variants
analyzed
Novel
Natural site
Novel
Cryptic site
Natural site
(SNP)*
Cryptic site
(SNP)*
Overall
Mutation
fraction
A431 290,589 16 13 13 3 0.015%
U251 314,637 7 10 18 3 0.012%
U2OS 211,049 22 9 13 4 0.022%
4.2 Displaying results
Riand final Ri values are plotted by chromosome location, similar to Manhattan-style
representations, for either individual chromosomes or entire genomes. Hovering the cursor over data points generates tooltips containing information needed to find the complete entry within the corresponding tabular data. To locate interesting data points, a zoom function allows closer inspection of the plot. This visualization allows patterns to be observed and data points which stand out to be easily located and inspected more closely in tabular format or on the ASSA server.
Chromosome-specific, custom browser tracks indicating ∆Ri values in BED format are
also generated. This enables visualization of predicted mutations in the context of other genome annotations, for example, mapped reads from RNA-seq, spliced expressed sequence tags (ESTs) and known mRNAs. Figure 4 depicts three methods of displaying Shannon pipeline results.
4.3 Validation with RNA-seq expression data
RNA-seq analysis using published data from these cell lines 40 was used to compare Shannon pipeline results with expression data. TopHat 41 was executed with the following command-line options: -g 5 --solexa1.3-quals -p 8, and examined with the Integrative Genomics viewer (IGV) 42 to interrogate predictions made with the Shannon pipeline.
Several variants detected in genomes of U2OS, U251 and A431, which were predicted to affect splicing, were compared to the distribution of RNA-seq reads in their respective regions of the transcriptome. When interpreting these data, it is assumed that predicted mutations are present in a genetic background, in which the other parentally derived
allele lacks the same variant (i.e., heterozygous). Abnormal reads or exon skipping of the
mutant allele is viewed in the context of a single allele and expected normal splicing of
the corresponding exon. For mutations that are predicted to inactivate a splice site, it is
Figure 4. Twelve DNA sequences and their corresponding information changes.
The Shannon pipeline software generates the following types of output. A. Tabular results showing the first 12 of 134 changes in Ri values at different genomic coordinates
predicted to be significant, after filtering for cryptic splicing mutations from all variants (n=22,197) in a complete genome sequence. The first filter eliminates exonic cryptic sites, the second selects cryptic sites with increased Ri values, the third ensures that the
cryptic site is stronger than the corresponding natural site of the same phase and the final filter ensures that all remaining sites exceed the minimum Ri value of a functional splice
site. B. Manhattan-like plot indicating the locations and changes in Ri of all variants
which alter splice site information in a region within intron 1 of BRCA1 (chr17:41277500-41288500) from different individuals with increased breast cancer risk.
the wild type allele. Natural splice site mutations are expected to significantly reduce the
number of splice junction-spanning reads in relative to those in the adjacent exons,
consistent with exon skipping. In some cases, intron inclusion adjacent to a splice site
variant with lower Ri value may also be evidence of a splicing mutation. In U2OS, 10 of
13 novel inactivating variants found in mutated natural splice sites met these criteria,
along with an additional 2 probable mutations (Appendix A, Table S1). The same criteria
were met by 2 of 4 (with 1 additional probable) novel inactivating variants in U251
(Appendix A, Table S2), and 4 of 7 (with 1 additional probable) variants in A431
(Appendix A, Table S3).
Shannon pipeline predictions were supported by expression data for 1 of 7 activated
cryptic site variants in U2OS, 1 of 14 variants in A431 and 0 of 10 in U251. Many of the
predicted splice sites reside in intronic regions or alternative exons that map far upstream
or downstream of constitutively expressed exons. They are unlikely to displace
constitutive isoforms, since donor site recognition is processive 43 and the increased
lengths of such cryptic exons would probably be suboptimal 44. Often, these sites are
associated with rare, alternatively spliced ESTs expressed in other tissues than these cell
lines. Because these variants are often extra-exonic, changes in expression must be
inferred indirectly from decreased read count, intron inclusion or increased exon
skipping. Changes in reading frame from inclusion of out-of-phase intronic sequences
may induce nonsense-mediated decay (NMD). Reads mapping to adjacent introns are
expected to be reduced in number as a result of NMD. Sequencing reads that are
concentrated in the intronic region adjacent to exon of interest are considered support for
predicted mutations. NMD may also affect transcript read counts associated with severe
leaky or inactivated natural donor sites, which produce exon skipping with
frame-shifting. Several predicted splicing mutations confirmed by RNA-seq are well-known driver mutations that contribute to tumor phenotypes.
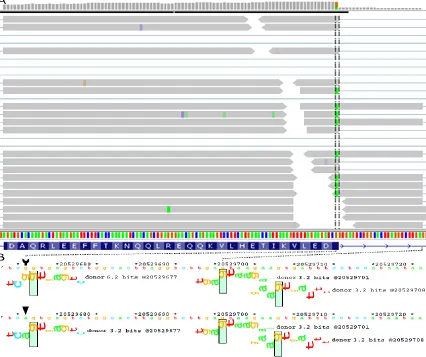
Interesting results include a unique natural donor site mutation within RBBP8 (NM_203291.1:c.248G>A or chr18:20529676G>A; 6.2 3.2 bits [indicating the change in the Ri value of the donor site, before and after it is mutated]) in A431, a tumour
processing of a covalent topoisomerase-DNA complexes. The mutation weakens but does not abolish the natural donor site from 6.2 to 3.2 bits. A cryptic mRNA splice form using a pre-existing donor site 24bp downstream to the weakened natural site is confirmed by RNA-seq (Figure 5A). The ASSA server predicts the activation of this intronic cryptic donor site, as well as a second site of equal strength further downstream to the mutated donor site (Figure 5B). There are a total of 56 reads that both encroach into the intron and overlap this variant. Forty-one of these cover the cryptic exon splice junction of interest (the aligned reads stop at the 3.2 bit cryptic site, which is 24 nt downstream of the natural site, and continue into the next natural exon). Thirty-one junction spanning reads also contain the A-allele. There are an additional 23 reads that cross into the intron, but do not extend as far as the cryptic site of interest. In 19 cases, these reads contain the A-allele. The remaining 4 intron-crossing reads which contain the G-allele appear to be misaligned, as they contain short matches (≤ 3 nt) to the downstream exon. There are an additional 2 reads that span the junction between the downstream cryptic exon junction and the adjacent exon (31 nt downstream; also 3.2 bits). Finally, 12 reads are correctly spliced and contain the mutant A-allele, suggesting that the natural site is not completely inactivated by this nucleotide substitution, which is consistent with leaky splicing.
Changes in expression are also noted in other genes. DDX11 is inactivated in U2OS (chr12:31242087T>G; 6.89 11.73 bits). DDX11 is a component of the cohesin complex which has a crucial role in chromosome segregation, and is essential for survival of advanced melanoma 45. In U2OS, WWOX, a tumor suppressor gene in osteosarcoma 46, contains a leaky mutation (chr16:78312497C>A; 10.24 6.67 bits). Both alleles of APIP, an apoptosis associated gene, are inactivated in U251 (chr11:34905054G>C; 9.32
0.54 bits). Gene expression of APIP is down regulated in non-small cell lung carcinoma 47. Amplification of METTL2B, which harbors a leaky mutation in U251 (chr7:128117227G>A; 5.48 2.47 bits), has been demonstrated in several cancers, including glioblastoma 48. In A431, leaky mutations are also confirmed in the glioblastoma-initiating gene TRRAP (chr7:98533187T>G; 9.09 7.16 bits; 49) and USF1 (chr1:161013165G>T; 4.89 3.59 bits), which encodes a transcription regulator important for TGFβ2 expression in glioblastoma 50
Figure 5. Predicted mutation splicing phenotype supported by RNA-seq
Predicted RBBP8 splicing mutation, chr18:20529676G>A (NM_203291.1: c.248G>A), is related
to transcripts mapped to this region. A. IVG genome browser display of read distribution at the
exon 4/intron 4 junction. Green boxes within the vertical hashed lines indicate the presence of the
A allele. B. The natural and cryptic splice sites illustrated by sequence walkers generated on the
ASSA server. The arrow tail and head draw attention to the location and sequence of the
reference and variant sequence. The mutation reduces the strength of the natural donor site from
6.2 to 3.2 bits. All but 3 of the 59 reads extending into the intron contain the variant allele, as
indicated by the green positions within the reads. These reads extend into the exon and terminate
at the closest intronic cryptic donor site (chr18:20529700). The mutated natural and cryptic sites
significant percentage of head and neck squamous cell carcinomas 51, contains an inactivating splice site variant in A431 (chr14:64669514T>A; 1.89 0.83 bits). RRM2B, an inducible DNA repair gene that has been implicated in squamous cell carcinoma 52, contains an inactivating mutation in A431 (chr8:103250667A>C; 3.6
15.02 bits). SMARCD1, encoding a chromatin modulator that interacts with nuclear receptor transcription factors, is also inactivated in A431 (chr12:50480538G>C; 8.46
3.21 bits), and has been shown to be mutated in hepato- and other carcinomas 53.
Several mutations were found in potential tumor-associated genes, with either suggestive or little supporting expression data. However, defects in many of these genes have been implicated in various neoplasias including glioblastoma, osteosarcoma, and epidermoid squamous carcinoma. In general, these were predicted leaky mutations, where effects (diminished read counts and exon skipping) were inferred against the confounding background of a presumably intact allele. Natural site mutations in FANCD2 (NM_033084.3:c.3106-9T>A; 6.0 3.5 bits; delayed activation of the DNA damage response in gliomas 54) and MDC1 (NM_014641.2:c.2129-8G>C; 6.4 4.7 bits; mediator of the DNA damage checkpoint and underexpressed in many cancers 55) were found in the U251 cells.
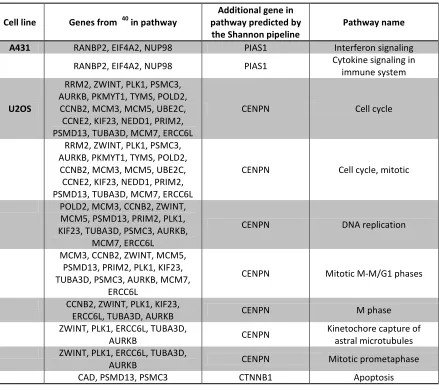
4.4 Characterization of defective pathways
Table 4. Enriched pathways containing genes predicted by the Shannon pipeline
Cell line Genes from 40 in pathway
Additional gene in pathway predicted by
the Shannon pipeline
Pathway name
A431 RANBP2, EIF4A2, NUP98 PIAS1 Interferon signaling
RANBP2, EIF4A2, NUP98 PIAS1 Cytokine signaling in immune system
U2OS
RRM2, ZWINT, PLK1, PSMC3, AURKB, PKMYT1, TYMS, POLD2,
CCNB2, MCM3, MCM5, UBE2C, CCNE2, KIF23, NEDD1, PRIM2, PSMD13, TUBA3D, MCM7, ERCC6L
CENPN Cell cycle
RRM2, ZWINT, PLK1, PSMC3, AURKB, PKMYT1, TYMS, POLD2,
CCNB2, MCM3, MCM5, UBE2C, CCNE2, KIF23, NEDD1, PRIM2, PSMD13, TUBA3D, MCM7, ERCC6L
CENPN Cell cycle, mitotic
POLD2, MCM3, CCNB2, ZWINT, MCM5, PSMD13, PRIM2, PLK1, KIF23, TUBA3D, PSMC3, AURKB,
MCM7, ERCC6L
CENPN DNA replication
MCM3, CCNB2, ZWINT, MCM5, PSMD13, PRIM2, PLK1, KIF23, TUBA3D, PSMC3, AURKB, MCM7,
ERCC6L
CENPN Mitotic M-M/G1 phases
CCNB2, ZWINT, PLK1, KIF23,
ERCC6L, TUBA3D, AURKB CENPN M phase
ZWINT, PLK1, ERCC6L, TUBA3D,
AURKB CENPN
Kinetochore capture of astral microtubules ZWINT, PLK1, ERCC6L, TUBA3D,
AURKB CENPN Mitotic prometaphase