Model Predictive Control for Process Flow
Application using LabVIEW
Poornima.V1, B.P. Harish2, Senior Member, IEEE
PG Scholar (C&I), Department of Electrical Engineering, University Visvesvaraya College of Engineering,
Bangalore University, Bengaluru, Karnataka, India1
Associate Professor, Department of Electrical Engineering, University Visvesvaraya College of Engineering,
Bangalore University, Bengaluru, Karnataka, India2
ABSTRACT: This paper proposes a comparative study of a Proportional - Integral - Derivative (PID) control scheme
and a Model Predictive Control (MPC) strategy for flow control applications. When the control system encounters nonlinearity, the conventional PID control exhibits oscillations. Hence, MPC has proven to be a better and advanced process control in case of dynamic system. In this paper, an MPC control loop for water flow control is proposed with the control algorithm being implemented on a hardware setup for analysis that is interfaced with LabVIEW via Arduino Nano. The behaviour of MPC is demonstrated to be superior to PID controller based on step response and an evaluation of a set of performance parameters like Integral Square Error (ISE), Integral Absolute Error (IAE), settling time, rise time, percentage of peak overshoot.
KEYWORDS: flow control, PID, MPC, LabVIEW, IAE, ISE, Settling Time, Rise time, percentage of peak overshoot.
I. INTRODUCTION
Proportional-Integral-Derivative (PID) controllers are control loops widely used in the process control industry, for the ease with which the plant output can be modulated. Although, PID controller is meant to balance all three-gain parameters that affect the entire setup and may change the characteristics of transient response such as oscillations, overshoot, and settling time. If the system parameters cannot be precisely estimated and attained, the designed PID gains cannot withstand the unpredictable changes and disturbances, and hence exhibits low robustness.
Presence of a constraint in the process causes instability, which can be regulated with ease by the Model Predictive Controller (MPC) and it is being used in many process industries. MPC has the ability to manage constraints and changes in system parameters and hence, it is best suited for large, multivariable processes. The operation of MPC is compared with conventional PID controller and its robustness is explored.
Rosli et al.have proposed a real-time implementation of model predictive control (MPC) for a dynamic system, using MATLAB/Simulink toolboxes, for flow process applications. The pilot plant is interfaced via DAQ data acquisition card and its performance is compared with traditional PID controller, based on step response and their robustness in presence of disturbance [1]. Ang Li has carried out simulations to demonstrate comparison between Model Predictive Control and PID control for water-level maintenance in a two-tank System [2]. Camacho et al. have explained the working principle and control scheme of MPC [3]. More detailed information about the general implementation of Model Predictive Controller is given in [4].
The block diagram of PID and MPC control schemes are as shown in Figure 1. There are 2 forms of MPC: state space model and Hovorka model [5]. In the proposed work, state space model of MPC is used and is characterized by the following strategy [3]:
(i.e.: past inputs and outputs) and also on the future control signals u (t+k | t), k = 0. . . (N−1), are sent to the system for further calculation.
2) By optimizing a determined criterion, the set of future control signals is computed to ensure that the process follows the reference trajectory w(t + k) i.e., the set point.
Fig. 1: Basic block diagram of (a) PID and (b) MPC.
3) The control signal u(t | t) is sent to the process while previously calculated control signals are rejected, as the next sampling instant y(t + 1) is already well known and first step is repeated with this new value and all the sequences are updated. Thus the u (t + 1 | t + 1) is using the receding horizon concept [6] [7]. In order to implement this MPC strategy, the basic structure shown in Figure 1. (b) is used.
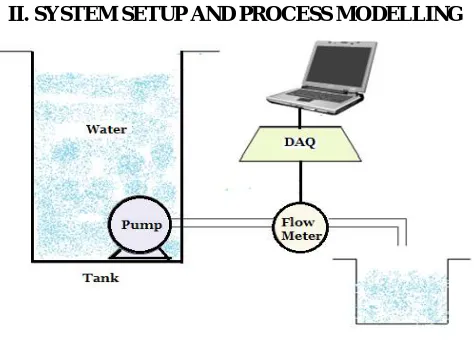
II. SYSTEM SETUP AND PROCESS MODELLING
Fig. 2: System setup
The system hardware setup for flow control application, shown in Figure 2, includes a pump, flow sensor, Arduino Nano for data acquisition (DAQ) between the process and the computer. Software toolkit includes LabVIEW, PID and MPC toolkit [8], and ‘LabVIEW MakerHub LINX’ which is an open source add-on for LabVIEW VIs for interacting with common embedded platforms like Arduino.
Specifications of the pump and flow sensor is as follows:
Pump: 12/24V submersible BLDC motor, flow range: 2ltr/min to 20ltr/min, PWM change from 5 to 100% or a control voltage of 0-5V.
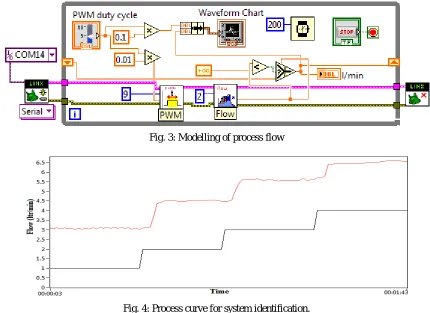
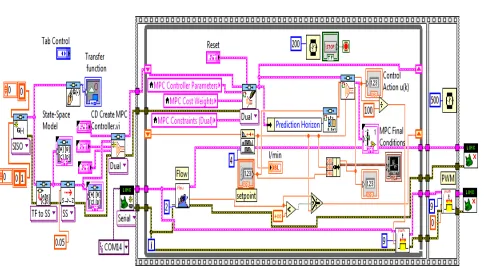
The process flow is modelled in LabVIEW as shown in Figure 3 and hence, the process curve for system identification is generated as shown in Figure 4. The resulting data is used to determine the major characteristics of a flow i.e., the time delay ( ) and the gain (k).
Process flow is modelled as a transfer function of time delay, and is expressed to first order as follows:
Transfer function G(s) = k = 0.13 . = .
. . . . (3)
III. DESIGN OF PID & MPC IN LABVIEW
Using the LabVIEW Control Design and Simulation toolkit, the PID control scheme [9] and MPC control scheme [10] are built and the block diagrams are shown in Figure 5, Figure 6 respectively.
PID Control Scheme: The interface between LabVIEW and Arduino Nano DAQ is initialized using Linx with DAQ
being initialised as an I/O device. The PID controller is tuned so that process variable follows the defined set point. The PWM duty cycle percentage is varied to control the speed of the pump via an analog output to DAQ, which is the manipulated variable.
MPC Control Scheme: Initialization through Linx is performed as in PID control, and transfer function of process flow obtained in Section II is converted into state-space model and fed to ‘Create MPC Controller.vi’. The control parameters and cost weights of MPC are defined in ‘Set MPC controller.vi’ and then MPC controller is implemented. In optimizer, integral action takes place predicting the future outputs, resulting in control action u(k) to ensure that process variable (flow) follows the defined set point resulting in desired output.
Fig. 3: Modelling of process flow
Fig. 5: Block diagram of PID control scheme
Fig. 6: Block diagram of MPC control scheme.
The PID and MPC process model VI’s use the following common sub VI’s, as shown in Figure 7(a) and Figure 7(b):
Flow Input VI: This subVI is used to measure the flow rate in terms of frequency which is scaled to display litre/minute.
Fig. 7: SubVI’s: (a) Flow Input VI and (b) PWM Output VI.
IV. RESULT AND COMPARISON
In this study, the tuning parameters of PID controller like the gain (K), the integral constant (I) and the derivative constant (D), are determined iteratively with the Ziegler Nichols method [10]. Tuned values are found out to be: Kc
=0.6 , Ti = 0.008 min and Td = 0 min.
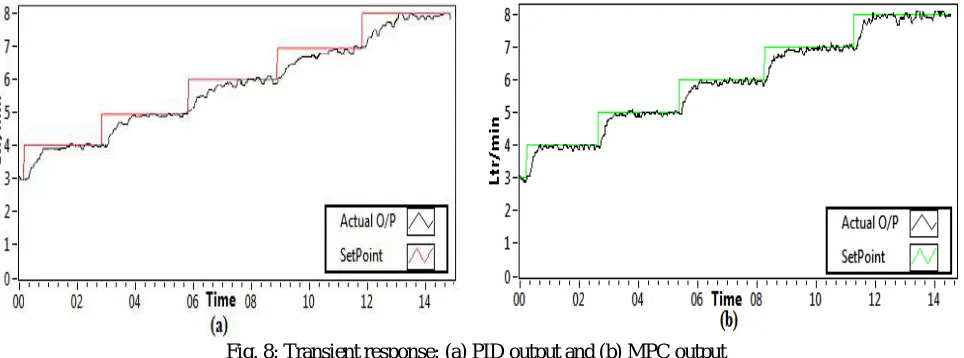
Fig. 8: Transient response: (a) PID output and (b) MPC output
The Figure 8 presents the set point tracking results of PID and MPC schemes. IAE and ISE for both the controllers are calculated [12] for step change from 3 cm to 7 cm in steps of 1 cm and the values are tabulated in Table 1.
Table 1: IAE and ISE of PID and MPC Step
change
IAE ISE
PID MPC PID MPC
3-4 6.8029 4.1397 4.0227 2.2113
4-5 6.4375 4.6404 3.6602 2.5341
5-6 8.3010 5.4674 4.6382 2.5422
6-7 8.8032 5.8211 4.8612 2.7435
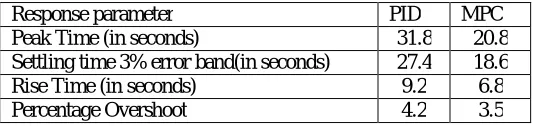
Settling time, peak time, rise time, percentage overshoot of PID and MPC can be analysed from the transient response shown in Figure 6 for a step change from 4 cm to 5 cm.
Table 2: Transient response for PID and MPC control scheme
Response parameter PID MPC
Peak Time (in seconds) 31.8 20.8
Settling time 3% error band(in seconds) 27.4 18.6
Rise Time (in seconds) 9.2 6.8
Percentage Overshoot 4.2 3.5
Table 2 infers that MPC shows better transient response than PID in terms of all transient response parameters. The rise time for a change of 10- 90 %, MPC shows a lesser value which indicates that it is faster than PID controller. MPC shows less percentage of peak overshoot than PID controller. The low ISE for MPC shows it is a better choice than PID control in removing large steady state errors.
V. CONCLUSION
A comparative study of a Proportional-Integral-Derivative (PID) control scheme and a Model Predictive Control (MPC) strategy for flow control applications is presented as depicted in Figure 5 and Figure 6. MPC control loop for water flow control is proposed with the control algorithm implemented on a hardware setup for analysis and is interfaced with LabVIEW via Arduino Nano DAQ.
Table-1 demonstrates the performance of MPC is superior to PID controller based on step response and its parameters like Integral Square Error (ISE), Integral Absolute Error (IAE), settling time, rise time, percentage of peak overshoot. Table-2 shows the MPC controller is faster in terms of rise time, settling time and exhibits less percentage overshoot and less sustained oscillations. Hence, MPC is the choice of the control designer in applications demanding smaller value of spike in process variable.
REFERENCES
[1] Nurfatihah Syalwiah Rosli, Rosdiazli Ibrahim, “Real-Time Implementation of Model Predictive Control for Flow Control Application”, 5th
IEEE International Conference on Intelligent and Advanced Systems (ICIAS), 3-5 June 2014, pp. 1-5, 2014.
[2] Ang Li, “Comparison between Model Predictive Control And PID Control For Water-Level Maintenance In A Two-Tank System’’, BS in
Information Engineering, University of Science and Technology, Beijing, 2008.
[3] Camacho and Bordons, “Model Predictive Control,” 2nd Edition, Springer Verlag, London, 2004, pp. 1-4.
[4] Control Design User Manual, © 2004–2009 National Instruments Corporation. Chapter 18, pp. 18-1 to 18-19.
[5] E. Semizera, M. Yüceerb, ˙I. Atasoyc, R. Berbera, “Comparison Of Control Algorithms For The Blood Glucose Concentration in a Virtual
Patient with an Artificial Pancreas”, Elsevier Journal of Chemical Engineering Research and Design, pp. 930-934, 2012.
[6] Leonidas G. Bleris, “Embedded Model Predictive Control For System-On-A-Chip Applications”, Journal of Process Control Journal of
Process Control, Volume 16, Issue 3, Pages 255–264, March 2006.
[7] Dan Henriksson, Anton Cervin, Johan Akesson, Karl-Erik Arzen, “Feedback Scheduling of Model Predictive Controllers”, Real-Time and
Embedded Technology and Applications Symposium, Eighth IEEE, ISSN:1545-3421, pp 207 – 216, 2002
[8] CD Create MPC Controller (Control Design Toolkit), http://zone.ni.com/reference/en-XX/help/370853D-01/lvctrldsgn/cd_creatempc/,©2009
National Instruments Corporation.
[9] LabVIEW, PID Control Toolkit User Manual, © 1996–2008 National Instruments Corporation, June 2008.
[10] Hans-Petter Halvorsen, “Model Predictive Control in LabVIEW”, Telemark University College, Department of Electrical Engineering,
Information Technology and Cybernetics, pp.3-20, 30-06-2011.
[11] Donald R. Coughanowr, Steven E. LeBlanc “Process Systems Analysis and Control”, Third edition by, McGraw-Hills international
publication.pp.335-343,2009.