EFFECTS OF FOUNDATION SLIDING ON PROBABILISTIC RESPONSE
OF A NUCLEAR STRUCTURE
Alidad Hashemi1, Tarek Elkhoraibi2, and Farhang Ostadan3
1 Senior Engineer, Bechtel Corporation, San Francisco, CA ([email protected]) 2 Senior Engineer, Bechtel Corporation, San Francisco, CA
3 Bechtel Fellow, Chief Engineer, Bechtel Corporation, San Francisco, CA
ABSTRACT
This paper examines the effects of foundation sliding on the results of probabilistic structural analysis of a typical nuclear structure where foundation sliding, structural nonlinearity, and soil-structure interaction (SSI) are explicitly simulated. The evaluation is carried out for a soil and a rock site at 10,000 year, 100,000 year, and 1,000,000 year return periods (1E-4, 1E-5, and 1E-6 hazard levels, respectively) using a sample size of 30. The statistical distribution of structural responses including story drifts, and in-structure response spectra (ISRS) as well as foundation sliding displacements are examined. For the subject structure, the inclusion of foundation sliding in the analysis is found to have reduced both structural and nonstructural seismic demands and their corresponding dispersion.
INTRODUCTION
The probabilistic nonlinear analysis described in this paper is part of a comprehensive Integrated Soil-Structure Fragility Analysis (ISSFA) which evaluates the seismic performance of a reinforced concrete shear wall building, typical of nuclear industry structures by quantifying its annual failure probability. The ISSFA methodology is described in Hashemi et al. (2009) and Elkhoraibi et al. (2011).
The subject structure is designed using deterministic analysis to remain elastic at 10,000 year return period seismic hazard level. The probabilistic analysis is carried out for each of the examined return periods in three stages: (1) site response analysis, (2) soil structure interaction analysis, and (3) nonlinear (foundation and structure) analysis. The site response analysis is carried out to obtain the free-field seismic ground motion and strain-compatible soil properties at the building site. The SSI analysis is performed using SASSI2010 (UC Berkeley, 2011), which explicitly includes the structural model as well as the subsurface in a linear frequency domain analysis and uses the free-field ground motions and strain-compatible soil profiles from stage (1) as input. Finally, the nonlinear response-history analysis is carried out in OpenSEES (Mazzoni et al., 2006) using the motion from stage (2) calculated in the soil or rock immediately below the foundation as input and explicitly including significant interface and structural nonlinearities. The source of interface nonlinearity is sliding of the foundation on its supporting media and the source for the structural nonlinearity is the nonlinear shear behavior of the squat shear walls. The modeling, calibration, and results of the analysis including only the structural nonlinearity are discussed in a companion paper by the authors titled “Effects of Structural Nonlinearity on Probabilistic Response of a Nuclear Structure.” This paper focuses on the interface modeling and discusses the analysis results in light of the explicit consideration of foundation sliding potential.
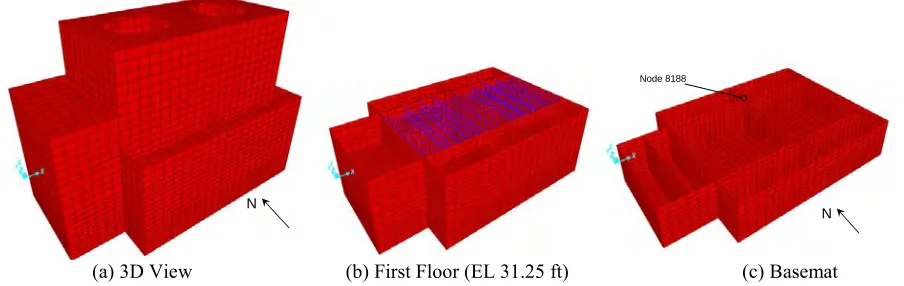
other direction at El 80 ft. Steel beams form a platform between El 46 ft and El 62 ft as shown in the middle portion of the structure in Figure 1(b). The roof is at El. 114 ft. An equivalent lumped mass and stick model (LMSM) of the structure is also developed (shown in Figure 2) which is used for all dynamic analyses. More details regarding the modeling of the structure and considerations to include structural nonlinearity are presented in the companion paper by the authors. Story drifts for the structure are calculated in the East-West (X) and North-South (Y) directions along a vertical line passing at the junction of major shear walls on Col. Line 2 and Col. Line B (node 8188, shown in Figure 1(c)). The ISRS results discussed in this paper are also calculated along the same vertical line. The main structural characteristics for the structure are summarized in Table 1.
The structural model is augmented using a nonlinear interface element between the foundation of the structure (assumed rigid in the OpenSEES analysis) and the point at which the input motions calculated from the SSI analyses are applied. The nonlinear interface element used to model the foundation sliding is capable of accounting for bidirectional combination of inertia forces on the interface as well as the change in the normal forces on the friction surface below the foundation due to the vertical component of the input motion. If the inertial forces in the structure are not enough to overcome the frictional resistance of the interface element, the nonlinear analyses becomes a fixed base analysis with the foundation motion obtained from the SSI analysis. Otherwise, a slip between the foundation and subgrade material occurs which has the potential to affect the dynamic response of the structure above.
Such effects are investigated by considering the structure as supported on two different subsurface conditions corresponding to a deep soil site (VS30 = 1590 fps), and a shallow rock site
(VS30=5315 fps). Thirty realizations of the nonlinear model (soil, structure, and interface) are obtained
using Latin-Hypercube Sampling (LHS) and include appropriate uncertainty in the subgrade soil profiles, values of structural nonlinearity parameters, as well as the uncertainly in the friction coefficient at the foundation-soil interface. Uncertainty considerations and the values chosen for the best estimate (median) and logarithmic standard deviation (Log-SD) for the subgrade and structural properties are discussed in the companion paper by the authors. For the interface model, the best estimate and Log-SD of the friction coefficient between the foundation and the subgrade material are selected as 0.5 and 0.4, respectively, for both soil and rock sites.
The foundation motion acceleration time-histories are calculated for each site (soil or rock) for low frequency (LF) and high frequency (HF) bedrock motions at 10,000 year, 100,000 year, and 1 million year return periods (1E-4, 1E-5, and 1E-6 hazard levels). The calculation of the foundation input motions involves comprehensive site response analysis, and SSI analysis of the considered structure and sites. The site response analysis and the SSI analysis are not in the scope of this paper, and are discussed in the companion paper by the authors as well as Elkhoraibi, et al (2012). The calculated foundation motions are used as input to nonlinear response history analyses (RHA) of the nonlinear model. The time-history of the foundation displacement (slip), base shear, story displacements, element forces, and floor accelerations are obtained from the nonlinear and linear RHA for each realization of LHS at each considered return period.
(a) 3D View (b) First Floor (EL 31.25 ft) (c) Basemat
Figure 1. Selected Structure – 3D Views
N N
Node 8188
N
Node 8188
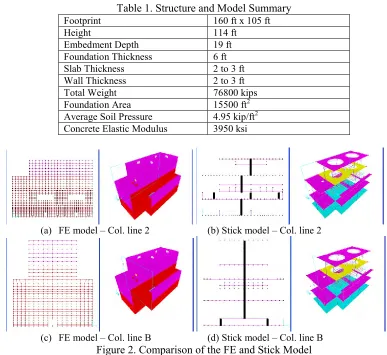
Table 1. Structure and Model Summary
Footprint 160 ft x 105 ft
Height 114 ft
Embedment Depth 19 ft
Foundation Thickness 6 ft
Slab Thickness 2 to 3 ft
Wall Thickness 2 to 3 ft
Total Weight 76800 kips
Foundation Area 15500 ft2
Average Soil Pressure 4.95 kip/ft2
Concrete Elastic Modulus 3950 ksi
(a) FE model – Col. line 2 (b) Stick model – Col. line 2
(c) FE model – Col. line B (d) Stick model – Col. line B Figure 2.Comparison of the FE and Stick Model
INPUT MOTION FOR NONLINEAR ANALYSES
As discussed above, each nonlinear response-history analysis case is carried out as a fixed base analysis with the input motion applied below the interface element. The SSI effects are accounted for using a foundation motion which is different than the free field motion and is obtained from 3D SSI analysis of the structure for that case. The details of the SSI analysis are not in the scope of this paper are can be found in Elkhoraibi et al (2012). The foundation motions are obtained from the SSI analysis at each of the HF4 (HF motion at 1E-4 intensity level), LF4, HF5, LF5, HF6, and LF6 intensity levels in each direction. The translational motion in X, Y, and Z directions are considered as uniform accelerations recorded on a node at the intersection of column lines 2 and B (major walls in X and Y directions, respectively) on the basemat of the structure. The foundation rigid body rotation is calculated from the SSI analyses results and considered in calculation of the seismic response (ISRS and total displacements). The nonlinear RHA applies the foundation acceleration time-histories in all directions simultaneously.
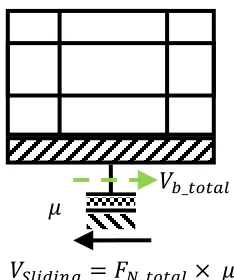
As discussed earlier, the nonlinear structural model developed in OpenSEES is modified to include the mass of the foundation and a nonlinear sliding element as schematically depicted in Figure 3. The foundation itself is modeled using stiff beam elements which constrain the bases of the stick model columns together. The rotational degrees of freedom for the foundation supports are restrained since the rocking and torsional response of the structure do not change the net normal force or net base shear acting at foundation-soil interface. The OpenSEES nonlinear sliding element used is the 3D Flat Slider Bearing element (http://opensees.berkeley.edu/wiki/index.php/Flat_Slider_Bearing_Element) with Coulomb friction behavior defined by coefficient of friction ( ). The element accommodates a sliding surface where bidirectional inertia forces are combined to determine the total driving force. The maximum shear across the element is the sliding resistance calculated as the product of the coefficient of friction and the instantaneous normal force on the surface. The normal force includes the weight of the structure and the inertial effects of the vertical motion on the structure. In both soil and rock subgrade cases the ground water table is assumed to be below the bottom of the foundation elevation; therefore, the normal forces are not reduced due to buoyancy.
Figure 3. Schematic Modeling of the Foundation Sliding
The time-history of the response of the structure further illustrates the sliding features included in this study. As an example, the time-history of the forces acting across the nonlinear sliding element obtained for the 23rd realization of the structure (LHS-23) at rock site given the HF6 input motion are
presented. This realization corresponds to the largest sliding displacement for the rock subsurface subject to HF6 input motion. Figure 4 provides the time-history of the base-shear components in the X and Y direction over the first 25 seconds of the input time-history and an expanded version of the same information for the period between 2 and 5 seconds. The magnitude of the total base shear (as a vector) calculated as the SRSS of the X and Y components are also presented in this figure. The normal force across the nonlinear element which consists of the weight of the structure plus the inertial forces induced by the vertical response of the structure are multiplied by the coefficient of friction for realization LHS-23 ( ) to obtain the sliding resistance at each instant of time. The sliding resistance and the total base shear are presented in Figure 5 over the first 25 seconds of the input time-history and a blown up version of the same information for the period between 2 and 5 seconds. The same figure also provides the total sliding displacement as a function of time with values presented on the right hand vertical axis. Finally, the sliding displacement in the X and Y direction are calculated and presented in Figure 6. The total maximum sliding displacement measured for this analysis is 1.83 inches with the maximum sliding displacements in the X and Y directions calculated as 1.28 inches and 1.32 inches, respectively.
The response shown in Figure 5 (b) is especially instructive in understanding the sliding response of the structure. Note that a major foundation slide occurs between 4th to 5th seconds of the response
where the total base shear is equal to the sliding resistance.
𝑉
𝑏𝑥𝐹
𝑁_𝑡𝑜𝑡𝑎𝑙𝑉
𝑏𝑦𝑉
𝑏_𝑡𝑜𝑡𝑎𝑙𝐹𝑁_𝑡𝑜𝑡𝑎𝑙: Total normal force including effects of vertical input motion.
𝑉𝑏𝑥 and 𝑉𝑏𝑦: Base shear components in the X and Y directions.
𝑉
𝑏_𝑡𝑜𝑡𝑎𝑙𝑉
𝑆𝑙𝑖𝑑𝑖𝑛𝑔𝐹
𝑁_𝑡𝑜𝑡𝑎𝑙× 𝜇
(a) First 25 seconds of the response time-history (b) Three-second zoom Figure 4. Base Shear Time-History for Study Case 6, HF6, LHS-1
(a) First 25 seconds of the response time-history (b) Two-second zoom Figure 5. Sliding Resistance Time-History for Rock Site, HF6, LHS-1
Figure 6. Sliding Displacement Time-History for Rock Site, HF6, LHS-1 NONLINEAR RESPONSE HISTORY ANALYSES AND RESULTS
The 3D nonlinear RHA are carried out using the nonlinear model described above in OpenSEES, and the foundation motion time-histories as input. The OpenSEES analysis is a time-domain analysis using Newmark integrator (gamma = 0.5, beta = 0.25) and mass and stiffness proportional damping defined in terms of structural frequency. Note that the value of the assigned nominal damping ratio varies in each realization of the structural model (30 LHS cases) according to a lognormal distribution with mean of 5% and log-standard deviation of 0.6. The analysis time step is 0.005 sec. For each step the convergence test is carried out on the basis of the total energy corresponding to the unbalanced forces and displacements with a threshold of 10-8 kip-ft.
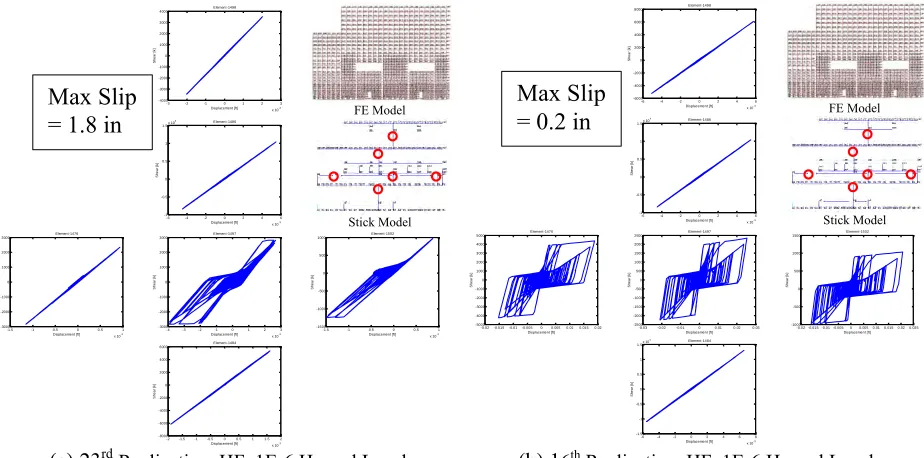
The nonlinear RHA results are obtained for × × × runs (30 realizations for the HF and LF motions at 1E4, 1E5, and 1E6 intensity levels on soil or rock subgrades). The cases selected for presentation are the 16th and 23rd realizations (LHS-16 and LHS-23) of the HF motion at 1E-6 (HF6)
hazard level on the rock site and the 5th and 15th realizations (LHS-5 and LHS-15) of the LF motion at
each case is also provided in each figure. Cases LHS-23 for rock, and LHS-5 for soil correspond to the largest foundation slip observed between the 30 realizations for their respective input motions. Cases LHC-16 for rock, and LHC-15 for soil correspond to cases with more severe response nonlinearity. The results presented here are for the major walls at column line 2 (X direction) shown in Figure 7 and Figure 8. These results suggest an inverse relationship between the extent of foundation slip and severity of structural damage. The collations of the probabilistic results which are presented next strengthen the same observation.
(a) 23rdRealization, HF, 1E-6 Hazard Level (b) 16th Realization, HF, 1E-6 Hazard Level
Figure 7. Examples of Nonlinear Shear Wall Response, Column Line 2, X Direction, Rock Site
(a) 5th Realization, LF, 1E-6 Hazard Level (b) 15th Realization, LF, 1E-6 Hazard Level
Figure 8. Examples of the Nonlinear Shear Wall Response, Column Line 2, X Direction, Soil Site In the ISSFA analysis of the subject structure, structural failure is defined in terms of the interstory drift ratio (differential displacement between the top and bottom of each story divided by the height of that story). These drift ratios are calculated both in linear analyses and nonlinear analyses (with
FE Model
Stick Model -3 -2 -1 0 1 2 3
x 10-3
-4000 -3000 -2000 -1000 0 1000 2000 3000 4000 Element-1498 Displacement [ft] S h ea r [k ]
-6 -4 -2 0 2 4 6 x 10⁻³
-1 -0.5 0 0.5 1
1.5x 10⁴ Element-1486
Displacement [ft] S he ar [k ]
-1.5 -1 -0.5 0 0.5 1 x 10⁻³
-3000 -2000 -1000 0 1000 2000 3000 Element-1476 Displacement [ft] S he ar [k ]
-4 -3 -2 -1 0 1 2 3 x 10⁻³
-3000 -2000 -1000 0 1000 2000 3000 Element-1497 Displacement [ft] S he ar [k ]
-1.5 -1 -0.5 0 0.5 1 x 10⁻³
-1500 -1000 -500 0 500 1000 Element-1502 Displacement [ft] S he ar [k ]
-2 -1.5 -1 -0.5 0 0.5 1 1.5 2 x 10⁻³
-8000 -6000 -4000 -2000 0 2000 4000 6000 Element-1484 Displacement [ft] S he ar [k ] FE Model Stick Model -6 -4 -2 0 2 4 6
x 10-3
-6000 -4000 -2000 0 2000 4000 6000 8000 Element-1498 Displacement [ft] S he a r [k ]
-6 -4 -2 0 2 4 6 x 10⁻³
-1 -0.5 0 0.5 1
1.5x 10⁴ Element-1486
Displacement [ft] S h ea r [k ]
-0.02-0.015-0.01-0.005 0 0.0050.010.0150.02 -5000 -4000 -3000 -2000 -1000 0 1000 2000 3000 4000 5000 Element-1476 Displacement [ft] S h ea r [k ]
-0.03 -0.02 -0.01 0 0.01 0.02 0.03 -2500 -2000 -1500 -1000 -500 0 500 1000 1500 2000 2500 Element-1497 Displacement [ft] S h ea r [k ]
-0.02 -0.015 -0.01 -0.0050 0.0050.010.0150.020.025 -1000 -500 0 500 1000 1500 Element-1502 Displacement [ft] S h ea r [k ]
-6 -4 -2 0 2 4 6 8 x 10⁻³
-1.5 -1 -0.5 0 0.5 1 1.5
x 104 Element-1484
Displacement [ft] S h ea r [k ] FE Model Stick Model -8 -6 -4 -2 0 2 4 6 8
x 10-4
-2500 -2000 -1500 -1000 -500 0 500 1000 1500 2000 2500 Element-1498 Displacement [ft] S h ea r [k ]
-1.5 -1 -0.5 0 0.5 1 1.5 x 10⁻³
-6000 -4000 -2000 0 2000 4000 6000 Element-1486 Displacement [ft] S he a r [k ]
-8 -6 -4 -2 0 2 4 6 8 x 10⁻⁴
-3000 -2000 -1000 0 1000 2000 3000 Element-1476 Displacement [ft] S he ar [k ]
-4 -3 -2 -1 0 1 2 3 4 x 10⁻³
-5000 -4000 -3000 -2000 -1000 0 1000 2000 3000 4000 5000 Element-1497 Displacement [ft] S he ar [k ]
-1 -0.5 0 0.5 1 x 10⁻³
-1500 -1000 -500 0 500 1000 1500 2000 Element-1502 Displacement [ft] S he ar [k ]
-2 -1.5 -1 -0.5 0 0.5 1 1.5 2 x 10⁻³
-1 -0.8 -0.6 -0.4 -0.2 0 0.2 0.4 0.6 0.8
1x 10⁴ Element-1484
Displacement [ft] S h ea r [k ] FE Model Stick Model -3 -2 -1 0 1 2 3
x 10-3
-2000 -1500 -1000 -500 0 500 1000 1500 2000 2500 3000 Element-1498 Displacement [ft] S he ar [k ]
-3 -2 -1 0 1 2 3 4 x 10⁻³
-4000 -3000 -2000 -1000 0 1000 2000 3000 4000 5000 6000 Element-1486 Displacement [ft] Sh ea r [k ]
-2 -1 0 1 2 3 x 10⁻³
-3000 -2000 -1000 0 1000 2000 3000 4000 Element-1476 Displacement [ft] S he ar [k ]
-6 -4 -2 0 2 4 6 8 x 10⁻³
-2000 -1500 -1000 -500 0 500 1000 1500 2000 Element-1497 Displacement [ft] S he ar [k ]
-3 -2 -1 0 1 2 3 4 5 6 x 10⁻³
-1000 -800 -600 -400 -200 0 200 400 600 800 1000 Element-1502 Displacement [ft] S he ar [k ]
-4 -3 -2 -1 0 1 2 3 4 5 x 10⁻³
-6000 -4000 -2000 0 2000 4000 6000 8000 Element-1484 Displacement [ft] S h ea r [k ]
Max Slip
= 1.8 in
Max Slip
= 0.2 in
Max Slip
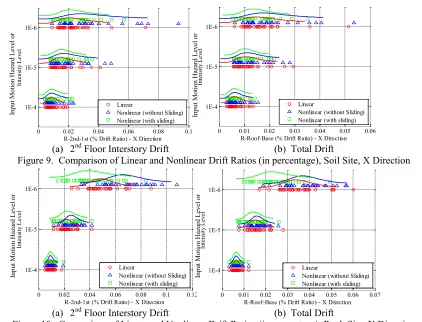
and without foundation interface modeling) at each input motion intensity level and for each LHS realization. Note that the results obtained at each hazard level are the envelope of HF and LF analysis results for that level (e.g. the 1E-4 maximum drift ratio is calculated as the envelope of the maximum drift ratio for HF4 and LH4 runs). The rigid body rocking of the foundation is subtracted from the calculated drift ratios since the rocking component of the drift ratio does not contribute to the stresses in the shear walls or ultimately their failure. These results provide the drift ratio demand distribution at different ground motion hazard levels which are used to construct the shear wall fragility functions (not presented here). The maximum absolute interstory drift ratios (between the 1st and 2nd floors in the X direction) and
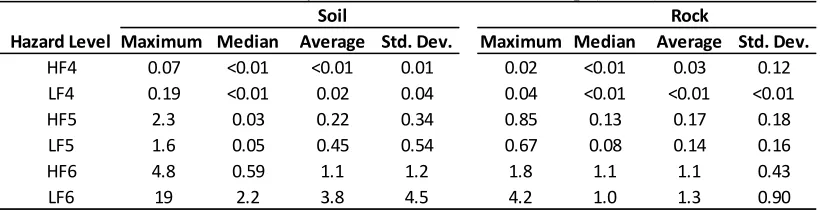
the total drift ratios (differential displacement between the roof and base mat divided by the building height) for the building are presented in Figure 9 and Figure 10 for the soil and rock subgrades, respectively. The drift ratios (in percentage) corresponding to the linear response for each LHS realization at each hazard level and their corresponding fitted log-normal probability distribution functions are shown with red circular markers and red curves, respectively. Similarly, the nonlinear responses for each LHS realization without sliding consideration and with sliding nonlinearity included are shown by triangular or square markers and their corresponding log-normal probability distribution functions are shown by the blue and green curves, respectively. The statistics of the maximum foundation slips observed are listed in Table 2. Note that the maximum slip displacement has a bi-polar distribution representing two groups of runs with and without foundation sliding initiated. Where, the runs in which the foundation sliding threshold is not exceeded have zero sliding displacements and runs in which sliding occurs, can have large foundation slip magnitudes (depending on the frequency content of the horizontal motion and amplitude of the vertical motion). This characteristic of the results causes the median and average maximum foundation displacement to potentially have very different amplitudes (e.g. soil subgrade at LF5 hazard level shown in Table 2).
Table 2. Summary of Maximum Foundation Slip (inches)
With increasing hazard levels, the magnitude and likelihood of foundation sliding increases. The additional energy dissipation at the foundation-soil interface reduces the interstory drift and seismic demands on the structural elements. In other words, the seismic displacements are concentrated below the foundation protecting the structural elements above. Thus, by accounting for foundation sliding, smaller values of nonlinear drift ratios (in the structure) are observed. Note that once the friction threshold is exceeded, the response of the structure momentarily resembles that of a base isolated structure and it is governed by low frequency content of the input motion. Thus, the maximum amplitude of foundation sliding for each hazard level is significantly larger in the case of soil subgrade compared to the rock subgrade as demonstrated by the “Maximum” columns in Table 2. The reduction in the drift ratio, however, is not related to the amplitude of slip, but to the difference between the slip threshold and the base shear which would otherwise take place in the model. The slip threshold depends on the amplitude of the vertical motion as well as the amplitude of the base shear. Thus, the reductions in the structural responses are much more prominent in the rock subgrade case due to higher vertical motion (which would reduce the slip threshold) and larger base shear (slip potential). Moreover, the dispersion in the structural response is notably less where significant sliding of the foundation is expected. This is mainly because the foundation sliding provides an upper bound on the base shear that can be transmitted across the soil-foundation interface.
Soil Rock
Hazard Level Maximum Median Average Std. Dev. Maximum Median Average Std. Dev.
HF4 0.07 <0.01 <0.01 0.01 0.02 <0.01 0.03 0.12
LF4 0.19 <0.01 0.02 0.04 0.04 <0.01 <0.01 <0.01
HF5 2.3 0.03 0.22 0.34 0.85 0.13 0.17 0.18
LF5 1.6 0.05 0.45 0.54 0.67 0.08 0.14 0.16
HF6 4.8 0.59 1.1 1.2 1.8 1.1 1.1 0.43
(a) 2nd Floor Interstory Drift (b) Total Drift
Figure 9. Comparison of Linear and Nonlinear Drift Ratios (in percentage), Soil Site, X Direction
(a) 2nd Floor Interstory Drift (b) Total Drift
Figure 10. Comparison of Linear and Nonlinear Drift Ratios (in percentage), Rock Site, X Direction
The failure of the non-structural components and safety related equipment in the structure is a function of the ISRS calculated at the location of that component. The ISRS are traditionally calculated from the linear analysis without consideration for structural or interface nonlinearity. For the subject study, the ISRS are calculated at the intersection of major structural walls on Col. Line 2 and Col. Line B at Elevations 0 ft (foundation), 33 ft (1st floor) and 144 ft (roof). The ISRS at these nodes in the model
are calculated from both linear and nonlinear analysis results. The value of the 5% damped ISRS at 8 Hz (corresponding to the natural frequency of a supposed important to safety equipment) are calculated using ISRS from linear and nonlinear analysis (with and without modeling of the foundation sliding) for each intensity level and for soil and rock cases and presented in Figure 11 and Figure 12, respectively. The ISRS calculated on the foundation are of course identical for linear analysis and nonlinear analysis without sliding consideration, however, with foundation sliding taken into account, lower values of 8 Hz ISRS response are observed. At higher elevations, the reduction of response due to sliding is combined with the reduction observed due to structural nonlinearity which is more evident at the roof level. This observation is consistent with the nonlinear response of the structure (see Figure 7 (a)) which shows significant nonlinear response above Elevation 33 ft. The reduction in the ISRS is attributed to the additional dissipated energy due to friction below the foundation as well as additional hysteresis damping and instantaneous frequency shifts due to softening of the structure. These reductions in some instances are very significant as observed in the rock case at 1E-6 hazard level and may have large impact on the succeeding fragility analyses. While a reduction in the ISRS due to both structural nonlinearity and interface nonlinearity is expected, for most practitioners the complexity of the nonlinear analysis is prohibitive and they choose to use the ISRS from the linear analysis for design purposes.
Note that the ISRS calculated from the sliding analysis are only evaluated at relatively low frequencies (less than about 15 Hz). We found that a much smaller time-step was needed to reliably obtain the response of the structure at higher frequencies. Also, our sensitivity results suggested that a
0 0.02 0.04 0.06 0.08 0.1
1E-4 1E-5 1E-6
R-2nd-1st (% Drift Ratio) - X Direction
In
te
ns
ity
L
ev
el
Linear
Nonlinear (without Sliding) Nonlinear (with sliding)
0 0.01 0.02 0.03 0.04 0.05 0.06
1E-4 1E-5 1E-6
R-Roof-Base (% Drift Ratio) - X Direction
In
te
ns
ity
L
ev
el
Linear
Nonlinear (without Sliding) Nonlinear (with sliding)
0 0.02 0.04 0.06 0.08 0.1 0.12
1E-4 1E-5 1E-6
R-2nd-1st (% Drift Ratio) - X Direction
In
te
ns
ity
L
ev
el
Case-6N-LR and Case-6N-LR-001 Results
Linear
Nonlinear (without Sliding) Nonlinear (with sliding)
0 0.01 0.02 0.03 0.04 0.05 0.06 0.07
1E-4 1E-5 1E-6
R-Roof-Base (% Drift Ratio) - X Direction
In
te
ns
ity
L
ev
el
Case-6N-LR and Case-6N-LR-001 Results
Linear
Nonlinear (without Sliding) Nonlinear (with sliding)
Inp
ut
M
otio
n
H
az
ar
d
Le
ve
l or
Inp
ut
M
otio
n
H
az
ar
d
Le
ve
l or
Inp
ut
M
otio
n
H
az
ar
d
Le
ve
l or
Inp
ut
M
otio
n
H
az
ar
d
Le
ve
non-trivial increase in the ISRS at the foundation level (and higher up) at high frequencies (generally above 20 Hz) may occur possibly due to impact motion induced by the foundation instantaneous slide-stop motion. These findings will be the subject of a different study and are not further discussed in this paper since neither the high frequency response of the structure nor the high frequency sensitive equipment are of concern.
The results presented above for both structural and nonstructural demands suggest that the foundation slip significantly reduces the response for the considered structure, especially at beyond design basis hazard levels (1E-5 and 1E-6). The beyond design basis evaluation of the nuclear safety related projects are an integral part of the Seismic Probabilistic Risk Assessment which are required for all existing (after Fukushima Dai-ichi accident) as well as new nuclear power plants. The impact of the foundation sliding on the structural and equipment fragility curves, annual failure probabilities, and SPRA are investigated and will be presented in future publications by the authors.
(a) Elevation 0 ft (Foundation) (b) Elevation 33 ft (1st Floor) (c) Elevation 144 ft (Roof)
Figure 11. Comparison of Linear and Nonlinear 5% Damped ISRS Response at 8 Hz, Soil Site, X Direction
(a) Foundation Elevation (b) Elevation 33 ft (1st Floor) (c) Elevation 144 ft (Roof)
Figure 12. Comparison of Linear and Nonlinear 5% Damped ISRS Response at 8 Hz, Rock Site, X Direction
CONCLUSIONS
Important observations are summarized below:
The probabilistic implementation of explicit interface nonlinearity in combination with the structural nonlinearity and SSI effects are demonstrated using nonlinear RHA of the structure with the foundation motions obtained from elastic SSI analyses, which are applied as input to fixed base nonlinear analyses. This approach quantifies the expected interface sliding and structural nonlinearity for the particular structural configuration and provides a robust analytical basis for the estimation of the probabilistic distribution of selected demands parameters both at the design level and beyond design level seismic input.
The additional energy dissipation at the foundation-soil interface reduces the interstory drift and seismic demands on the structural elements. In other words, the seismic displacements are concentrated below the foundation protecting the structural elements above.
The reduction in drift ratio is related to the difference between the slip threshold and the base shear which would otherwise take place in the model. The slip threshold depends on the amplitude of the
0 0.5 1 1.5 2 2.5
1E-4 1E-5 1E-6
Node426 ISRS at 8 Hz - X Direction
In
te
ns
ity
L
ev
el
ISRS Results at 8 Hz
Linear
Nonlinear (without Sliding) Nonlinear (with Sliding)
0 0.5 1 1.5 2 2.5
1E-4 1E-5 1E-6
Node785 ISRS at 8 Hz - X Direction
In
te
ns
ity
L
ev
el
ISRS Results at 8 Hz
Linear
Nonlinear (without Sliding) Nonlinear (with Sliding)
0 1 2 3 4 5 6 7
1E-4 1E-5 1E-6
Node2472 ISRS at 8 Hz - X Direction
In
te
ns
ity
L
ev
el
ISRS Results at 8 Hz
Linear
Nonlinear (without Sliding) Nonlinear (with Sliding)
0 1 2 3 4 5 6 7
1E-4 1E-5 1E-6
Node426 ISRS at 8 Hz - X Direction
In
te
ns
ity
L
ev
el
ISRS Results at 8 Hz
Linear
Nonlinear (without Sliding) Nonlinear (with Sliding)
0 1 2 3 4 5 6 7
1E-4 1E-5 1E-6
Node785 ISRS at 8 Hz - X Direction
In
te
ns
ity
L
ev
el
ISRS Results at 8 Hz
Linear
Nonlinear (without Sliding) Nonlinear (with Sliding)
0 5 10 15 20
1E-4 1E-5 1E-6
Node2472 ISRS at 8 Hz - X Direction
In
te
ns
ity
L
ev
el
ISRS Results at 8 Hz
Linear
Nonlinear (without Sliding) Nonlinear (with Sliding)
Inp
ut
M
otio
n
H
az
ar
d
Le
ve
l or
Inp
ut
M
otio
n
H
az
ar
d
Le
ve
vertical motion and that of the base shear. Thus, the reductions in the structural responses are much more prominent in the rock subgrade case due to higher vertical motion (which would reduce the slip threshold) and larger base shear (slip potential).
Once the friction threshold is exceeded, the response of the structure momentarily resembles that of a base isolated structure and it is governed by low frequency content of the input motion. Thus, the maximum amplitude of foundation sliding for each hazard level is significantly larger in the case of soil subgrade compared to the rock subgrade.
The dispersion of the foundation sliding displacements is rather large with coefficients of variations oftentimes larger than 100%. This observation suggests that the application of a large safety factor for the design of building umbilical utilities against foundation sliding displacements (typically with a factor between 2 and 3) is not overly conservative.
The probabilistic results for the 5% damping ISRS at 8Hz in three locations in the structure suggests a reduction in the ISRS which is attributed to the additional dissipated energy due to friction below the foundation as well as additional hysteresis damping and instantaneous frequency shifts do to softening of the structure. These reductions in some instances are very significant as observed in the rock case at 1E-6 hazard level and may have large impact on the succeeding fragility analysis.
For both structural seismic demand (story drift) and non-structural seismic demand (ISRS), the dispersions in the responses are notably less where significant sliding of the foundation is expected. This is mainly because the foundation sliding provides an upper bound on the base shear that can be transmitted across the soil-foundation interface.
The results of the probabilistic demand calculation suggest that allowing the foundation to slip (as a rigid body) would have a beneficial effect through the reduction in demand on the main structural and nonstructural responses investigated here. Thus, the current state of practice which enforces a strict safety factor against foundation sliding is due for reexamination; in this case, the umbilical utility lines for the building must be designed to accommodate the maximum slip amplitude.
The ongoing beyond design evaluations of nuclear power plants after Fukushima Dai-ichi accident (both in US and other countries) require consideration of extreme seismic events. The results presented in this paper suggest that in such evaluations, the interface behavior of the foundation and the supporting soil medium will play a significant and often favorable role in quantifying the risk. REFERENCES
Elkhoraibi, T.E. and Hashemi, A. (2011). “Integrated Soil-Structure Fragility Analysis Method for Nuclear
Structures,”. Fifth International Conference on Earthquake Geotechnical Engineering. Santiago, Chile, 10–13 January 2011.
Elkhoraibi TE and Hashemi, A. (2012). Design Applications for Integrated Soil-Structure Fragility Analysis. Bechtel Technical Grant Report.
Hashemi, A. and Elkhoraibi, T.E. (2009). “Integrated Soil-Structure Fragility Analysis Method,” ECCOMAS Thematic Conference on Computational Methods in Structural Dynamics and Earthquake Engineering (COMPDYN 2009), Rhodes, Greece, 22–24 June 2009.
Hashemi, A., Elkhoraibi, T.E., and Ostadan, F. (2012), “Probabilistic Nonlinear Analysis of a RC Shear Wall Structure including Soil-Structure Interaction,” 15th World Conference on Earthquake Engineering (15WCEE), Lisbon, Portugal, 24-28 September 2012.
Hashemi, A., Elkhoraibi, T.E., and Ostadan, F. (2011). Probabilistic and Deterministic Soil Structure Interaction (SSI) Analysis. Eleventh International Conference on Application of Statistics and Probability in Civil Engineering (ICASP11), ETH Zurich, Switzerland, 1–4 August 2011.
Mazzoni, S., McKenna, F., Scott, M.H., Fenves, G.L., et al. (2006). Open System for Earthquake Engineering Simulation User Command-Language Manual. Pacific Earthquake Engineering Research Center, University of California, Berkeley, OpenSees version 1.7.3.
University of California at Berkeley (2011). SASSI2010 - A System for Analysis of Soil-Structure Interaction. Bechtel Standard Computer Program (SCP), GE996 Version 1.0., November 2011.