R E S E A R C H
Open Access
Intelligent context-aware energy management
using the incremental simultaneous method in
future wireless sensor networks and computing
systems
Yunyoung Nam
1, Seungmin Rho
2and Bok-gi Lee
3*Abstract
In this article, we present an intelligent context-aware energy management for saving home energy consumption using activities of daily living. In order to extract energy-consuming patterns, we analyze daily activities, which are collected from location sensors and electronic appliances. In addition, we construct an energy management model using the incremental statistical method, which is improved by the ISM-based adaptive model using house construction and location of electronic devices. Furthermore, we provide a simulator that conducts the various functions using the energy-consuming patterns and present the simulation results for the verification and efficiency of our model.
Keywords:Energy consuming, Energy saving, Human activity pattern, Energy management
Introduction
Recently, numerous researchers and companies have much interest in the energy saving of home appliances automatically and efficiently [1-3]. The White House blog of President Obama’s major announcement [2] on buil-ding efficiency represents that the “Better Buildings” ini-tiative aims to achieve a 20% improvement in commercial energy efficiency by 2020, reduce companies’and business owners’ energy bills by about 40 billion dollars per year, and save energy by reforming outdated incentives and challenging the private sector to act.
The first cross-European survey “the Habits of a Life-time”reported how households use energy [4]. The habit of life is strongly related with the energy saving and was-ting. In the survey, forgetting to switch the lights off when leaving a room is a massive energy waster. In the UK, lighting homes costs £1.9 billion a year, so switching off lights we do not need would slash CO2 emissions. In other words, behavior habits affect energy consumption. In [5], modification program has preliminary success in
getting people to cut consumption. The website displayed real-time consumption data gives a positive effect for en-ergy saving. A smart home has capability of enen-ergy saving by using the human activity patterns learning. Using heterogeneous sensors, the energy management system collects usage information of electric appliances about the activity patterns. Using these activity patterns, the system handles the energy consumption.
Traditional context-aware systems accomplish compli-cate sensing tasks and employ some complicompli-cate context interpretation. In general, a context-aware system for pro-viding appropriate services should have four tasks involved in dealing with contexts: (1) context acquiring; (2) context interpreting; (3) disseminating context to interested par-ties; and (4) service modeling [6,7]. Furthermore, import-ance of saving the energy in a progress of the context computing system is being raised up recently.
In this article, we propose the energy management model using human activity patterns and Hierarchical Hidden Markov Model (HHMM) to minimize the wasting of energy. We describe a 3-level HHMM energy manage-ment model and adapted the incremanage-mental statistical method (ISM)-based energy management model using HHMM. In experiments, the results using ISM-based * Correspondence:[email protected]
3
Department of Computer Engineering, Gachon University, Seongnam-si, Korea
Full list of author information is available at the end of the article
energy management model are presented. The proposed automatic system based on the energy management model using human activity patterns controls consumed energy efficiently and effectively. To save electrical power, the pro-posed energy management system accomplishes potential energy management by using control of devices from human activity patterns and real-time positioning data. Moreover, it is possible to infer electric appliances that a user wishes to use.
The remainder of this article is organized as follows. Section 2 describes related work. Section 3 introduces the outline of our system and the process of analyzing the activity patterns. Section 4 presents energy manage-ment model. Section 5 describes the experimanage-mental results. Section 6 gives the results of this article. Section 7 concludes this article.
Related work
EasyLiving and Independent LifeStyle Assistant (ILSA) are automation systems, which are focused on construct-ing automatic home environments based on the Internet infrastructure [8]. Medical Automation Research Center (MARC) at the University of Virginia has developed a communication module with a web-based data manage-ment server, which analyzes the meal preparation patterns of people including physiological signs such as heartbeat and body temperature [9]. MavHome at the University of Texas in Arlington is a home health monitoring system that assists in daily basic activities, which tracks vital signs, movement patterns, medicine taking schedules, and inter-action with devices in the home [10]. The Center for Future Health at the University of Rochester provides an emergency response service [11]. Aware Home at the Georgia Institute of Technology has focused on the appli-cations for supporting people with cognitive impairment in daily activities and communications [12]. Place Lab. of MIT has developed a portable kit that tracks movements of objects in the home, such as furniture and kitchen tool [13]. Adaptive House at the University of Colorado focuses on designing a self-programming home system, based on the lifestyle, needs, and preferences of the residents [14].
According the IEO2009 report, world marketed energy consumption is projected to grow by 44% over the 2006– 2030 period, and total world energy use is projected to increase by 472 quadrillion British thermal units (Btu) in 2006 to 678 quadrillion Btu in 2030 [15]. Moreover, energy use in the residential sector accounted for about 15% of world delivered energy consumption in 2006 [15]. As energy consumption is constantly growing, energy management task of context-aware system should be taken seriously. Numerous researches have studied to save the energy using control of sensors [16-18]. However, the system is not applied with the human activity patterns. In order to control the power efficiently and effectively,
energy saving method using human activity patterns should be considered.
To extract human activity patterns, various positioning systems have been presented to provide a real-time service based on the location of people. The positioning system is classified global positioning system and Real-Time Locating Systems (RTLS) by operation range. The global positioning system such as GPS is wide range tracking system; how-ever, the system is not applied to indoor positioning sys-tem. RTLS is intended to locate people or things by small electronic devices carried on these items or persons. These systems determine the location carrying an RFID tag or Wi-Fi tag in real-time. Especially, most mobile devices used in wireless sensor network provide received signal strength indication and it can be used one of ranging sources with-out an additional hardware. The proposed system is ap-plied as a potential energy saving method using human activity pattern and real-time positioning data. Using leav-ing and arrivleav-ing activity patterns, the system manages automatically power mode and controls the heating and cooling system to save potential energy in a smart home and office.
System architecture
Background and application model
The common approach for minimizing the unnecessary energy wasting is to construct the energy management model by using the user position and devices position. In [19], an energy management model based on an HHMM was presented. The method tried to find an optimal way to handle on/off switching of device that can minimize the energy consumption while keeping the response time below the required level. The energy management model is pre-designed by using house construction and elec-tronic devices’location. The pre-designed model is simple to construct. However, the limitation of pre-designed model does not manage the temporary use of devices. In addition, people may use two different devices that are placed at the separated room at the same time. If the system controls the device only by space divided by the house construction, this simultaneous use is ignored.
and saved energy by the energy management system are recorded periodically in the energy measurement data-base. Lastly, the total consumed energy and saved energy are provided user daily, weekly, monthly, and yearly for informing data and arousing user’s attention about energy saving.
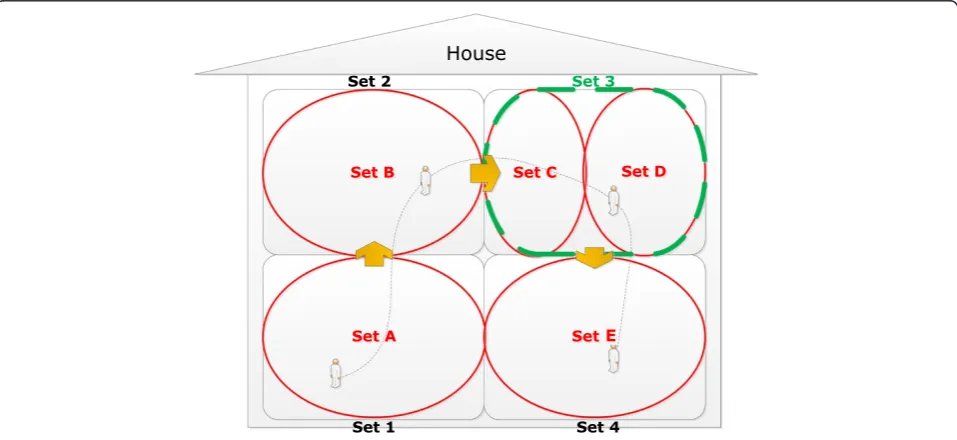
Figure 1 illustrates an application model that contains four different rooms where people generally use the devices in the same room at the same time. In the figure, Sets A, B, C, D, and E are formed in different rooms. If people use the devices that are placed Sets C and D at the same time, the system should consider Sets C and D in the same space. As a result, conceptual space should be constructed from activity patterns. In addition, people generally use the several devices simultaneously. For the group-based control of device for energy management, we divide the all appliances as several groups and construct as the set by the construction of house and human activity patterns.
Activity pattern extraction process based on incrementally simultaneous method
The aim of extracting the activity patterns is to organize the simultaneous activities in order to resolve conflicts, and to discover habits. The simultaneous activities occur at a certain place for a certain time period. First, many contexts are acquired from environmental sensors and electronic devices. Then, the activity patterns and the si-multaneous activity patterns are analyzed using ISM which organizes the activities context model. In addition, tem-poral relations between the simultaneous activity patterns are represented using Allen’s temporal relation logic after constructing the simultaneous activities as sets. Finally, an
activity context model can be constructed, which has both the probability and the temporal relations. To extract the simultaneous activity patterns, the activity context model is constructed from the sets of simultaneous activities which determine the probability relations between the ac-tivities and determine a temporal relation within the sets. The simultaneous activity set is a set of activity contexts which have occurred at the same time. People can under-take a maximum of four activities at a time, because the limit of activities in each set is four.
In order to organize the set of simultaneous activities, activities are first divided into simultaneous activities and non-simultaneous activities. A non-simultaneous activity is a representative activity that does not occur simulta-neously with other representative activities, but has sub-simultaneous activities. Whenever sub-simultaneous activities occur, the statistical value is measured and updated on the previously recorded. This value is the probability that a user does one action while doing another action simulta-neously in the same set. These probabilities are calculated incrementally by updating the previous data.
System architecture
The proposed energy management system controls the power mode of electronic devices by using the user’s absence from the space where the device is placed. When a device that is placed in a certain room is used by a user, the system recognizes a user exists in the room. Whereas, the device mode is switched to standby mode when people leave the room that the device is placed. However, the user’s convenience should not be interrupted in smart environments. To prevent inconvenience, we define tem-poral activity. In the case of temtem-poral activity, the system
conserves the power mode of existing devices even though people leave the room where the devices are placed.
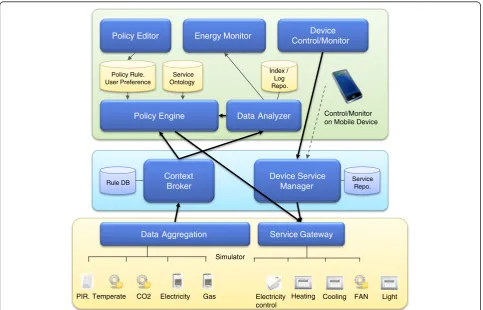
The process of potential energy management consists of three parts; data aggregator, observer, and manager includ-ing a simulator as shown in Figure 2. The data aggregator extracts relative probabilities and temporal relations which are related to the energy management from human activity patterns. The observer has two roles; real-time multi-user observation and real-time electronic devices monitor. The observer traces all users’ position at the real-time and checks the status of all devices. The manager controls the power automatically by using the temporal relation of activity patterns, real-time user position data, and devices’ status. Among working electronic devices, the manager detects a device that is out of use as power saving target. Then, the system controls the device power mode to switch to standby mode.
In addition, the amount of the calculated energy is periodically displayed with the consumed energy of the maximum consumed device. The proposed energy man-agement system provides an automatic energy managing service as well as a guide to power consumption using the display service of amount of consumed energy and an amount of saved energy. The proposed context-aware system measures distance between a user and a device as
well as users’position. When a user moves to other pos-ition, the system calculates the distance between the base position and the user’s current position. The energy man-agement system sets up the standby mode or sleep mode after checking the in short range or out of range.
Energy management model
The ISM considers the management of temporary service. In addition to the temporary service, the energy manage-ment model using ISM could manage the user-oriented service seamlessly and efficiently. Furthermore, the ISM based on the incremental probability presents optimal learning results. However, ISM permits an activity to be included in multiple sets in the process of constructing the simultaneous activity patterns set, that is, confusion of service control can occur by service activity duplication.
The ISM is an effective approach to extract the user ac-tivity patterns and predict the next acac-tivity. However, the ISM is required the additional function for development in efficiency using removal of the overlapping service for supporting the predicted service and power saving service. In the process of switching the simultaneous activity patterns set, the native ISM-based system commands all existing services to stop and then services in the next set
Device Control/Monitor Energy Monitor
Device Service Manager
Light PIR. Electricity Heating
Data Analyzer
Policy Engine Control/Monitor
on Mobile Device
Policy Rule. User Preference
Temperate
Policy Editor
Service Ontology
Context Broker
Rule DB Service
Repo.
Simulator
Electricity control Gas
CO2 Cooling FAN
Service Gateway
Index / Log Repo.
Data Aggregation
to start although some service devices should keep the previous status.
In addition, service time is delayed to keep the previous power status of electronic devices because the native ISM-based system should control device’s status after checking whether the device is the same one. The energy manage-ment model should solve the problem of the duplicated service to reduce the delay time and to prevent unnece-ssary on/off wasting. To remove duplicated service, the energy management model using ISM is applied by the HHMM. The duplication is removed by knowing house construction and location of existing electronic devices. To minimize the wasting of energy, we propose the energy management model using user activity patterns and HHMM. First, we describe a 3-level HHMM energy management model. Next, we present an adapted ISM-based energy management model using HHMM. Lastly,
the proposed simulator using ISM-based energy manage-ment model is presented.
3-Level HHMM-based energy management system The 3-level HHMM system [19] models the electronic device usage of a user as shown in Figure 3. The compo-nent of the energy management model is a device that is used by a user. The 3-level HHMM is organized based on the position of electronic devices. One node at the root level represents the state of a user when a user is at home. Two nodes at the second level represent the states that a user is in a room such as a living room, a bedroom, a kitchen, and a bathroom. Three nodes at the third level represent the states of electronic devices such as a TV, a computer, an audio, and a light of each room. The key parameter between nodes is calculated probability from accumulated incremental data.
A u d io 1 Lig h t 1 TV1 Lap t o p
TV2 Lig h t 2 A u d io 2 To ilet Lig h t 3 Co ffeep o t
Lig h t 4 U ser Po sit io n
t 0 t 1 t 2 t 3 t 4 t 5 t 6 t 7 t 8 t 10 t 11t 12 t 13
T1 T2 T3 T4
Set 1 Set 2
Set 5 Set 6 Set A
SAZ S5z SA Z SA Z SA Z SBZ
Set 3 Set 4 Set B
S6Z SBZ SBZ S5Z SBZ
D evice
Tim e
Figure 4Example of devices of simultaneous activity patterns set.
P
P E
I
P P
P E
I
P P E
I
P E
I E
R
Light Light Audio TV Light Light Audio TV
ISM-based energy management system
The adapted ISM-based energy management model is to control unnecessary electronic devices without the inter-ruption of temporary activity as well as to remove delay by the duplicated service devices. First, data aggregator acquires a lot of contexts from sensors and electronic appliances. After acquiring context, the activity patterns and simultaneous activities patterns are extracted by ana-lyzing the collected contexts. The simultaneous activity pat-terns are constructed as the simultaneous activity patpat-terns set [20]. According to the University of Oregon [21], the maximum activity number which a person can do simul-taneously is four. Therefore, the number of sub-activity is limited as four. Next, temporal relation of the simultaneous activity patterns set is determined between the sets by using the Allen’s temporal relation. In the simultaneous activity pattern set, the activity has the probability relationship with
another activity, and the simultaneous activity pattern set has the probability relationship with another set. The prob-ability is incrementally updated daily using the aggregator.
In addition, separated sets, which contain electronic devices in the same place, are merged, and then the dupli-cated service devices are removed. For example, electronic devices of the Audio1 set and electronic devices of the TV1 set are in the same space, the lights of two sets are same one. Two sets are merged and the duplicated light is removed. Finally, the energy management model using ISM is reconstructed without duplication service.
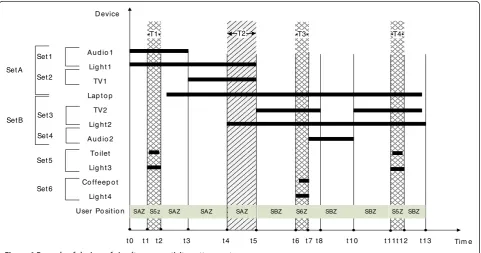
The goal of manager is to find only one activity set which should be kept on working using the power use pattern, real-time user position, and device status form data aggre-gator and to stop services in unnecessary sets. Figure 4 shows an example of devices of simultaneous activity pat-terns set. First, Sets 1 and 2 are merged to become a Set A
0 1000 2000 3000 4000 5000 6000 7000 8000
Saving power
(W
att)
Device
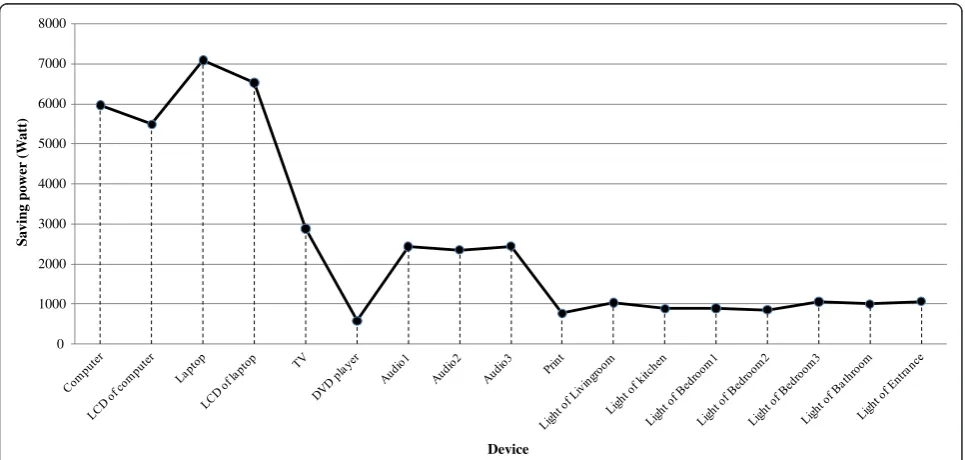
Figure 6Average of daily saving power (W). 0
2 4 6 8 10 12 14 16
9:00 9:12 9:24 9:36 9:48 10:00 10:12 10:24 10:36 10:48 11:00 11:12 11:24 11:36 11:48 12:00 12:12 12:24 12:36 12:48 13:00 13:12 13:24 13:36 13:48 14:00 14:12 14:24 14:36 14:48 15:00 15:12 15:24 15:36 15:48 16:00 16:12 16:24 16:36 16:48 17:00 17:12
Saving power (W)
Time (hour:minute)
Standby mode
Sleep mode
and duplicated services are removed to prevent unneces-sary on/off.
After merging without the duplicated service, the energy management system recognizes unnecessary services to stop at the real time. In the figure, the system finds that Sets A and B exist simultaneously in T2. Then, the system requests the observer real-time user position. In this case, the user is in Set A Zone (SAZ), that is, all service devices of Set B are stopped by the system. In addition, temporary services as the components of the simultaneous activity patterns are possible to control electronic devices effec-tively and it leads to power saving.
Unless the system distinguishes the temporary service among the set, it causes potential danger that is continu-ous service device is stopped by control based on only user’s position without user’s intention. Unless the system includes a device of temporary use, the system cannot control even the use of the device for a longer period. Therefore, temporary set should be distinguished among the sets. In Figure 4, temporary use of Set 5 has no effect on the control of existing set such as Set A in T1 and Set B in T4. The standard duration of temporary set is based on the average of duration by learning.
Heating and cooling system management
The energy management of heater/air conditioner is achieved by controlling running time using the human ac-tivity pattern. The office is warm by heat transfer or heat
conduction. Heat transfer or heat conduction is the transi-tion of thermal energy from a hotter object to a cooler object. To quantify the quantity of heat, Qis defined as thermal conductivity k, transmitted in time t through a thicknessL, in a direction normal to a surface of areaA, due to a temperature difference△T.
We assume that the heater without pre-heating and heater including pre-heating have the following condi-tions: outside temperature,to; setting temperature,ts;
con-duction coefficientk = k’,A:A’. According the formula, heat is based on transmitted time and temperature difference. Therefore, the quantity of heat between when heater uses for 1 h without pre-heating (K'x(ts−to)xA'x1) and when
heater uses for 1 h after pre-heating (=0.5xts) for 1 h is as
follows:
k0x0:5xt
sto
ð ÞxA0x1þk0x tsð 0:5xtsÞxA0x1
¼k0Ax t
sto
ð Þ:
ð1Þ
Heater wastes same energy to rise up the temperature slowly for longer time than rise up the same temperature quickly for a short time, but it is more effective for a user.
the human activity pattern. In regarding to remaining heat, the heater can be stopped before some period from the user leaves. If the heater which works for 10 h short-ens by 9 h, 10% of energy is improved.
Experiments
Simulator
Using the ISM-based energy management model, the simulator has been developed to show consumed and saving energy of all electronic devices and to encourage energy saving as detecting electronic devices that con-sumes maximum energy. The result of the consumed and saving energy is displayed as daily, weekly, monthly, and yearly.
First, the simulator is set up using the number of rooms, electronic devices, each device’s position, and people in the building. Next, the simulator calculates the consumed and saved energy of the device using ISM-based energy
management system and shows the result of calculated energy. The electronic device that has maximum con-sumed energy amount is announced periodically (weekly, monthly, and yearly).
Results
We assume that a person works from 9 a.m. to 5 p.m. The mode of appliances is automatically set up by using the distance from the user’s appliances and the duration of work. The appliance is waked up before the user comes back to the appliance for continuous work. Figure 5 shows occurrence of each mode for a period in a workday. The mode of an appliance turns to standby mode immediately when a user is in short range, and the mode turns to sleep mode when a user is out of range. The appliance con-sumed 101.58 W on idle mode, 75.35 W on standby mode, 54.22 W on sleep mode. Figure 6 shows the average of daily energy saving of each device.
Lapto
: simultaneous activity set Toilet
Figure 9Result of ISM-based energy management model.
D0
The heater without pre-heating and heater including pre-heating have the same condition: outside temperature, 0; setting temperature, 20; conduction coefficientk= 0.02,
A: 20 m2. According the formula, heat is based on trans-mitted time and temperature difference. Therefore, the quantity of heat between when heater uses for 1 h without pre-heating (0.02 ⋅ (20−0) ⋅ 20.1 = 8.28 kcal) and when heater uses for 1 h after pre-heating for 1 h (0.02⋅(10−0)⋅ 20.1 + 0.02 ⋅ (20−10) ⋅ 20.1 = 8.28 kcal) is same. Heater wastes same energy to rise up the temperature slowly for longer time than rise up the same temperature quickly for a short time, but it is more effective for a user.
We analyzed the activity patterns of a single after arriv-ing home, and before goarriv-ing to bed to corroborate effi-ciency of the ISM-based energy management model. The power modes of electronic devices are automatically set up by using the ISM-based energy management model for energy saving in a device. The mode of electronic device turns to standby mode immediately when the ISM-based
energy management system recognizes that the user is out of access range from the device. In addition, the device is waked up before the user comes back to the room where the device is placed. Figure 7 shows a test-bed composed of a living room, a bedroom, a kitchen, and a bathroom with sensors and devices.
Figure 8 shows the results of 3-level HHMM model. One node at the root level represents the state of user when a user is home; I (Indoor). Two nodes at the second level represent the states that a user is in a room such as R1 (Living room), R2 (Bathroom), R3 (Bedroom), and R4 (Kitchen). Three nodes at the third level represent the states of devices such as D1 to D7 of each room. The key parameter between nodes is calculated probability from accumulated history data. For example, the probability form R1 to R0 is 0.38.
Figure 9 shows the result of ISM-based energy manage-ment model. Four simultaneous activity pattern sets are constructed with probability relation between the sets. For
0 500 1000 1500 2000 2500
1 2 3 4 5 6
Consumed power [kW]
Day
Consumed power with the ISM Power Management System
Consumed power without the power management system
Figure 11Total consumed energy of the test-house for applying the proposed energy management. 0
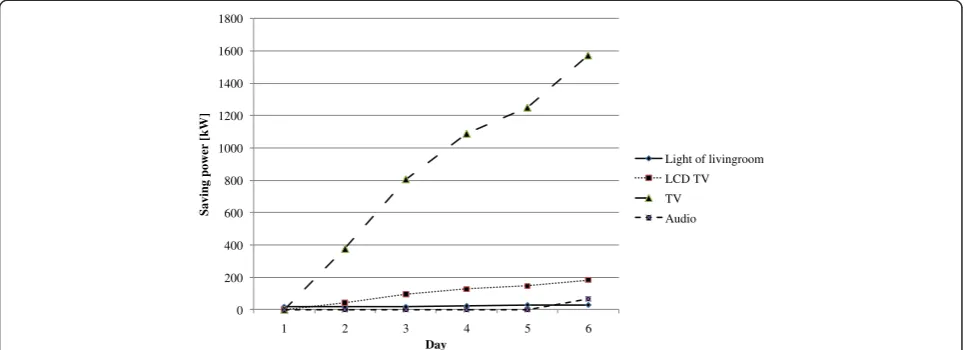
200 400 600 800 1000 1200 1400 1600 1800
1 2 3 4 5 6
Saving power [kW]
Day
Light of livingroom LCD TV TV Audio
example, one set has Audio, TV1, Laptop, and Light as simultaneous activities. The set has 100% relationship with the next set which is placed on the right side.
The simulator has significantly showed the energy effi-ciency of the ISM-based energy management system. Using the simulator for applying the ISM-based energy management system, saving rate is estimated daily, weekly, monthly, and yearly. Figure 10 shows the saving energy of each electronic device in the test-house that the ISM-based energy management system is applied. Figure 11 shows the result of wasted energy in case of ISM-based energy management system and in case of the normal sys-tem without ISM. The wasted energy without the energy management system is average 2.64 times higher than wasted energy using the ISM-based system daily. As
estimated electronic energy saving efficiency, 60.13%, monthly saving cost is 19.80 dollars and when we assume that the user maintains the same patterns.
The simulator presents the saving and consumed energy, and the overall mount of calculated energy daily, weekly, monthly, and yearly from accumulated data. To cover the overall data in the proposed energy management system, we assume an enormous amount of random activ-ities. The duration of electronic device is applied using standard Gaussian random value. The hourly saved energy pattern is shown in Figure 12. During work time, more people use device, save-efficiency increases. As the num-ber of persons is double, minimum 3% to maximum 33% is saved. Figure 13 shows the weekly consumed energy of living TV during 47 weeks. Weekly saving energy average
0 200 400 600 800 1000 1200 1400 1600
1 3 5 7 9 11 13 15 17 19 21 23 25 27 29 31 33 35 37 39 41 43 45 47
Consumed power [kW]
Week
Consumed power without the power management model(Naïve)
Consumed power using the ISM power management model
Figure 13Weekly consumed energy of living TV during 47 weeks (1 year). 0
500 1000 1500 2000 2500 3000
8 9 10 11 12 13 14 15 16 17 18 19 20 21
Saving power [W]
Time
10 rooms, 50 persons, and 50 devices
10 rooms, 100 persons, and 50 devices
10 rooms, 100 persons, and 100 devices
using the ISM-based energy management system is 327.69 kW and weekly average of saving rate is 26%.
Conclusion
We have developed the ISM-based energy management model including a 3-level HHMM model to manage the energy of electronic devices based on the analyzed activ-ity patterns and real-time observed data. The activactiv-ity contexts are collected from the environmental sensors and electronic appliances. Our proposed management system could control the unnecessary wasting energy of electronic devices by using observing position data and device status. In addition, we presented the simulation results to verify energy saving efficiency of the proposed energy management model. In the future, we will im-prove our method for multiple users and include all the current sensors into the proposed system. In addition, we plan to extend our method to three-dimensional top-ology of the building to achieve more energy saving.
Competing interests
The authors declare that they have no competing interests.
Acknowledgement
This study was supported by the Gachon University research fund of 2012.
Author details 1
Department of Electrical and Computer Engineering, Stony Brook University-SUNY, Stony Brook, NY 11794, USA.2Division of Information and
Communications, Baekseok University, Cheonan-city, Korea.3Department of Computer Engineering, Gachon University, Seongnam-si, Korea.
Received: 8 October 2012 Accepted: 5 November 2012 Published: 22 January 2013
References
1. J.D. Deboer,The Real Estate Roundtable Supports Obama Administration’s New Initiative on Energy Efficient Commercial Buildings(Real Estate Roundtable Press Release, Washington, 2011)
2. R. Redrizzi,President Obama’s Green Building Initiative Will Create Jobs(Save Energy and Save Money. U.S. Green Building Council Press, Washington, 2011) 3. R.H. Mackey Jr.,Rebuilding America Salutes President Obama’s Boost to Energy
Efficiency Programs(Energy Future Coalition Press, Washington, 2011) 4. K. Fenn,Habits of a Lifetime(Energy Saving Secrets, August, 2010) 5. Y. Chernova,Breaking bad energy habits: a behavior-modification program
has preliminary success in getting people to cut consumption(The Wall Street Journal, 2011)
6. M. Satyanarayanan, Pervasive computing vision and challenges. IEEE Personal Commun8(48), 10–17 (2001)
7. A.K. Dey, G.D. Abowd, D. Salber, A context-based infrastructure for smart environments, inProceedings of 1st International Workshop on Managing Interactions in Smart Environments(Dublin, 1999), pp. 114–128 8. K.Z. Haigh, J. Phelps, C.W. Geib, An open agent architecture for assisting
elder independence, inProceedings of the First international Joint Conference on Autonomous Agents and Multiagent Systems, Part 2(ACM Press, New York, 2002), pp. 578–586. Bologna, Italy
9. W.C. Mann, B.R. Milton, Home automation and smart homes to support independence, inSmart Technology for Aging, Disability, and Independence (Wiley, Hoboken, New Jersey, 2005), pp. 33–66
10. R. Davenport, S. Helal, W. Mann, H. Zabadani, Assistive environments for elder care-integrating smart phones with smart homes, inProceedings of the International Conference on Aging, Disability and Independence, (Washington, 2003), pp. 128–129
11. D. Cook, S. Das, K. Gopalratnam, A. Roy,Health monitoring in an agent-based smart home, in Proceedings of the International Conference on Aging, Disability and Independence, (Washington, 2003), pp. 154–155 12. A. Pentland, P. Fauchet, Personal health systems for the future, in
Proceedings of the International Conference on Aging, Disability and Independence, (Washington, 2003), pp. 176–177
13. G. Abowd, A. Bobick, I. Essa, D. Fisk, B. Mynatt, W. Rogers, Aware home for aging in place, inProceedings of the International Conference on Aging, Disability and Independence, (Washington, 2003), pp. 122–123 14. S. Intille, K. Larson, E.M. Tapia,Designing and evaluating technology for
independent aging in the home, in Proceedings of the International Conference on Aging(Disability and Independence, Washington, DC, USA, 2003) 15. Energy Information Administration, International energy outlook. (2009).
Technical Report DOE/EIA-0484, 2009, http://www.eia.doe.gov/oiaf/ieo/pdf/ 0484(2009).pdf
16. C. Tang, C. Raghavendra,Compression Techniques for Wireless Sensor Networks, Chapter 10: Wireless Sensor Networks(Kluwer Academic Publishers, Boston, 2004), pp. 207–231
17. C. Sadler, M. Martonosi, Data compression algorithms for energy-constrained devices in delay tolerant networks, inProceedings of ACM SenSys(Boulder, Colorado, USA, 2006), pp. 265–278
18. S. Madden, M. Franklin, J. Hellerstein, W. Hong, TAG: a Tiny AGgregation service for ad-hoc sensor networks, inProceedings of OSDI, Vol. 1, (Boston, 2002), pp. 1–16
19. H. Si, S. Saruwatari, M. Minami, H. Morikawa, A stochastic scheme to balance power saving and response time of electronic devices, inAdjunct Proceedings of The 7th International Conference on Pervasive Computing (Pervasive2009)(Nara, Japan, 2009)
20. E. Choi, Y. Nam, B. Kim, W. Cho, An incremental statistical method for daily activity pattern extraction and user intention inference. KSII Transactions on Internet and, Information Systems3(3), 219–234 (2009)
21. E. Vogel, E. Awh, How to exploit diversity for scientific gain: using individual differences to constrain cognitive theory. Curr. Direct. Psychol. Sci. 17(2), 171–176 (2008)
doi:10.1186/1687-1499-2013-10
Cite this article as:Namet al.:Intelligent context-aware energy management using the incremental simultaneous method in future wireless sensor networks and computing systems.EURASIP Journal on Wireless Communications and Networking20132013:10.
Submit your manuscript to a
journal and benefi t from:
7Convenient online submission
7Rigorous peer review
7Immediate publication on acceptance
7Open access: articles freely available online
7High visibility within the fi eld
7Retaining the copyright to your article