Application of the False Discovery Rate to Quantitative Trait Loci Interval
Mapping With Multiple Traits
Hakkyo Lee,* Jack C. M. Dekkers,
†,1M. Soller,
‡Massoud Malek,
†Rohan L. Fernando
†and Max F. Rothschild
†*Hankyong National University, Ansung-si, Kyonggi, 456-749, Korea,†Department of Animal Science, Iowa State University, Ames, Iowa 50011 and‡Department of Genetics, Hebrew University of Jerusalem, Jerusalem, 91904 Israel
Manuscript received February 6, 2001 Accepted for publication March 13, 2002
ABSTRACT
Controlling the false discovery rate (FDR) has been proposed as an alternative to controlling the genome-wise error rate (GWER) for detecting quantitative trait loci (QTL) in genome scans. The objective here was to implement FDR in the context of regression interval mapping for multiple traits. Data on five traits from an F2swine breed cross were used. FDR was implemented using tests at every 1 cM (FDR1) and using tests with the highest test statistic for each marker interval (FDRm). For the latter, a method was developed to predict comparison-wise error rates. At low error rates, FDR1 behaved erratically; FDRm was more stable but gave similar significance thresholds and number of QTL detected. At the same error rate, methods to control FDR gave less stringent significance thresholds and more QTL detected than methods to control GWER. Although testing across traits had limited impact on FDR, single-trait testing was recommended because there is no theoretical reason to pool tests across traits for FDR. FDR based on FDRm was recommended for QTL detection in interval mapping because it provides significance tests that are meaningful, yet not overly stringent, such that a more complete picture of QTL is revealed.
D
UE to availability of large numbers of polymorphic positives among tests that are declared significant (Wel-leret al.1998). Controlling FDR is intuitively attractive markers, it is now possible to scan a complete
because it enables a more reasoned calculation of the genome for loci affecting quantitative traits of interest,
tradeoffs involved in conducting follow-up research or so-called quantitative trait loci (QTL). Because of the
in investing selection effort in a putative QTL against large number and correlated statistical tests conducted
the possibility that the result is a false positive. and associated concerns about a flood of false-positive
Interval mapping based on least squares (Haleyand
claims for QTL if comparison-wise type I error rates
Knott 1992) or maximum likelihood (Lander and (CWER) are not properly controlled, methods to set
Botstein1989) is the common statistical method used CWER thresholds for declaring the presence of a QTL
to detect QTL. This involves conducting a statistical test have received much attention over the past decade. The
at every position for a putative QTL (typically every most common approach is to set CWER so as to control
1 cM). In their implementation of FDR,Welleret al.
the genome-wise type I error rate (GWER). To achieve
(1998) considered only tests at individual markers and
this,ChurchillandDoerge(1994) proposed an
em-not tests conducted at each possible QTL position, as in pirical permutation test method (referred to as CD)
interval mapping. Interval mapping provides additional that provides CWER thresholds controlling GWER for
power to detect QTL because markers that flank an the set of markers that is included in the experiment,
interval provide partially independent information to
while Lander and Schork (1994) and Lander and
detect QTL. Furthermore, single-marker analyses do not Kruglyak(1995) presented a method (referred to as
allow separate estimation of QTL effect and position. LK) that provides CWER thresholds that control GWER
Thus, implementation of FDR for interval mapping is as though based on a high-density marker map for the
warranted (Spelman1998).
genome under analysis.
The methods for hypothesis testing described above
More recently,Welleret al.(1998) proposed
control-have generally been applied to single traits. Yet, QTL ling the comparison-wise false discovery rate (FDR), as
mapping experiments typically involve several to many
developed byBenjaminiandHochberg(1995), as an
traits and this must be taken into account when setting alternative to controlling GWER in genome scans. The
significance thresholds. Technically, this can be readily FDR was defined as the expected proportion of false
achieved in the CD and FDR approaches by grouping tests across traits, as though they were generated by a single analysis; for the LK approach single-trait
thresh-1Corresponding author:Department of Animal Science, Iowa State
olds can be adjusted by a Bonferroni correction (Lander
University, 225C Kildee Hall, Ames, IA 50011.
E-mail: [email protected] andKruglyak1995;Spelmanet al.1996).
hypothesis that QTL are not present for any of the 1-cM tests The objective of this study was to implement the FDR
conducted in a given interval. approach for least-squares regression interval mapping
The IWER for a given marker interval was determined by
of single and multiple traits. A secondary objective was the distribution of the maximum F-statistic in that interval
to compare CWER thresholds and power for QTL de- under the null hypothesis, which can be derived by data
per-mutation. Because densities are required for low values of tection using FDR to those from the CD and LK
ap-IWER (⬍0.001), this would require a very large number of
proaches. Data from an F2cross of outbred lines in pigs
permutations to be conducted for every marker interval. To were used to address these objectives but methods and
provide an alternative requiring much less computation, a
results have a more general application. prediction equation was derived that allowed prediction of
IWER on the basis of the CWER for the observed maximum F-value in the interval and the degree of dependence of tests conducted in that interval. The dependence of tests at two MATERIALS AND METHODS
positions kand l on the chromosome can be quantified by
Data and QTL analyses:Data used were from a complete the correlations of the breed-origin coefficients at these
posi-genome scan based on 125 microsatellite markers in 525 F2 tions,i.e., the correlation ofca,kwithca,land the correlation of progeny from a cross between two breeds of swine, Berkshire cd,kwithcd,l. Correlations between breed-origin coefficients at and Yorkshire. Full details are inMaleket al.(2001a,b). Data the flanking markers were computed across the F2individuals on five meat quality traits were used: carcass weight, last rib for each interval, separately for additive and dominance coef-back fat thickness, loin eye area, and cholesterol content and ficients. The average of the two correlations was used to quan-marbling score of the loin eye. tify the dependence of tests conducted within the interval. The least-squares regression interval mapping procedure The rationale for using correlations between flanking markers and program ofHaleyet al.(1994) for a cross between out- is that all information to map a QTL in an interval is present bred lines was used for QTL analysis. A statistical model was at the markers that flank the interval (Whittakeret al.1996; fitted at each 1-cM positionkon the chromosome, to pheno- KadarmideenandDekkers1999).
typic recordsy, Data from 13 marker intervals (6 on chromosome 1 and 7
on chromosome 2) were used to derive the prediction
equa-y⫽fixed effects⫹ ba,kca,k⫹bd,kcd,k⫹ residual, tion for IWER. For each interval, the distribution of the
maxi-mum F-statistic under the null hypothesis of no QTL was whereba,kandbd,kare regression coefficients that estimate the
derived by data permutation (10,000). ThresholdF-values were additive and dominance effects for the putative QTL at
posi-obtained for a range of IWER and used to derive the relation-tionk, andca,kandcd,kare the additive and dominance
“breed-ship of IWER with CWER and the average correlation between origin” coefficients at that position. Breed-origin coefficients
breed-origin coefficients at the flanking markers. The re-were based on breed-origin probabilities for alleles at the
sulting prediction equation was used to derive IWER for all putative position. Breed-origin probabilities were derived
us-tests included in FDRm. ing all available marker data followingHaley et al.(1994).
Approaches to control GWER:The CD and LK methods
The statistic for testing the presence of a QTL at a particular
were used to derive CWER thresholds that controlled GWER position was derived as an F-statistic following Haley et al.
at 0.10, 0.05, and 0.01. The CD method was implemented as (1994). For a single test, this statistic has 2 and 517 d.f. for
inChurchillandDoerge(1994) with 10,000 permutations.
our data and model.
For multiple-trait thresholds, the maximumF-statistic for all
False discovery rate (FDR): CWER thresholds to control
tests conducted across the five traits was recorded for each FDR to a level␣F, as suggested byWelleret al.(1998), were
permuted data set. Analytical thresholds to control GWER derived by first ranking all tests on the basis of the CWER of
(LK) were derived followingLanderandSchork(1994) and theF-statistic. The FDR for the ith ranked test can then be
LanderandKruglyak(1995), usingC⫽19 chromosomes,
computed as FDRi ⫽ N ⫻ CWERi/i, where N is the total
a dependence coefficient between tests of ⫽1.5, andd⫽ number of tests and CWERiis the CWER for theith ranked
2 d.f. for each test. For controlling GWER across the five traits, test. Note that N ⫻CWERi is the expected number of tests
a Bonferroni adjustment was made, on the realistic assumption declared significant if no QTL were present and the CWER
that the traits are independent (Table 1). The single-trait threshold was set at␣C⫽CWERi, whileiis the number of tests
GWER (GWERST) required to control the multiple trait GWER that are actually declared significant at that level in the current
at GWERMT was then derived from GWERMT ⫽ 1 ⫺ (1 ⫺ experiment. Significance thresholds to control FDR at a level
GWERST)5.
␣Fwere then determined as the CWER corresponding to the largest ifor which FDRiwas below the desired level␣F. For multiple-trait thresholds, tests were ranked across traits.
Initially, FDR were derived on the basis of all tests con- RESULTS ducted,i.e., at every 1-cM position, referred to as FDR1. The
Population parameters for the five traits that were CWER for individual tests were obtained from the standard
F-distribution. FDR1 included 2050 tests per trait and 10,250 included in the analyses are in Table 1. Traits were tests across the five traits. In a second approach, referred to chosen because of their independence and range of as FDRm, only the highestF-statistic within each marker
inter-heritabilities. Traits were approximately independent, val was included, as suggested in Spelman (1998). FDRm
as indicated by close to zero phenotypic correlations. included 106 tests per trait and 530 tests across the five traits.
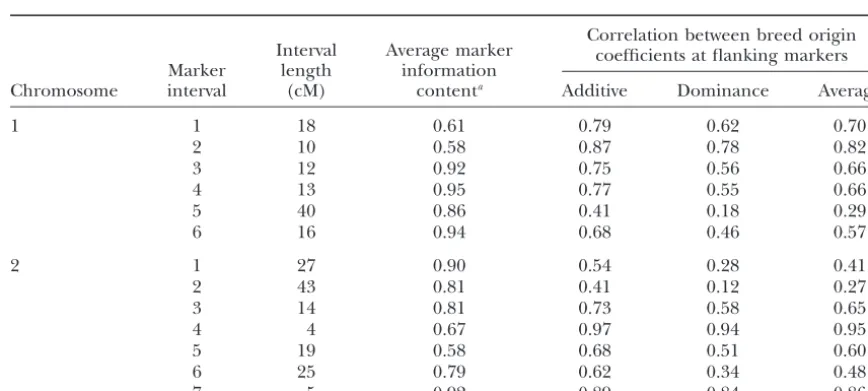
Prediction of IWER:Table 2 shows characteristics of For FDRm, a standardFdistribution cannot be used to
deter-mine the type I error rate for a given test because each test the 13 marker intervals that were used to develop the represents the largest test within a marker interval and is prediction equation for IWER. They represented a already the result of multiple testing. To account for this,
range of marker distances and information contents. instead of the CWER, the interval-wise error rate (IWER) was
Correlations between breed-origin coefficients were used to compute the expected number of false positives for
TABLE 1
Means, standard deviations, heritabilities, and phenotypic correlations of the five traits analyzed
in the F2population
Phenotypic correlation
Standard Last Loin
Trait Mean deviation Heritability rib eye Marbling Cholesterol
Carcass weight (kg) 87.1 5.7 0.18a 0.26 0.17 0.09 0.06
Last rib back fat (cm) 3.16 0.61 0.36 ⫺0.25 0.14 0.12
Loin eye area (cm2) 35.6 5.7 0.48 ⫺0.25 ⫺0.07
Marbling score (1–5) 3.8 0.73 0.13 0.09
Cholesterol (mg/100 g) 57.7 8.3 0.31
Heritability estimates are fromGoodwinandBurroughs(1995). aHeritability of dressing percentage.
information content. Correlations between dominance CWER was close to equality (IWER⫽CWER), which is
coefficients were consistently lower than correlations equivalent to conducting a single test across the interval.
between additive coefficients. Data on all of the 106 For the interval with the low correlation, IWER was
marker intervals showed a high correlation (0.97) be- substantially greater than CWER, except for CWER close
tween the two correlation coefficients. to 1. Thus, the CWER required for a given IWER
de-Thresholds of theF-statistic for IWER were obtained creased with magnitude of the correlation.
by data permutation for each of the 13 intervals of Table The following prediction equation was derived on the
2 and plotted against their corresponding CWER. Figure basis of CWER data points corresponding to IWER equal
1 illustrates the relationship between IWER and CWER to 0.01, 0.05, 0.1, 0.2, 0.3, and 0.4 for the 13 intervals,
for intervals with a low and a high correlation between
log[IWERj]⫽0.313⫹0.855 log(CWERj)⫺0.256Corrj
QTL coefficients (intervals 2 and 4 on chromosome 2).
For these intervals, 50,000 permutations were run, such ⫹0.100[log(CWER
j)⫻Corrj], that thresholds for IWER as low as 0.0005 could be
where IWERjand CWERjare the IWER and
correspond-derived.
ing CWER for intervalj, and Corrjis the average of the
The IWER and CWER were linearly related on the
correlations for the additive and dominance
breed-ori-logarithmic scale for IWER⬍ 0.4 (Figure 1), which is
gin coefficients at the flanking markers (Table 2). The the IWER region of interest. For the interval with the
high correlation, the relationship between IWER and modelRsquare was 0.998, which indicates a very good
TABLE 2
Characteristics of the 13 marker intervals on chromosomes 1 and 2
Correlation between breed origin Interval Average marker coefficients at flanking markers
Marker length information
Chromosome interval (cM) contenta Additive Dominance Average
1 1 18 0.61 0.79 0.62 0.70
2 10 0.58 0.87 0.78 0.82
3 12 0.92 0.75 0.56 0.66
4 13 0.95 0.77 0.55 0.66
5 40 0.86 0.41 0.18 0.29
6 16 0.94 0.68 0.46 0.57
2 1 27 0.90 0.54 0.28 0.41
2 43 0.81 0.41 0.12 0.27
3 14 0.81 0.73 0.58 0.65
4 4 0.67 0.97 0.94 0.95
5 19 0.58 0.68 0.51 0.60
6 25 0.79 0.62 0.34 0.48
7 5 0.92 0.89 0.84 0.86
alone (Figures 2 and 3). Single-trait results for marbling, loin eye area, and carcass weight (data not shown) were similar to those for back fat. For cholesterol content, both FDR1 and FDRm behaved erratically and never
reached FDR levels⬍0.8.
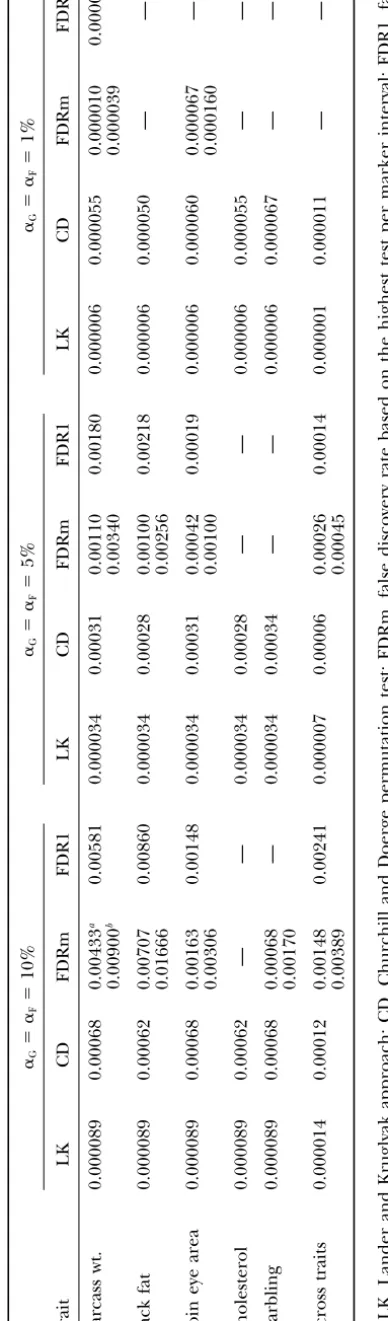
Comparison of significance testing methods: Single-trait analyses:The CWER thresholds required to control GWER or FDR at the 0.10, 0.05, and 0.01 levels for different approaches are in Table 4. For FDRm, both IWER thresholds and the CWER for the associated tests are shown for completeness.
By definition, LK thresholds were the same for all traits (Table 4). Thresholds based on CD differed
Figure1.—Relationship of interval-wise error rate (IWER)
slightly by trait due to differences in phenotypic distribu-with comparison-wise error rate (CWER) for intervals distribu-with low
tions and sampling, the latter in particular for the 0.01 (solid symbols; interval 2 on chromosome 2) and high (open
GWER level. Thresholds for FDR varied considerably symbols; interval 4 on chromosome 2) correlations between
QTL coefficients at flanking markers. The dashed line corre- by trait and could not be found for all significance levels sponds to IWER⫽CWER. for some traits. This variability is caused by the specific CWER values obtained for the set of tests included in the analysis. Part of this variability may be due to the
fit. For IWER ⫽ 0.01, the average absolute error was number of segregating QTL. Inability to obtain the
tar-0.0007 or 7% and the maximum absolute error was get FDR level for a particular trait indicates that none
25%. Data for IWER ⬍ 0.01 were not used to develop of the tests were significant at that level.
the prediction equation because the number of permu- The LK approach required the most stringent CWER
tations was limited to 10,000. Results displayed in Figure thresholds, followed by CD and FDR (Table 4). The
1, which are based on 50,000 replicates, however, show CWER thresholds for FDR1 and FDRm were generally
that the linear prediction can readily be extended to similar but varied relative to each other. This variability
IWER⬍0.01. is caused by the specific tests included in the analyses
False discovery rate (FDR):An example of the calcula- and by the dependence of CWER thresholds for FDRm
tion of FDRm is in Table 3. For each interval, the IWER on interval characteristics.
corresponding to the maximumFvalue was derived on The CWER thresholds decreased with decreasing
the basis of the prediction equation. Tests were ranked GWER or FDR levels for all methods (Table 4).
De-by IWER and the 20 lowest tests are shown in Table 3. creases in thresholds were relatively small in going from
Although FDR generally increased with IWER, a step- GWER⫽ 0.10 to GWER⫽ 0.05 and greater in going
like pattern was occasionally seen, where FDR decreased from GWER ⫽ 0.05 to GWER ⫽ 0.01. Thresholds for
with error rate. This behavior is caused by disproportion- FDR decreased markedly in going from FDR⫽0.05 to
ate changes in the numerator and denominator of FDR FDR ⫽ 0.01, coming close to those for CD. However,
when ranked tests differ little in IWER. When this oc- at this level of FDR, only two traits had tests that met
curs, the numerator of the expression for FDR, N ⫻ the target FDR level.
IWERi, remains the same, while the denominator, i, Multiple-trait analyses: Testing for multiple traits
de-increases, leading to a reduction in FDR. For example, creased CWER thresholds five- to sixfold for both LK
in going from rank 4 to 5 (Table 3), IWER increased and CD (Table 4). Multiple-trait thresholds were also
from 0.00143 to 0.00150, while FDR decreased from reduced for FDR1 and FDRm, when compared to the
0.038 to 0.032. average CWER or IWER of single-trait thresholds, but
The stepwise behavior of FDR is very apparent in less than for LK or CD. At the 0.10 level, multiple-trait
Figures 2 and 3, which show FDR1 and FDRm, respec- thresholds were reduced only by a factor of 2.3 for
tively, for last rib back fat and across the five traits. Steps FDRm and FDR1, compared to the fivefold reductions
were more pronounced for FDR1. For low CWER values, observed for LK and CD. At the 0.05 level,
multiple-FDR1 increased dramatically with decreasing CWER. trait thresholds were reduced by a factor of 4 for FDRm
For example, FDR1 was 0.05 for CWER⫽0.00012 and and 10 for FDR1. The 0.01 level was not reached for
0.19 for CWER⫽0.00009 (Figure 2). This behavior is the FDR approaches.
caused by the large number of tests included, combined Number of QTL detected:The number of QTL declared
with the small differences in CWER among the top rank- significant on the basis of the various thresholds
re-ing tests, which tend to originate from the same marker ported in Table 4 are listed in Table 5. Graphs of the
interval. test statistic are shown inMaleket al.(2001a,b). In most
For a given CWER or IWER, FDR tended to be higher cases peaks of the test statistic that exceeded significance
TABLE 3
Example computation of false discovery rate (FDRm) for determining significance thresholds for carcass weight on the basis of
tests with the maximumF-statistic within each marker interval
Average
Marker correlation between Comparison-wise Interval-wise False discovery Chromosome interval breed origin F-statistic error rate error rate rate FDRmi
Rank no. no. coefficients (Fi) (CWERi) (IWERi) (N⫻IWERi/i)
1 4 7 0.58 11.8 0.00001a 0.00004 0.004
2 4 6 0.83 8.6 0.00021 0.00045 0.024
3 7 5 0.80 7.7 0.00051 0.00107 0.038
4 4 5 0.72 7.5 0.00062 0.00143 0.038
5 7 6 0.62 7.6 0.00056 0.00150 0.032
6 8 2 0.55 7.3 0.00075 0.00212 0.038
7 8 3 0.72 6.9 0.00110 0.00244 0.037
8 4 4 0.68 6.7 0.00134 0.00310 0.041
9 7 1 0.46 6.9 0.00110b 0.00340 0.040
10 13 5 0.74 5.5 0.00433 0.00846 0.090
11 14 4 0.73 5.5 0.00433 0.00862 0.083
12 14 5 0.70 5.5 0.00433 0.00891 0.079
13 13 4 0.69 5.5 0.00433c 0.00900 0.073
14 3 3 0.51 4.9 0.00780 0.01887 0.143
15 3 5 0.65 4.7 0.00949 0.01937 0.137
16 7 4 0.60 4.6 0.01047 0.02238 0.148
17 3 4 0.96 4.1 0.01712 0.02437 0.152
18 13 6 0.60 4.5 0.01155 0.02452 0.144
19 3 6 0.37 4.5 0.01155 0.03092 0.172
20 12 1 0.32 4.5 0.01155 0.03263 0.173
aCWER threshold for FDR⬍0.01. bCWER threshold for FDR⬍0.05. cCWER threshold for FDR⬍0.1.
interval on a chromosome. These cases were, however, conducted at each 1-cM position on the genome. This
recorded as evidence for a single QTL. results in a large number of tests with very high
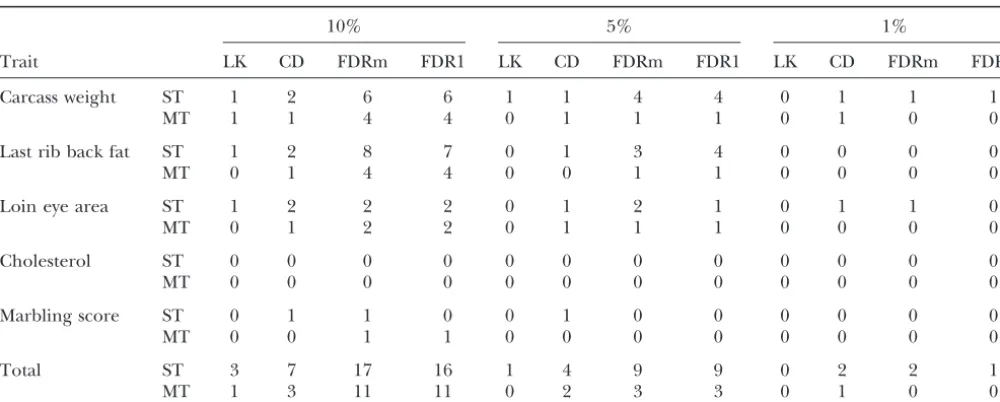
correla-As anticipated, the number of detected QTL tended tions among tests at adjacent positions. Although FDR
to be in proportion to the required CWER threshold. does not require independence of tests (Benjaminiand
At the very stringent thresholds required by LK, only 3 Hochberg1995), Figure 2 illustrates that including a
QTL were uncovered with the single-trait analyses at the large number of highly correlated tests in the analysis
0.10 GWER level, and 1 and 0 at the 0.05 and 0.01 levels, results in erratic and stepwise behavior of FDR, in
partic-respectively. The CD approach allowed more QTL to be ular for tests with the lowest CWER values. As suggested
detected than did LK. Both FDRm and FDR1 performed bySpelman (1998) this problem can be overcome in
distinctly better than either LK or CD. The FDRm uncov- part by including only the highest test per marker
inter-ered a total of 17, 9, and 2 QTL at the 0.10, 0.05, and val (FDRm), as illustrated in Figure 3. Indeed, although
0.01 FDR levels, respectively, for the single-trait analyses. FDRm still exhibited a noticeable stepwise pattern, the
FDR1 resulted in very similar numbers of QTL detected specific erratic behavior found for low CWER values
as FDRm. with FDR1 was not present.
When computed across traits, both LK and CD lost Despite their somewhat different behaviors, FDRm
much of their power to detect QTL (Table 5). The FDR and FDR1 resulted in very similar CWER thresholds and
method maintained relatively high power at an FDR of numbers of QTL detected. This similarity is consistent
0.10 but not at the 0.05 and 0.01 levels. For FDR1 for with the theoretical argument that the proportion of
marbling at the 0.10 level, more QTL were detected by false positives is independent of the number of tests
the multiple-trait test (1) than on the basis of the single- included, provided prior probabilities of a true test and
trait test (0). statistical power are unaffected (Southey and
Fer-nando 1998). The small discrepancies that were ob-served between FDR1 and FDRm are caused by the DISCUSSION
dependence of FDR on the actual tests included, which are subject to some random noise. Thus, either FDR1 Implementation of FDR for interval mapping: With
Figure2.—False discovery rate based on a test for every 1-cM position (FDR1) plotted against the comparison-wise er-ror rate (CWER) for last rib back fat (open symbols) and across five traits (solid symbols). Horizontal lines repre-sent significance thresholds at the 5 and 10% levels.
FDRm is marginally preferred because of the observed included in genome scans increases and marker
inter-vals become smaller. However, in efficiently designed erratic behavior of FDR1.
Spelman(1998) argued that FDRm would return to experiments, large numbers of closely spaced markers would be used only if the number of meioses included the same behavior as FDR1 as the number of markers
Figure3.—False discovery rate based on a
TABLE 5
Number of QTL detected on the basis of significance thresholds at the genome-wise level based on different approaches using single- (ST) and multiple-trait (MT) testing procedures
10% 5% 1%
Trait LK CD FDRm FDR1 LK CD FDRm FDR1 LK CD FDRm FDR1
Carcass weight ST 1 2 6 6 1 1 4 4 0 1 1 1
MT 1 1 4 4 0 1 1 1 0 1 0 0
Last rib back fat ST 1 2 8 7 0 1 3 4 0 0 0 0
MT 0 1 4 4 0 0 1 1 0 0 0 0
Loin eye area ST 1 2 2 2 0 1 2 1 0 1 1 0
MT 0 1 2 2 0 1 1 1 0 0 0 0
Cholesterol ST 0 0 0 0 0 0 0 0 0 0 0 0
MT 0 0 0 0 0 0 0 0 0 0 0 0
Marbling score ST 0 1 1 0 0 1 0 0 0 0 0 0
MT 0 0 1 1 0 0 0 0 0 0 0 0
Total ST 3 7 17 16 1 4 9 9 0 2 2 1
MT 1 3 11 11 0 2 3 3 0 1 0 0
LK, Lander and Kruglyak approach; CD, Churchill and Doerge permutation test; FDRm, false discovery rate based the highest test per marker interval; FDR1, false discovery rate based on tests at every 1-cM position.
in the design is sufficient to allow high mapping resolu- Because FDR has not yet been used widely for
hypoth-eses testing, there is no consensus as to the appropriate tion. In such experiments, correlations between tests in
adjacent intervals would not be excessively high, even if levels of declaring significance of QTL. A limited
num-ber of studies have examined the impact of type I and the intervals are small, because sufficient recombinants
would be present, and FDRm would behave as presented type II errors on the efficiency of marker-assisted
selec-tion (Kashiet al.1990;Moreauet al.1997). The general
here. For experiments for which marker density is high
relative to mapping resolution, maximum tests com- conclusion from these studies is that in some
circum-stances increasing power to detect QTL is more impor-puted across several adjacent intervals could be
in-cluded in FDRm to avoid excessive correlations. tant than reducing type I errors for maximizing
re-sponse to marker-assisted selection. At present an FDR Implementation of FDRm requires adjustment of the
CWER for the multiple tests that are conducted within of 0.1 would appear conservative for marker-assisted
selection. A more stringent FDR will be appropriate that interval. The IWER was introduced for these
pur-poses. As demonstrated here, IWER can be derived with when QTL mapping is aimed at providing a platform for
gene identification and positional cloning. In contrast, high accuracy from (i) a linear relationship between
the logarithms of CWER and IWER for IWER⬍0.4 and controlling GWER at levels of 0.05 to 0.01 always
re-quires a very low CWER, irrespective of circumstances. (ii) the dependence of the parameters of this linear
relationship on the correlation between breed-origin This reduces the statistical power of the experiment and
the potential response from marker-assisted selection. coefficients at the flanking markers. Further work is
needed to confirm these relationships for other designs. Comparison of significance testing approaches:The
main conclusion to be drawn from the results presented Further development of FDR also requires
accommo-dating the concerns of Zaykin et al. (2000) that the with regard to comparison of significance testing
meth-ods is that CWER significance thresholds at the same FDR is defined in an unconditional manner and cannot
be used to control FDR conditional upon having de- GWER or FDR levels differ substantially between
meth-ods (Table 4), leading to different numbers of QTL
clared one or more tests significant. Weller (2000)
argued that the difference between the conditional and detected (Table 5). Specifically, FDR resulted in less
stringent significance thresholds (Table 4) and in more unconditional proportion of false positives will be minor
if the probability of at least one significant test is high. QTL detected (Table 5), as compared to the GWER
controlling methods. Compared to LK, the CD method In the present study, however, QTL were not detected
for two of the five traits analyzed at FDRⱕ0.1 (Table 5). resulted in less stringent thresholds (Table 4) and in
more QTL detected (Table 5). Although these results Mosiget al.(2001) recently showed that the information
required to control the conditional proportion of false may depend on the specific data set used, they illustrate
several conceptual differences between approaches, as positives can be obtained from the tests that are
Conceptual differences:Controlling type I error rate on pared to single-trait thresholds, consideration of multi-ple traits will result in more stringent thresholds and the basis of a null hypothesis of zero effect is a
well-accepted principle in statistical testing of scientific fewer QTL detected for traits with many detectable
QTL. This is clearly shown in Table 4, where the nonsig-hypotheses. The GWER controlling methods of CD and
LK attempt to extend this principle to multiple testing nificant tests for cholesterol and marbling increased the
in a QTL scan by taking the null hypothesis of no QTL stringency of thresholds for the other three traits when
as valid for all tests conducted across the genome. This considered in a multiple-trait scenario. As a result, in
null hypothesis is, however, by definition false for traits the multiple-trait test, the number of QTL detected for
that have been shown by prior biometrical analyses to carcass weight and last rib back fat at the 10% level
have nonzero heritabilities. Instead, the statistical prob- was reduced from 14 to 8 (Table 5). Paradoxically, as
lem is to identify regions that harbor QTLvs.those that pointed out by Spelman (1998), when grouped with
do not. The FDR approach deals directly and quantita- traits having many detectable QTL, tests for the traits
tively with this challenge by controlling the proportion having few or no QTL will be pushed down to a high
of false positives among all significant results. The rank number. This will tend to produce less stringent
GWER approaches deal with this only qualitatively, by CWER thresholds for given FDR level and hence more
controlling the probability that significant results in- QTL detected for these traits than when analyzed alone.
clude no more than one false positive. This is seen in Table 5 for marbling at the FDR 0.10
The CD and LK approaches differ conceptually in level.
the use of only tests based on the set of markers being In principle, GWER controlling methods require
analyzed in the given experiment for CD and consider- pooling of traits in a single analysis, since they all share
ation of all tests that would be conducted in a high- the same null hypothesis of zero QTL. This is not the
density marker map in the LK approach. This results case for FDR, since there is no prior assumption that
in more stringent thresholds and fewer QTL detected traits have the same number of QTL. Furthermore,
for LK, as illustrated in Tables 4 and 5. The implications there is no advantage to losing power for a trait with
of this conceptual difference have been discussed pre- many QTL from including tests for a trait with few QTL.
viously (Lander and Kruglyak1995, 1996; Witte et Thus, for maximum power, FDR should be
imple-al.1996). Thresholds for the FDR approach are in prin- mented for each trait separately.
ciple not affected by the number of markers included Spelman(1998) extended this argument, proposing
in the analysis. Thus, FDR thresholds derived for the that chromosomes also should be analyzed separately,
current set of markers control the false discovery rate so that tests for chromosomes with few QTL do not
regardless of whether additional tests are conducted in dilute the power for tests on chromosomes with many
the future. detectable QTL. The situation for chromosomes,
how-Multiple-trait testing: Consideration of multiple traits ever, differs from that for traits because there is noa
leads to even more stringent significance thresholds priorireason for the number of detectable QTL per map
based on GWER and further reduces the power to detect distance to differ by chromosome, whereas there area
QTL, as demonstrated in Tables 4 and 5 for CD and LK. prioridifferences between traits in terms of heritability.
This is not necessarily the case for the FDR approach, Thus, unless previous results indicate a preponderance
provided the proportion of false positives among sig- of QTL on specific chromosomes, chromosomes should
nificant results is not affected by the number of tests. be analyzed jointly.
This relies on the condition that adding tests does not affect the prior probability of a true test or the average
statistical power across tests (Southey andFernando CONCLUSIONS
1998). In this regard there is an important difference
Our general conclusion is that FDR allows detection under FDR (but not under GWER) between adding
of more QTL and provides a more appropriate strategy
markers or tests for a single traitvs.adding tests on other
for setting significance thresholds for QTL mapping traits. Added tests for the same trait can be considered to
than controlling GWER because it allows a means for represent a random sample from the same infinite pool
controlling the proportion of true results among all and do not change the basic probabilities of a false
those declared significant. From a conceptual point of discovery. In contrast, added traits can have very
differ-view, this appears to be the most crucial error rate for ent QTL structures and heritabilities, ranging from
follow-up studies or application, although further work traits with many detectable QTL to traits without
detect-is needed to clarify the impact of different types of errors able QTL. The potential impact of adding tests from
and to address the concerns of Zaykin et al. (2000).
other traits can be illustrated by considering the FDR
Furthermore, although testing across traits is expected column in Table 3. Increasing the number of traits will
to have less impact on stringency of tests based on FDR,
increase N in proportion, but if the added traits do
as compared to tests based on GWER, there is no
theo-not bring with them additional high F-values, CWER
Thus, with FDR traits can be analyzed separately, which
traits—correspondence. Nat. Genet.11:241–247.
will maximize power. Lander, E. S.,andN. S. Schork,1994 Genetic dissection of complex
traits. Science265:2037–2048. The authors are grateful to Daniel Nettleton, Dirk-Jan De Koning,
Malek, M., J. C. M. Dekkers, H. K. Lee, T. J. BaasandM. F.
Roths-and an anonymous reviewer for their input Roths-and critical review. This
child,2001a A molecular genome scan analysis to identify
chro-work was supported in part by a consortium of the National Pork mosomal regions influencing economic traits in the pig. I. Growth Producers Council, Iowa Pork Producers Association, Iowa Purebred and body composition. Mamm. Genome12:630–636. Swine Council, Babcock Swine, Danbred USA, DEKALB, PIC, Seghers- Malek, M., J. C. M. Dekkers, H. K. Lee, T. J. BaasandM. F. Roths-genetics USA, and Shamrock Swine Breeders. Additional support was child, 2001b A molecular genome scan analysis to identify chromosomal regions influencing economic traits in the pig. II. from the Cooperative State Research, Education, and Extension
Ser-Meat and muscle composition. Mamm. Genome12:637–645. vice, U.S. Department of Agriculture, under Agreement no.
00-52100-Moreau, L., A. Charcosset, F. Hospital and A. Gallais,
9610; the Iowa Agriculture and Home Economics Experimental
Sta-1997 Marker-assisted selection efficiency in populations of finite tion, Ames, paper no. J-19082, project no. 3600; as well as Hatch and
size. Genetics148:1353–1365. State of Iowa funds. Part of this work was completed while Dr. Soller
Mosig, M. O., E. Lipkin, G. Khutoreskaya, E. Tchouryzna, E.
was on leave at Iowa State University, supported by a visiting scientist Ezraet al., 2001 A whole genome scan for quantitative trait fellowship provided by Cotswold Inc. loci affecting milk protein percentage in Israeli-Holstein cattle, by means of selective milk DNA pooling in a daughter design, using an adjusted false discovery rate criterion. Genetics157:
1683–1698.
LITERATURE CITED Southey, B.,andR. L. Fernando,1998 Controlling the proportion of false positives among significant results in QTL detection.
Benjamini, Y.,andY. Hochberg,1995 Controlling the false discov- Proceedings of the 6th World Congress on Genetics Applied to
ery rate: a practical and powerful approach to multiple testing.
Livestock Production, Armidale, Australia, Vol. 26, pp. 221–224.
J. R. Stat. B57:289–300. Spelman, R. J.,1998 Detection and utilisation of quantitative trait
Churchill, G. A.,andR. W. Doerge,1994 Empirical threshold loci in dairy cattle. Ph.D. Thesis, Wageningen Agricultural
Univer-values for quantitative trait mapping. Genetics138:963–971. sity, Wageningen, The Netherlands.
Goodwin, R.,andS. Burroughs,1995 Genetic evaluation terminal Spelman, R. J., W. Coppieters, L. Karim, J. A. M. van Arendonk
line program results. National Pork Producers Council, Des andH. Bovenhuis,1996 Quantitative trait loci analysis for five
Moines, IA. milk production traits on chromosome six in the
Holstein-Haley, C. S.,andS. A. Knott,1992 A simple regression method Friesian population. Genetics144:1799–1808.
for mapping quantitative trait loci in line crosses using flanking Weller, J. I.,2000 Using the false discovery rate approach in the
markers. Heredity69:315–324. genetic dissection of complex traits: a response to Zaykinet al.
Haley, C. S., S. A. KnottandJ. M. Elsen,1994 Mapping quantita- Genetics154:1919.
tive trait loci in crosses between outbred lines using least squares. Weller, J. I., J. Z. Song, D. W. Heyen, H. A. LewinandM. Ron,
Genetics136:1195–1207. 1998 A new approach to the problem of multiple comparisons
Kadarmideen, H. N.,andJ. C. M. Dekkers,1999 Regression on in the genetic dissection of complex traits. Genetics150:1699–
markers with uncertain allele transmission for QTL mapping in 1706.
half-sib designs. Genet. Sel. Evol.31:437–455. Whittaker, J. R., R. ThompsonandP. M. Visscher,1996 On the
Kashi, Y., E. HallermanandM. Soller,1990 Marker-assisted selec- mapping of QTL by regression of phenotype on marker-type.
tion of candidate bulls for progeny testing programmes. Anim. Heredity77:23–32.
Prod.51:63–74. Witte, J. S., R. C. ElstonandN. J. Schork,1996 Genetic dissection
Lander, E. S.,andD. Botstein,1989 Mapping Mendelian factors of complex traits—correspondence. Nat. Genet.12:365–366.
underlying quantitative traits using RFLP linkage maps. Genetics Zaykin, D. V., S. S. YoungandP. H. Westfall,2000 Using the
121:185–190. false discovery rate approach in the genetic dissection of complex
Lander, E. S.,andL. Kruglyak,1995 Genetic dissection of complex traits: a response to Welleret al.Genetics154:1917–1918.
traits: guidelines for interpreting and reporting linkage result.