Abstract—Large number of high rise buildings are coming up recently in all the places. As the height of the building increases, it becomes vulnerable to seismic loads since it is unpredictable and dynamic in nature. The structural safety is the most important factor that the structural engineer must keep in mind along with building serviceability.Therefore, the designers are in a necessity to provide adequate lateral strength and stability to the structure against seismic loads. Hence to satisfy the strength and stability aspect of the structure, shear walls are introduced into the high-rise RC frame buildings,since it is one of the easy and efficient way to resist the lateral loads. In this paper, pushover analysis is carried out on RC frame model with and without shear walls. The behaviour of the structure is observed and the performance point for different models with shear wall and without shear wall are determined and compared. The pushover analysis is done by using the software package ETABS 2016.
Keywords:Pushover Analysis, Performance Point, Seismic behaviour, Shear wall.
I. INTRODUCTION:
Seismic loading on any structure needs detailed information of structural behaviour under large inelastic deformations. The behaviour of seismic loads are different from wind loads or gravity loads. Structural behaviour under seismic loading requires an understanding of inelastic deformation behaviour. Pushover Analysis (Non-linear Static Analysis) is a procedure that is used to evaluate the building loaded beyond elastic range.
The recent advent of performance based design has brought the non-linear static push over analysis procedure to the forefront. Pushover analysis is a static non-linear procedure in which the magnitude of the structural loading is incrementally increased along the lateral direction in pre-defined pattern. It is assumed that the behaviour of the structure is controlled by fundamental mode and the predefined pattern is expressed in terms of story shear or in terms of fundamental mode shape. With the increase in of lateral load, the non-linear behaviour of different structural elements arecaptured, and their weak links and failure modes of the structure are determined. In addition, pushover analysis is also used to ascertain the efficiency of a structure to withstand certain level of input motion in terms of a response
spectrum. Recently, modifications to push over procedures have been proposed to capture contribution of higher modes of vibration. Push over procedure is being popular now due to the availability of the analytical tools such as SAP-2000, ETABS, MIDAS, etc.
PUSHOVER ANALYSIS DESCRIPTION:
Federal Emergency Management Agency (FEMA) and Applied Technical Council (ATC) are the two agencies which formulated and suggested the Non-linear Static Analysis or Pushover Analysis under seismic rehabilitation programs and guidelines. This included documents FEMA-356, FEMA-273 and ATC-40.
TYPES OF PUSHOVER ANALYSIS
Presently, there are two non-linear static analysis procedures available,Displacement Coefficient Method (DCM), documented FEMA-356 and Capacity Spectrum Method (CSM) documented in ATC-40. Both methods depend on lateral load-deformation variation obtained by non-linear static analysis under the gravity loading and idealized lateral loading due to the seismic action. This analysis is called Pushover Analysis.
CAPACITY SPECTRUM METHOD
Capacity Spectrum Method is a non-linear static analysis procedure which provides a graphical representation of the expected seismic performance of the structure by intersecting the structure’s capacity spectrum with the response spectrum (demand spectrum) of the earthquake. The intersection point is called as the performance point, and the displacement coordinate dp of performance point is the estimated
displacement demand on structure for the specified level of seismic hazard.
DISPLACEMENT COEFFICIENT METHOD
Displacement Coefficient Method is a non-linear static analysis procedure which provides a numerical process for estimating the displacement demand on structure using a bilinear representation of the capacity curve and a series of modification factors to calculate a target displacement. The point on capacity curve at target displacement is the equivalent of performance point in the capacity spectrum method. BUILDING PERFORMANCE LEVEL
Volume-5 Issue-1
International Journal of Intellectual Advancements
and Research in Engineering Computations
Pushover analysis on rc frames with and without shear wall
Parishith J
1, Mrs. V. Preetha
2 1PG Student, Structural Engineering, BIT, Sathyamangalam. 2
Assistant Professor, Civil Engineering Department, BIT, Sathyamangalam E – Mail: [email protected]
Building performance is the combined performance of both structural and non-structural components of the building. Different performance levels are used to describe the building performance using the pushover analyses, which are described below.
1) Operational level (OL):
As per this performance level building are expected to sustain no permanent damages. Structure retains original strength and stiffness. Major cracking is seen in partition walls and ceilings as well as in the structural elements.
2) 1.2.2 Immediate occupancy level (IO):
Buildings meting this performance level are expected to sustain no drift and structure retains original strength and stiffness. Minor cracking in partition walls and structural elements is observed. Elevators can be restarted. Fire protection is operable.
3) 1.2.3 Life Safety Level (LS):
This level is indicated when some residual strength and stiffness is left available in the structure. Gravity load bearing elements function, no out of plane failure of walls and tripping of parapet is seen. Some drift can be observed with some failure to the partition walls and the building is beyond economical repair. Among the non-structural elements failing hazard mitigates but many architectural and mechanical and mechanical systems get damaged.
4) 1.2.4 Collapse Prevention Level (CP):
Buildings meeting this performance level are expected to have little residual strength and stiffness, but the load bearing structural elements function such as load bearing walls and columns. Building is expected to sustain large permanent drifts, failure of partitions infill and parapets and extensive damage to non-structural elements. At this level the building remains in collapse level.
PLASTIC HINGE
Location of inelastic action of the structural member is called as plastic hinge.
ASSIGNMENT OF HINGES FOR PUSHOVER ANALYSIS For nonlinear static, and nonlinear direct-integration time-history analyses, users may simulate post-yield behaviour by assigning concentrated plastic hinges to frame and tendon objects. Elastic behaviour occurs over member length, and then deformation beyond the elastic limit occurs entirely within hinges, which are modelled in discrete locations. Inelastic behavior is obtained through integration of the plastic strain and plastic curvature within a user-defined hinge length. To capture plasticity distributed along member length, a series of hinges can be modeled. Multiple hinges may also coincide at the same location.
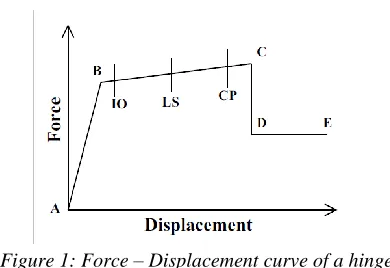
Plasticity may be associated with force-displacement behavior or moment-rotation. Hinges can be assigned (uncoupled) to any of the six DOF. The modeling of strength loss is discouraged, to mitigate load redistribution and to ensure numerical convergence.
Figure 1: Force – Displacement curve of a hinge
B. 1.4 PUSHOVER ANALYSIS PROCEDURE:
The use of the nonlinear static analysis pushover analysis came into practice in 1970’s but the potential of pushover analysis has been recognised for last 10 to 15 years. Pushover analysis can be performed as either force control or displacement controlled depending on the physical nature of the Lateral load and behaviour expected from the structure force. Controlled procedure is useful when the load is already known and the structure is expected to support the load. Displacement controlled procedure should be used where the magnitude of the applied load is not known in advance (such as seismic loading) or when the structure can be expected to lose strength or become unstable. The nonlinear pushover analysis of a structure is an iterative procedure. It depends on final displacement, as the effective damping depends on the hysteretic energy loss due to inelastic deformation which in turn depends on the final displacement. This makes the analysis procedure iterative.
Steps for Pushover Analysis: 1. Modelling 2. Static Analysis 3. Design
4. Pushover Analysis
II. MODELLING AND ANALYSIS OF STRUCTURE
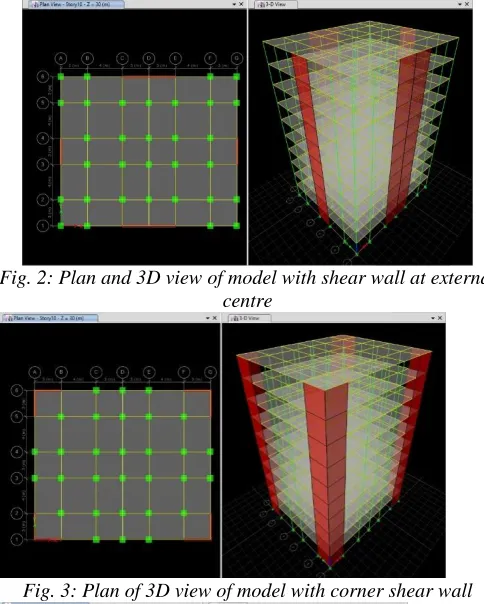
Pushover Analysis is carried out on four different RC models with and without shear wall at different locations. All the models are of G+9 storey and having a floor area of 20 m x17 m.
Model 1: Bare Frame model
Model 2: Frame with Shear wall at External mid-span Model 3: Frame with Shear wall at Corners
Model 4: Frame with Core Shear wall
Fig. 2: Plan and 3D view of model with shear wall at external centre
Fig. 3: Plan of 3D view of model with corner shear wall
Fig. 4: Plan of model with core shear wall Table 1: Description of the model
Sl. No.
Description of the Models
1 No. of Storey G+9
2 Typical Floor height 3 m 3 Ground Floor height 3 m 4 Plan dimension 20 m x 17 m
5 Beam size 300x600 mm
6 Column size 700x700 mm
7 Thickness of slab 125 mm
8 Concrete grade M 30
9 Rebar Grade Fe 415
10 Thickness of Shear wall
200 mm
11 Dead load on slab 1 kN/m2 12 Live load on slab 3 kN/m2 13 Seismic load As per IS
1893:2002 14 Load Combinations As per IS
1893:2002 15 Importance Factor (I) 1 16 Response Reduction
Factor (R)
5
The models are designed for Zone V and for type II soil.
III. RESULTS AND DISCUSSION
The models are analyzed statically and designed in ETABS 2016. The pushover analysis is carried out on all the models and performance point of the structure are determined. 3.1. Performance Point:
As per ATC 40, the buildings are pushed to a controlled displacement of 4% of the height of the structure. The performance point for all the RC models are determined and the performance point diagram are shown in the figure below.
Figure 5: Capacity-Demand spectrum for bare frame
Figure 7: Capacity-Demand spectrum for frame with shear wall at corners
Figure 8: Capacity-Demand spectrum for frame with shear wall at core
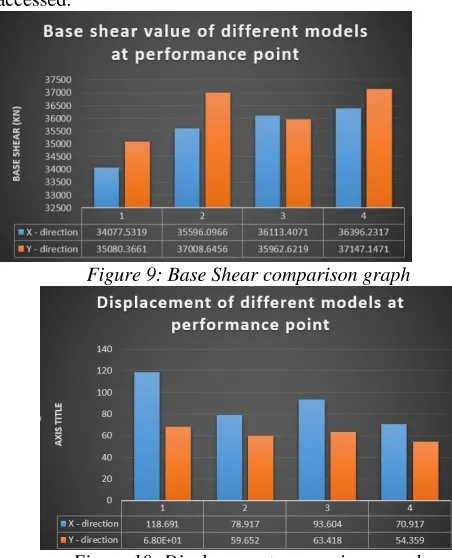
Base shear and Displacement:
The base shear and displacement of the models for push forces in X and Y direction are tabulated below.
Table 2: Base shear and Displacement in X direction Type of
Structure
Performance Point Base Shear
(kN)
Displacement (mm) Model 1 34077.5319 118.691 Model 2 35596.0966 78.917 Model 3 36113.4071 93.604 Model 4 36396.2317 70.917
Table 3: Base shear and Displacement in Y direction Type of
Structure
Performance Point Base Shear
(kN)
Displacement (mm) Model 1 35080.3661 68.932 Model 2 37008.6456 59.652 Model 3 35962.6219 63.418 Model 4 37147.1471 54.359
The difference in base shear and displacement of different models at performance point is shown in the form of bar graph below.
From the graph the seismic performance of each model can be accessed.
Figure 9: Base Shear comparison graph
Figure 10: Displacement comparison graph
IV. CONCLUSION
The seismic performance evaluation of the building is studied based on pushover analysis. The building models with and without shear walls at different locations are modelled and pushover analysis is carried out using ETABS 2016 software. The analysis reports are taken in terms of Performance Pointof the building, which gives the actual displacement and base shear of the building.
The following conclusions are derived from the analysis process.
Provision of shear wall has proved to be a good lateral load resisting system from the observation of performance point in the models with and without shear wall.
Model 4, the model with shear wall at core shows higher performance point, which will obviously behave better compared to other models.
The base shear value at performance point for model 4 is greater than all other models in both X and Y direction.
The displacement at performance point is minimum for model 4 comparing other models. It is very clear that, model 4 shows better
seismic performance than all other models. On comparison of models with and without
of the frame. In our case, model 4 seems to be a judicious placement.
REFERENCES:
1. HimaleeRahangdale, S.R. Satone, “Design and Analysis of Multistoreyed building with effect of shear wall”, International Journal of Engineering Research and Applications (IJERA), Vol. 3, Issue 3, May-Jun 2013, pp. 223-232.
2. AnshulSud, Raghav Singh Shekhawat, PoonamDhiman, “Effect of different shear wall configurations on seismic response of a moment resisting frame”, European Scientific Journal, May 2014.
3. Karim M Pathan, HuzaifaNakhwa, ChoudharyUsman, YadavNeeraj, ShaikhKashif, “Effective height of curtailed shear walls for high rise reinforced concrete buildings”, Research Inventory: International Journal of Engineering and Science, Vol. 3, Issue 3, June 2013, PP 42-44.
4. Mr. K. Lovaraju, Dr. K.V.G.D. Balaji, “Effective location of shear wall on performance of building frame subjected to earthquake loading”, International Advanced Research Journal in Science, Engineering and Technology, Vol. 2, Issue 1, Jan 2015.
5. M.R. Suresh, AnanthShayanaYadav S, “The optimum location of shear wall in high rise buildings under lateral loading”, International Journal of Research in Engineering and Technology, Jan 2013, Vol. 3, Issue 4.
6. Dhiraj. V.Narkhede, Prof.G.P.Deshkukh, “Performance of Shear wall building at various positions by using pushover analysis”, International Journal of Research in Advent Technology, Special Issue, CONVERGENCE 2016, 6-7 April 2016.
6. IS 456:2000, “Indian Standard Plain and Reinforced Concrete Code of Practise”, Bureau of Indian Standards, New Delhi.
7. IS 875:1987, “Indian Standard Code of Practise for Design Loads (Other than Earthquake) for Buildings and Structures, Part 1: Dead Loads, Part 2: Imposed loads”, Bureau of Indian Standards, New Delhi.