Reward Processing in First - Degree Relatives of Individuals with Schizophrenia
By
Niveditha Jagadesh
Senior Honors Thesis
Department of Psychology and Neuroscience The University of North Carolina at Chapel Hill
April 16th, 2018
Approved:
Acknowledgements
Firstly, I would like to thank the participants of the study conducted at the University of California, Los Angeles (UCLA) as well as their parents who helped coordinate their schedules with those of the researchers. I would also like to thank the original investigators of this study for pursuing some of the topics highlighted in this investigation and for designing a methodology by which we can better understand some of the abnormalities associated with schizophrenia.
Secondly, I would like to thank the members of my committee. Dr. Jessica Cohen and Dr. Teague Henry have been very supportive throughout the whole process and have inspired me to continue pursuing research in the future. I would also like to thank the both of them, as well as Dr. Stacey Daughters, for taking the time out of their busy schedules to participate in my defense. Their questions and insight into my thesis topic have helped me think of future directions for this study.
I would also like to thank Dr. Beth Kurtz – Costes and Dr. Peter Ornstein for guiding me through the process of writing the thesis with their informative lectures. Dr. Kurtz – Costes and Dr. Ornstein have also taken the time to answer any specific questions I may have, including those related to specific parts of my thesis.
Additionally, I would like to thank the members of the Cohen lab, particularly Dr. Shana Hall and Ms. Kelly Eom, for guiding me through practice presentations and poster talks that ensured I was well-prepared for my oral defense.
Abstract
Schizophrenia is a psychological disorder that affects individuals’ cognitions, behaviors,
emotions and ultimately, their ability to function in society. Finding ways to address and treat the abnormalities caused by this disorder could help to better affected individuals’ quality of life. This study addresses one such abnormality, dysfunctional reward processing, by studying first-degree relatives of individuals with schizophrenia, since they exhibit similar functional brain differences and are highly vulnerable. I examined whether there were functional connectivity differences between healthy control participants and first-degree relatives of individuals with schizophrenia in three networks: the default mode network (DMN), the salience network (SAL), and the subcortical regions of the reward network (SUB). 30 healthy participants (age range 8-18) and 10 first-degree relatives (age range 8-8-18) performed a probabilistic learning task while undergoing fMRI. Participants classified abstract stimuli into one of two categories and were given feedback in the form of a monetary reward. Results showed that for SUB within-network functional connectivity, first-degree relatives showed marginally higher mean connectivity than healthy control participants during stimulus presentation. First-degree relatives also showed significantly higher mean connectivity values between brain networks than healthy control participants during stimulus presentation; during feedback, this association was only marginally significant. Results imply that first-degree relatives have more diffuse functional connectivity than healthy controls, which suggests their ability to process information quickly and with targeted intent is less efficient. Future interventions addressing these functional abnormalities could be helpful in treating symptoms of schizophrenia, like anhedonia.
Reward Processing in First-Degree Relatives of Individuals with Schizophrenia Introduction
Schizophrenia is a psychological disorder that affects ~ 1% of the global population and reduces the average potential lifespan of an individual with the disorder by 28.5 years (as cited in Kessler et al., 2005; McGrath, Saha, Chant, & Welham, 2008; Saha, Chant, Welham, &
McGrath, 2005; Olfson, Gerhard, Huang, Crystal, & Stroup, 2015). Individuals with schizophrenia face a range of problems related to cognition, behavior, and emotions (Mayo Clinic, 2016). The DSM-V diagnoses individuals with schizophrenia when they display at least one positive symptom – delusions, hallucinations, and/or disorganized speech – and in the absence of a second positive symptom, at least one other symptom such as anhedonia (a negative symptom), gross disorganization, or catatonic behavior (American Psychiatric Association, 2013). Such problems oftentimes affect these individuals’ quality of life and ability to function in society. In recent years, researchers have spent time examining one such key problem in
individuals with schizophrenia: they experience a sense of anhedonia when it comes to obtaining rewards (Strauss et al., 2014). Such lack of engagement in reward-related behavior suggests abnormal processing of rewards. Reward processing involves our ability to recognize and interpret related stimuli and identify if such reward is gratifying. However, when reward-processing mechanisms are disrupted, as it is in individuals with schizophrenia, it becomes difficult to find satisfaction with daily activities and find motivation to perform tasks, both key aspects that contribute to one’s quality of life.
In an effort to better understand this dysfunction, a step necessary to finding and
patients, first-degree relatives, and healthy control participants as subjects. They used fMRI – a neuroimaging modality that examines a proxy of neural activity, blood oxygen level dependent (BOLD) response. It allows researchers to study the pattern of changes that occur in a particular area of the brain due to variations in regional activity when individuals shift between resting and task states. fMRI studies have shown that schizophrenia patients exhibit diminished fronto-striatal activity when performing cognitive tasks (Zandlbelt et a., 2011; van Veelan et al., 2010; van Veelan et al., 2011). Such findings involving activity have prompted researchers in the past few years to examine whole brain functional connectivity as a way to better understand the mechanisms that give rise to dysfunctional reward processing. Their results showed negative (increased activity in one region associated with decreased activity in another region)
connectivity between the midbrain and insula in individuals with schizophrenia, while healthy control participants showed positive connectivity between the same regions (Gradin et al., 2013). Since the midbrain is part of the reward network and the insula is part of the salience network, this suggests dysfunctional between-network connectivity in schizophrenia, a finding that serves as a significant component of this paper’s study and hypothesis. However, these previous
functional connectivity analyses were conducted using only patients and healthy control participants as subjects (Gradin et al., 2013).
This is important because the brain of a patient with schizophrenia who has taken antipsychotic medication shows differences from that of a patient who has never taken
antipsychotic medication; thus, it is not possible to determine whether changes in brain function are due to the illness or to the treatment of the illness (Juckel et al., 2006a; Juckel et al., 2006b). First degree relatives tend to be at higher risk for developing schizophrenia due to their
and changes in brain function related to schizophrenia than people without a familial
predisposition to schizophrenia. In support of this, healthy first-degree relatives show similar alterations in task-related brain activity when compared to patients (De Leeuw et al., 2014). By studying the responses of healthy control participants and first-degree relatives of individuals with schizophrenia, researchers can therefore study changes in brain function and cognition that are associated with schizophrenia, without the confounding factor of medication. Consequently, in this current study, I chose to focus on the functional brain connectivity differences between healthy control participants and healthy first-degree relatives of individuals with schizophrenia. This thesis analyzes differences in functional network organization during both stimulus
presentation and feedback in a reward processing task. The remainder of this introduction begins by addressing the major role of dopamine in schizophrenia and its relationship to schizophrenia symptomatology and subsequently details newer theories implicating the roles of the default mode network (DMN) and the salience network (SAL) in dysfunctional reward processing. The Role of the Subcortical Regions in Reward Processing
that schizophrenia patients exhibit abnormal fronto-striatal activity when performing cognitive tasks, which is indicative of functional differences in dopaminergic systems when compared to healthy individuals (Zandlbelt et a., 2011; van Veelan et al., 2010; van Veelan et al., 2011). To better understand this relationship between dopamine and abnormal fronto-striatal activity during reward processing, researchers have found the examination of anhedonia (an inability to feel pleasure) to be of particular importance (Strauss et al., 2014).
There is increasing evidence that individuals with schizophrenia have intact emotional experience, even if they do display signs of anhedonia, an established feature of this disorder (Heerey & Gold, 2007; Bleuler, 1911). Researchers speculate that anhedonia may therefore actually reflect a deficit in anticipatory pleasure or approach motivation rather than a deficit in consummatory pleasure (Burbridge & Barch, 2007; Horan, Green, Kring, & Neuchterlein, 2006; Gard, Kring, gard, Horan, & Green, 2007). Some suggest that many of the negative symptoms of schizophrenia, including anhedonia, are associated with abnormal ventral striatal reward
processing (Gradin et al., 2013). For example, in a study using fMRI to measure brain activity during emotion processing, the right ventral striatum and left putamen showed reduced activation to positive stimuli in individuals with schizophrenia compared to healthy control participants (Dowd & Barch, 2010). Since the ventral striatum is associated with both anticipation and receipt of pleasure from stimuli, the aforementioned reduced right ventral striatal activation may
this failure to respond to positive factors may contribute to the anticipation and motivation deficits characteristic of symptoms like anhedonia (Berridge & Kringelbach, 2008).
Studies also suggest that such decreases in ventral striatal activity may be due to an increase in dopaminergic tone, something seen in individuals with schizophrenia (Heinz & Schlagenhauf, 2010; Davis, Kahn, Ko, & Davidson, 1991; Howes & Kapur, 2009). According to
researchers, abnormal striatal responses may in fact be due to an increased metabolism of dopamine (Corlett et al., 2007; Juckel et al., 2006b; Roiser et al., 2009). Another study has also concluded that dopaminergic dysfunction might potentially be causing the failure of cues signaling potential reward, thereby diminishing ventral striatal activation (De Leeuw et al., 2014). Additionally, correlations between decreased ventral striatal activity during reward anticipation and apathy were also seen in individuals with schizophrenia (Simon et al., 2010). Interestingly, apathy is associated with dysfunctional dopamine activity in the reward network (Bressan & Crippa, 2005). This association reinforces the aforementioned findings by Dowd and Barch (2010) about the relationship between negative symptoms and ventral striatal activity.
was presented. If they responded within the allotted time frame, they were given a response of “correct” with an indication of the amount of money they earned.
Regions of interest (ROI) analyses indicated less activity in the ventral striatum, dorsal striatum, right anterior insula and supplementary motor area (SMA) in siblings than in healthy control participants. However, only the difference in activity levels for the left ventral striatum and the left SMA remained significant after researchers corrected for multiple comparisons for the various ROIs (De Leeuw et al., 2014). Comparing siblings and healthy control participants, siblings showed decreased ventral striatal activity during reward anticipation but increased bilateral ventral striatal and orbitofrontal cortex activity during reward receipt (De Leeuw et al., 2014). Such decrease in ventral striatal activity during reward anticipation was also seen in other unaffected first-degree relatives of schizophrenia patients (Grimm et al., 2014). Other researchers have suggested that there may be an association between dysfunction of the prefrontal cortex and abnormal striatal functioning, which is interesting because the prefrontal cortex has connections to the striatum and ventral tegmentum (Guillin, Abi-Dagham, & Laruelle, 2007; Vernaleken et al., 2007; Meyer-Lindenberg et al., 2002).
potentially be associated with the abnormal processing of rewards. In this next section, I discuss the role of one of these other networks, the default mode network.
The Role of The Default Mode Network in Reward Processing
The default mode network (DMN) is one of the functional networks whose dysfunctional connectivity with the reward processing network could implicate many of the symptoms
associated with deficient reward processing in schizophrenia. Recent research looking into the roles of the DMN in healthy individuals suggests that the network generally shows decreased activation during task-related cognitive processes (Buckner et al., 2008).
In a study analyzing the neural correlates of reward processing in healthy siblings of patients with schizophrenia, Hanssen et al. (2015) gave healthy siblings of schizophrenia patients and healthy control participants a monetary incentive delay task while monitoring their brain activity under fMRI. Whole-brain analyses showed that there were differences between the groups during reward anticipation in that the insula, the posterior cingulate cortex (PCC), and the medial frontal gyrus (MFG) – all areas associated with the DMN – were less deactivated in siblings compared to healthy control participants (Hanssen et al., 2015). Hanssen et al. (2015) suggest that less deactivation in the MFG and PCC during reward processing may indicate a lack of complete disengagement from the DMN; as a result, one isn’t able to fully utilize resources for reward-related behavior. Since the DMN is active during internally-focused tasks, less
potential endophenotype1 in the development of schizophrenia symptoms (Hanssen et al., 2015). These results suggest there may be connectivity abnormalities between the DMN and the reward processing network. However, while researchers found hyper-activation of the DMN during reward processing, they also noticed deactivation in the right insula – a region that is part of the salience network (SAL) and involved in cognitive task control (Hanssen et al., 2015). Next, I consider the role of the SAL, whose functions include recruiting different brain regions necessary for processing sensory information (White, Joseph, Francis, & Liddle, 2010). The Role of the Salience Network in Reward Processing
The insula is a brain region that works in coordination with the anterior cingulate cortex (ACC). Their joint action is detailed as part of the salience network that is thought to allow individuals to switch between the default mode network and task related networks in the service of task goals (Seeley et al., 2007; Taylor et al., 2009; Menon & Uddin, 2010). The importance of this can be seen through Palaniyapan’s theory of proximal salience. In this theory, Palaniyapan and Liddle (2011) suggest that an event, such as a sensation or thought, attains “proximal salience” when it gains momentary activity within the SAL, causes an update in expectations, and subsequently initiates or alters an action. Further, this suggests that the SAL is involved in activating brain areas necessary for processing currently relevant stimuli while decreasing the activity in brain regions used to process previously salient stimuli (Palaniyapan & Liddle, 2011).
Researchers have examined abnormal functioning in the salience network in an effort to understand reward processing in schizophrenia patients. Previous research citing decreased gray matter and functional abnormalities within the salience network might implicate the salience network in the diminished processing of rewards in schizophrenia patients (Glahn et al., 2008; Wylie & Tregellas, 2010). Additionally, researchers suggest that negative symptoms of the disorder, while linked to the abnormal processing of rewards, may also be tied to patients’ incorrect attribution of motivational salience to otherwise neutral/irrelevant stimuli (Kapur, 2003). To investigate this notion and the hypothesis that there may be a disruption of the reward system that accompanies the promotion of false associations, Gradin et al. (2013) examined functional connectivity abnormalities between the salience network and midbrain as a means of studying blunted reward processing in schizophrenia patients. Participants performed a
Pavlovian reward task while undergoing fMRI. In each trial, participants were presented with one of two fractal pictures. Two seconds after the picture was presented, participants were rewarded with 0.1 mL of water, or not, according to a random pattern. The pictures were associated with either a high or low probability of water delivery and the picture that was associated with the high probability water delivery changed throughout the task. Participants were told before the start of the trial that the object of the task was to notice which picture was associated most with water delivery and were notified that this association may change
throughout the task.
former group showed positive connectivity (Gradin et al., 2013). Patients also showed decreased connectivity between the midbrain and insula when compared to healthy control participants; this decrease was correlated with increased severity of psychotic symptoms (Gradin et al., 2013). The reduced functional connectivity between the insula and the midbrain indicates reduced
integration between the SAL network and the dopaminergic midbrain in schizophrenia patients, which by extension, suggests that the SAL fails to recruit the areas that process reward in patients (Gradin et al., 2013). These points provide additional explanations for the diminished reward processing ability seen in schizophrenia patients that deviates from the traditional dopaminergic theory.
Similar to previous studies, results also showed that patients had reduced ventral striatal responses during reward vs. no reward conditions, which was correlated with the severity of their negative symptoms (Gradin et al., 2013). Their work arose from other researchers’ hypothesis, which suggested that reduced reward processing in schizophrenia patients may be linked to negative symptoms often accompanying the disorder (Juckel et al., 2006a; Juckel et al., 2006b). In studying this hypothesis, these researchers examined ventral striatal activation during
anticipation of rewards in both medicated and unmedicated patients with schizophrenia and found that both groups exhibited reduced ventral striatal activity (Juckel et al., 2006a; Juckel et al., 2006b). When Gradin et al. (2013) replicated Juckel et al.’s methods, they found that this reduction correlated with the severity of negative symptoms present in the individual, and subsequently concluded that there is an association between negative symptoms and abnormal processing of rewards in the ventral striatum. However, all of these findings may be limited in their generalization due to the small sample size of participants and the fact that the
schizophrenia patients were medicated. Nonetheless, the findings regarding abnormal reward processing and the impaired connectivity between the salience and reward network signify a direction for future research.
Current Direction of Research
between a dimensional measure of reward responsivity (using the reward sensitivity subscale of the Behavioral Activation Scale) and resting-state functional connectivity. A higher score on the subscale reflected a greater sensitivity to reward. After performing a multivariate distance-based matrix regression, researchers found an association between dimensional deficits in reward responsivity and hyperconnectivity within the DMN (Sharma et al., 2017). They also found an association between impaired reward responsivity and diminished connectivity between the DMN and cingulo-opercular network regions, which overlaps with the SAL (Sharma et al., 2017). Reduced connectivity between the nucleus accumbens and the DMN was also associated with reward deficits, which is interesting since nucleus accumbens abnormalities have previously been linked with anhedonia (Sharma et al., 2017; Wang et al., 2016). These findings once again suggest that symptoms of schizophrenia like anhedonia may be the result of underlying brain network functional connectivity abnormalities.
This introduction explored the role of dopamine in dysfunctional reward processing in schizophrenia, as well as the roles of the DMN and SAL in regulating task-related networks – including the reward processing system. Taken together, these studies suggest a complex pattern of dysfunction with regard to the connectivity between reward processing centers. Further research into the precise nature of this dysfunction can be done with whole brain connectivity analyses, which can identify and quantify inter-regional relationships in the brain, and elucidate researchers about these inter-network influences clearly. In the current study, control participants and individuals were asked to perform a reward-learning task during an fMRI scan. Brain
activity was measured during reward anticipation (stimulus presentation) and receipt (feedback). Functional connectivity between brain regions was measured to quantify the statistical
were acquired from Cohen et al.’s (2010) study examining adolescent response to prediction errors. On this basis, the current study sought to analyze how alterations in functional
connectivity between the DMN and the subcortical regions (SUB) and between the DMN and SAL were different in first-degree relatives of individuals with schizophrenia as compared to healthy control participants. The following functional connectivity hypothesis will ultimately be the focus of this thesis: first-degree relatives of individuals with schizophrenia will show
increased within-network functional connectivity for all three networks and decreased between-network functional connectivity when compared to healthy controls during both stimulus presentation and feedback while performing reward-processing tasks.
Method Participants
demographic information, and/or regions of interest (ROI) data for the other participants. The first-degree relatives were matched in age, education and gender to the healthy control
participants. Procedure
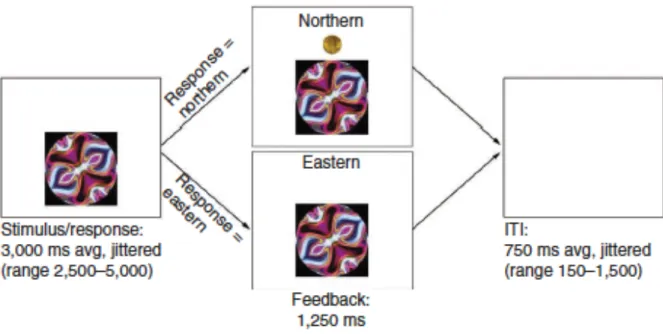
The following procedure is also detailed in the Cohen et al. (2010) paper. In a probabilistic learning task, participants classified abstract stimuli into one of two categories (Northern and Eastern) and were given feedback displaying the correct response at the end of each trial. On each trial, they saw an abstract image representing patterns on a college t-shirt. They were asked to classify the shirt as being worn by someone who attended Northern University (left button press using right index finger) or Eastern University (right button press using right middle finger). The task was probabilistic in that participants were told that
individuals other than those who actually attend the university may occasionally wear the shirt; thus, the feedback would not always be consistent for each stimulus (Cohen et al., 2010).
response (which university the stimulus was actually associated with) and the amount of their monetary reward, if they were correct. To ensure motivation, participants were paid the amount of reward they won during the task at the end of the study. The above information is also detailed in Figure 1, which can be found at the end of this paper.
fMRI Data Acquisition
MRI data acquisition parameters are described in detail in the Cohen et al. (2010) paper. As described there, participants performed a probabilistic learning task during fMRI acquisition. They viewed the task through LCD goggles and responded using an MR-compatible button box. Abstract computer-generated stimuli were presented using the ArtMatic Pro, U&I Software LLC. Head movement was minimized using foam padding in an eight-channel head coil. A Siemens Allegra 3T scanner was used to acquire structural and functional scans, such as a high resolution T1-weighted magnetization-prepared, rapid-acquisition gradient echo (MPRage; TR = 2300 ms, TE = 2.1 ms, voxel size = 1.3 x 1.3 x 1 mm, 1 mm isotropic, 160 slice sagittal acquisition, 1 mm slice thickness, matrix 192 x 192 field view of 256). BOLD T2-weighted echoplanar images (EPI) (34 slices, slice thickness = 4 mm, voxel size = 3.1 x 3.1 x 4.00, TR = 2000 ms, TE = 30 ms) were collected for the functional runs during the reward processing task.
fMRI Data Preprocessing
Results included in this manuscript come from preprocessing performed using the latest FMRIPREP version, a Nipype based tool (Esteban et al., 2017; Gorgolewski et al., 2011; Gorgolewski et al., 2017). Each T1 weighted volume was skull stripped using
2009c using nonlinear transformation implemented in ANTs v2.1.0 (Fonov et al.,2009; Avants et al., 2008). Functional data was motion corrected using MCFLIRT v5.0.9 (Jenkinson et al., 2002). This was followed by coregistration to the corresponding T1 weighted volume using boundary-based registration at 9 degrees of freedom – implemented in FreeSurfer v6.0.0 (Greve, 2009). Motion correcting transformations, T1 weighted transformation, and MNI template warp were applied in a single step using antsApplyTransformations v2.1.0 with Lanczos interpolation. Three tissue classes were extracted from T1 weighted images using FSL FAST v5.0.9 (Zhang, 2001).
ROI Parcellation
The brain was parcellated into 88 ROIs taken from the Power et al. (2011) functional atlas. These ROIs consisted of the a priori defined functional networks, Default Mode Network (DMN), Salience Network (SAL) and Subcortical reward-related regions (SUB)2. ROIs were defined as 9x9x9 millimeter voxel cubes centered on the ROI coordinate. See Figure 2 and Table 1.
Functional Connectivity Data Analysis
In neuroscience, functional connectivity is a measure used to quantify correlations in BOLD activity level between different brain regions of interest (ROIs) across time. When the activity levels of two brain regions are significantly correlated (i.e., an increase in activity in one brain region is associated with an increase or decrease in activity in another brain region), this
indicates that those regions are functionally connected to each other. Functional connectivity can be used to determine relationships between two or more brain regions during both resting and task states. It is important to note that functional connectivity neither provides information about the directional nature of this relationship nor about causality. In this current study, functional connectivity is used to observe the relationships between brain regions as activity level changes over time during a probabilistic learning task.
Beta series correlation. To determine functional connectivity during task states, a beta-series correlation was used. This involves generating parameter estimates – or beta values – using the value of the fMRI BOLD response during a particular trial of interest or phase of a trial. In this study, we were interested in two separable phases within each trial: stimulus
presentation and feedback. All trials were included in the beta-series correlation for each phase. Beta series correlation was performed using the Least-Squares Separate method of Mumford, Turner, Ashby and Poldrack (2012), which implements a general linear model that included 32 nuisance regressors (motion parameters, white matter signal and CSF signal, squared terms, lag-1 derivatives, and squared lag-lag-1 derivatives), along with regressors for trial phases of non-interest (i.e., feedback phase for the Stimulus beta-series and stimulus phase for the Feedback beta-series). A highpass filter of .01 mHz was applied to both the design matrix and voxel data. Beta series were calculated across the entire brain independently for Stimulus events and Feedback events. Beta values for each trial phase were temporally sorted, resulting in a beta series containing 144 trials for each phase (Stimulus and Feedback).
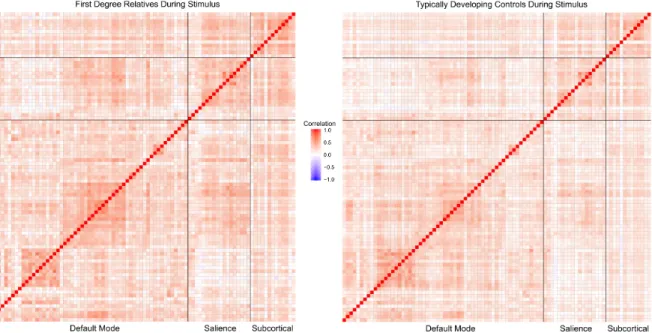
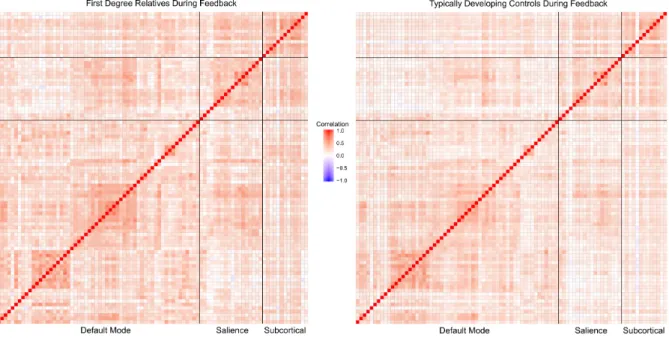
Once whole-brain beta-series maps were generated, beta-values were averaged across all voxels within each ROI and correlated across all pairs of ROIs to generate a Pearson’s r
DMN, SAL, and SUB to create a correlation matrix in which each cell represented the magnitude of the beta-series correlation between ROIs. The correlation coefficients were then standardized to allow for statistics to be conducted. See Figure 3 and Figure 4 for correlation matrices of the networks during stimulus presentation and feedback, respectively.
Functional connectivity metrics. Following ROI parcellation and correlation matrix generation, summary functional connectivity metrics were calculated. Within-network functional connectivity is defined as the average correlation in activity (during a particular trial phase) between brain regions within a functional network. Within-network functional connectivity values were calculated by taking the average beta-series correlation values of ROIs within each network. This measure yielded three within-network connectivity values per trial phase (DMN, SAL, SUB). Between-network functional connectivity is defined as the average correlation in activity (during a particular trial phase) between all functional networks. Between-network functional connectivity values were calculated by taking the average of the average beta-series correlation values of ROIs between two different networks, for all three networks (DMN, SAL, SUB). This measure yielded one between-network connectivity value per trial phase.
first-degree relatives and healthy control participants during both trial phases within and between networks. All statistical tests were performed using SPSS version 24.
Results Mean Differences During Stimulus Presentation
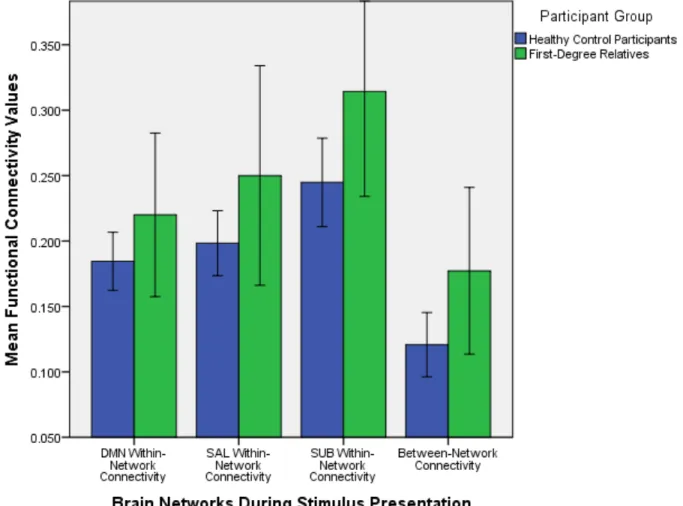
Independent samples t-tests of average functional within and between network connectivity values were performed to understand whether there were differences between healthy control participants and first-degree relatives with regards to how functionally connected various brain regions within and between each network are. The descriptive statistics that are presented in this section are detailed in Table 2. Differences in mean functional connectivity values between healthy control participants and first-degree relatives during stimulus
presentation are detailed in Figure 5. The significance level was set at a = 0.05.
DMN within-network connectivity. During stimulus presentation, there were no significant mean functional connectivity differences between first-degree relatives and healthy control participants within the DMN: t (38) = -1.447, p = 0.156.
SAL within-network connectivity. There were no significant mean functional
connectivity differences between first-degree relatives and healthy control participants within the salience network during stimulus presentation either: t (10.991) = -1.324, p = 0.212. The
aforementioned degrees of freedom are less than 38 because the Levene’s Test for Equality of Variances was significant, suggesting that equality of variances cannot be assumed for this data value.
showed higher mean connectivity values (M = 0.314, SD = 0.112) than healthy control participants (M = 0.245, SD = 0.090).
Between-network connectivity. Additionally, during stimulus presentation, first-degree relatives showed significant mean differences from healthy control participants with regards to overall connectivity between networks: t (38) = -2.148, p = 0.038. First-degree relatives showed higher mean connectivity values between the brain networks (M = 0.177, SD = 0.089) than healthy control participants (M = 0.121, SD = 0.066).
Mean Differences During Feedback
Independent samples t-tests of average functional within and between network
connectivity values were once again performed during feedback. This was done to understand whether there were differences between healthy control participants and first-degree relatives with regards to how functionally connected various networks are when receiving feedback. The descriptive statistics that are presented in this section are detailed in Table 3. Differences in mean functional connectivity values between healthy control participants and first-degree relatives during feedback are detailed in Figure 6. The significance level was set at a = 0.05.
DMN within-network connectivity. During feedback, there were no significant mean functional connectivity differences between first-degree relatives and healthy control participants within the DMN: t (10.854) = -1.116, p = 0.289.
SAL within-network connectivity. There were no significant mean functional
SUB within-network connectivity. During feedback, there were no significant mean differences in functional connectivity between relatives and healthy control participants within the subcortical regions: t (38) = -1.641, p = 0.109.
Between-network connectivity. During feedback, first-degree relatives showed
marginally significant mean differences from healthy control participants with regards to overall connectivity between networks: t (38) = -1.807, p = 0.079. First-degree relatives showed higher mean connectivity values (M = 0.169, SD = 0.090) than healthy control participants (M = 0.121, SD = 0.066).
Discussion
The goal of this investigation was to determine the extent to which within and between network functional connectivity was different between first degree relatives of patients with schizophrenia and healthy control participants during a reward learning task. We hypothesized that first-degree relatives would show increased within-network connectivity for the DMN, SAL, and SUB and decreased connectivity between networks. Results showed marginally increased within-network connectivity for the SUB during stimulus presentation but not for any of the other networks during both stimulus presentation and feedback, although numerically results for all networks were consistent with our hypothesis. Results also showed significantly increased connectivity between networks during both stimulus presentation and feedback, which was the opposite relationship of what was originally predicted.
connectivity of the reward network. Furthermore, this discrepancy in findings may partially be due to the fact that the individuals in the current study were first-degree relatives whereas the participants in the previous study were medicated patients. Further investigation can help understand if these functional connectivity differences are associated with individuals’
progression from an at-risk state to clinical diagnosis. Nonetheless, this increased within-network functional connectivity in the SUB during reward processing may suggest that first-degree relatives face difficulty in responding to rewarding stimuli due to the hyperconnectivity of reward-processing regions. This notion is supported by prior research that suggested that symptoms of schizophrenia like anhedonia may reflect an inability to mark salient stimuli as rewarding (Dowd & Barch, 2010). Furthermore, prior research has also suggested that apathy, another negative symptom, is associated with dysfunctional dopamine activity in the reward network (Bressan & Crippa, 2005). Therefore, this abnormal functional connectivity in the subcortical regions of the reward network may partially be explained by dysfunctional dopamine activity. These two factors in combination may explain the overall level of dysfunctional reward processing in relatives of patients with schizophrenia.
Additionally, the increased between-network connectivity during both stimulus presentation and (marginally) during feedback implies that first-degree relatives have more dispersed functional connectivity than healthy controls during tasks, which suggests their ability to process information quickly and with targeted intent is less efficient. During stimulus
(Kapur, 2003). However, the overall notion that there is increased between-network connectivity is inconsistent with prior research which suggested that decreased connectivity between the insula (a region associated with the SAL) and the midbrain (a region associated with the SUB) should reflect reduced integration and failure of the SAL to recruit areas that process rewards in patients (Gradin et al., 2013). In additional support of this inconsistency, other researchers have also suggested that reduced connectivity between the DMN and nucleus accumbens reflects reduced integration of brain networks involved in reward processing (Sharma et al., 2017). This discrepancy may be present partially because the current study examined between-network functional connectivity during a task state in first-degree relatives whereas the previous research by Gradin et al. (2013) studied medicated patients and that by Sharma et al. (2017) studied resting-state related connectivity in medicated patients. Another reason for this discrepancy may be the limited sample size of the first-degree relative participant pool, which could have yielded a lack of sufficient data necessary to analyze the relative increased or decreased connectivity when compared to healthy controls.
Although there was a lack of significant differences in within-DMN functional connectivity, the results of this study were still numerically consistent with prior literature suggesting hyperconnectivity of the DMN during resting state in individuals with heterogeneous psychopathology (Sharma et al., 2017). Since numerically there was greater within-DMN connectivity, a larger sample size may be needed to have the power to study this association.
interconnected relationships between multiple brain networks and regions. Unlike previous research which has primarily focused on activation of these brain regions during reward processing, this study has examined underlying functional network connectivity abnormalities during task states in first-degree relatives of individuals with schizophrenia. However, the low sample size of first-degree relatives, when compared to the corresponding group of healthy control participants utilized in this study, is a major limitation in making definitive conclusions about functional connectivity abnormalities’ impact on reward processing.
However, the interesting findings in the study present a direction for future research. The first step in further studying the topics presented in this paper include defining a reward network that encompasses all of the brain regions associated with processing reward. In this study, only the subcortical regions of the reward network were utilized. Examining functional connectivity across the reward network using all of the ROIs associated with it would yield more holistic results with regards to within and between network connectivity. Secondly, a larger sample size of first-degree relatives and healthy control participants ranging in age from childhood to adolescence to adulthood could give a better indication of how functional reward processing abnormalities develop and change over time. A lack of analysis of behavioral data is also a limitation. An examination of group differences in accuracy and response time will help to better understand the relationships between behavior, schizophrenia symptomology, and reward
References
American Psychiatric Association. (2013). Diagnostic and statistical manual of mental disorders (5th ed.). Arlington, VA: American Psychiatric Publishing.
Andersson, J.L.R., Skare, S., & Ashburner, J. (2003). How to correct susceptibility distortions in spin-echo echo-planar images: application to diffusion tensor imaging. Neuroimage [Internet], 20(2): 870–88. Available from: https://doi.org/10.1016/S1053-8119(03)00336-7
Avants, B.B., Epstein, C.L., Grossman, M., & Gee, J.C. (2008). Symmetric diffeomorphic image registration with cross-correlation: evaluating automated labeling of elderly and
neurodegenerative brain. Med Image Anal [Internet], 12(1): 26–41. Available from: https://doi.org/10.1016/j.media.2007.06.004
Bayer, H.M., & Glimcher,P.W. (2005). Midbrain dopamine neurons encode a quantitative reward prediction error signal. Neuron 47,129–141. doi: 10.1016/j.neuron.2005.05.020
Berridge, K. C., & Kringelbach, M. L. (2008). Affective neuroscience of pleasure: reward in
humans and animals. Psychopharmacology,199(3), 457-480.
doi:10.1007/s00213-008-1099-6
Bleuler, E. Dementia Praecox, or the Group of Schizophrenias. International Universities Press, New York; 1911.
Bressan, R.A., & Crippa, J.A. (2005). The role of dopamine in reward and pleasure behaviour--review of data from preclinical research. Acta Psychiatr Scand Suppl, 111, 14–21. Brisch, R., Saniotis, A., Wolf, R., Bielau, H., Bernstein, H., Steiner, J., . . . Gos, T. (2014).
Evolutionary Perspective: Old Fashioned, but Still in Vogue. Frontiers in Psychiatry, 5. doi:10.3389/fpsyt.2014.00110
Buckner, R.L., Andrews-Hanna, J.R., & Schacter, D.L. (2008). The brain’s default network. Ann.N.Y.Acad.Sci, 1124,1–38.doi:10.1196/annals.1440.011
Burbridge, J.A., Barch, D.M. (2007). Anhedonia and the experience of emotion in individuals with schizophrenia. J Abnorm Psychol, 116, 30–42.
Casey, B.J., Jones, R.M., Levita, L., Libby, V., Pattwell, S.S., Ruberry, E.J…Somerville, L.H. (2010). The storm and stress of adolescence: insights from human imaging and mouse genetics. Dev. Psychobiol, 52, 225–235.
Cohen, J. R., Asarnow, R. F., Sabb, F. W., Bilder, R. M., Bookheimer, S. Y., Knowlton, B. J., & Poldrack, R. A. (2010). A unique adolescent response to reward prediction errors. Nature Neuroscience, 13(6), 669-671. doi:10.1038/nn.2558
Corlett, P.R., Murray, G.K., Honey, G.D., Aitken, M.R., Shanks, D.R., Robbins, E.T.… Fletcher, P.C., (2007). Disrupted prediction-error signal in psychosis: evidence for an associative account of delusions. Brain, 130, 2387–2400.
Cox, R.W. (1996). AFNI: software for analysis and visualization of functional magnetic resonance neuroimages. Comput Biomed Res [Internet], 29(3): 162–73. Available from: https://doi.org/10.1006/cbmr.1996.0014
Dale, A., Fischl, B., & Sereno, M.I. (1999). Cortical Surface-Based Analysis: I. Segmentation and Surface Reconstruction. Neuroimage, 9(2): 179–94. Available
from: https://doi.org/10.1006/nimg.1998.0395
Drew, M. R., Simpson, E. H., Kellendonk, C., Herzberg, W. G., Lipatova, O., Fairhurst, S., . . . Balsam, P. D. (2007). Transient Overexpression of Striatal D2 Receptors Impairs Operant Motivation and Interval Timing. Journal of Neuroscience, 27(29), 7731-7739.
doi:10.1523/jneurosci.1736-07.2007
Dougherty, M.K., Gu, H., Bizzell, J., Ramsey, S., Gerig, G., Perkins, D.O., & Belger, A. (2012). Differences in subcortical structures in young adolescents at familial risk for
schizophrenia: a preliminary study. Psychiatry Res, 204, 68–74.
Dowd, E. C., & Barch, D. M. (2010). Anhedonia and Emotional Experience in Schizophrenia:
Neural and Behavioral Indicators. Biological Psychiatry,67(10), 902-911.
doi:10.1016/j.biopsych.2009.10.020
Esteban, O., Blair, R., Markiewicz, C.J., Berleant, S.L., Moodie, C., Ma, F…Gorgolewski, K.J. (2017). poldracklab/fmriprep: 1.0.0-rc8. Zenodo. Available
from: https://doi.org/10.5281/zenodo.1038145
Fonov, V., Evans, A., Mckinstry, R., Almli, C., & Collins, D. (2009). Unbiased nonlinear average age-appropriate brain templates from birth to adulthood. NeuroImage, 47. doi:10.1016/s1053-8119(09)70884-5
Gard, D. E., Kring, A. M., Gard, M. G., Horan, W. P., & Green, M. F. (2007). Anhedonia in
schizophrenia: Distinctions between anticipatory and consummatory pleasure.
Schizophrenia Research,93(1-3), 253-260. doi:10.1016/j.schres.2007.03.008
Glahn, D. C., Laird, A. R., Ellison-Wright, I., Thelen, S. M., Robinson, J. L., Lancaster, J. L., . . . Fox, P. T. (2008). Meta-Analysis of Gray Matter Anomalies in Schizophrenia:
Gorgolewski, K., Burns, C. D., Madison, C., Clark, D., Halchenko, Y. O., Waskom, M. L., & Ghosh, S. S. (2011). Nipype: A Flexible, Lightweight and Extensible Neuroimaging Data Processing Framework in Python. Frontiers in Neuroinformatics, 5.
doi:10.3389/fninf.2011.00013
Gorgolewski, K.J., Esteban, O., Ellis, D.G., Notter, M.P., Ziegler, E., Johnson, H…Ghosh, S. (2017). Nipype: a flexible, lightweight and extensible neuroimaging data processing framework in Python [Internet]. Available from: https://doi.org/10.5281/zenodo.581704 Gottesman, I. I., & Gould, T. D. (2003). The Endophenotype Concept in Psychiatry: Etymology
and Strategic Intentions. American Journal of Psychiatry, 160(4), 636-645. doi:10.1176/appi.ajp.160.4.636
Gradin, V. B., Waiter, G., O'connor, A., Romaniuk, L., Stickle, C., Matthews, K., Steele, J. D. (2013). Salience network-midbrain dysconnectivity and blunted reward signals in schizophrenia. Psychiatry Research: Neuroimaging, 211(2), 104-111.
doi:10.1016/j.pscychresns.2012.06.003
Greve, D. N., & Fischl, B. (2009). Accurate and robust brain image alignment using boundary-based registration. NeuroImage, 48(1), 63-72. doi:10.1016/j.neuroimage.2009.06.060 Grimm, O., Heinz, A., Walter, H., Kirsch, P., Erk, S., Haddad, L., & Meyer-Lindenberg, A.
(2014). Striatal Response to Reward Anticipation. JAMA Psychiatry, 71(5), 531. doi:10.1001/jamapsychiatry.2014.9
Guillin, O., Abi-Dargham, A., & Laruelle, M. (2007). Neurobiology of dopamine in schizophrenia. Int Rev Neurobiol, 78, 1-39.
patients with schizophrenia. Frontiers in Human Neuroscience, 9. doi:10.3389/fnhum.2015.00504
Heerey, E.A. & Gold, J.M. (2017). Patients with schizophrenia demonstrate dissociation between affective experience and motivated behavior. J Abnorm Psychol, 116: 268–278.
Heinz, A., & Schlagenhauf, F. (2010). Dopaminergic Dysfunction in Schizophrenia: Salience Attribution Revisited. Schizophrenia Bulletin, 36(3), 472-485. doi:10.1093/schbul/sbq031 Henry, T. R., Dichter, G. S., & Gates, K. (2017). Age and Gender Effects on Intrinsic
Connectivity in Autism Using Functional Integration and Segregation. Biological
Psychiatry: Cognitive Neuroscience and Neuroimaging. doi:10.1016/j.bpsc.2017.10.006 Howes, O. D., & Kapur, S. (2009). The Dopamine Hypothesis of Schizophrenia: Version
III--The Final Common Pathway. Schizophrenia Bulletin, 35(3), 549-562. doi:10.1093/schbul/sbp006
Huntenburg, J.M. (2014). Evaluating nonlinear coregistration of BOLD EPI and T1w images [Internet]. Freie Universität Berlin. Available from: http://hdl.handle.net/11858/00-001M-0000-002B-1CB5-A
Horan, W. P., Green, M. F., Kring, A. M., & Nuechterlein, K. H. (2006). Does anhedonia in
schizophrenia reflect faulty memory for subjectively experienced emotions? Journal of
Abnormal Psychology,115(3), 496-508. doi:10.1037/0021-843x.115.3.496
Jenkinson, M. (2002). Improved Optimization for the Robust and Accurate Linear Registration and Motion Correction of Brain Images. NeuroImage, 17(2), 825-841.
doi:10.1016/s1053-8119(02)91132-8
Juckel, G., Schlagenhauf, F., Koslowski, M., Filonov, D., Wüstenberg, T., Villringer, A., . . . Heinz, A. (2006a). Dysfunction of ventral striatal reward prediction in schizophrenic patients treated with typical, not atypical, neuroleptics. Psychopharmacology, 187(2), 222-228. doi:10.1007/s00213-006-0405-4
Juckel, G., Schlagenhauf, F., Koslowski, M., Wüstenberg, T., Villringer, A., Knutson, B., . . . Heinz, A. (2006). Dysfunction of ventral striatal reward prediction in
schizophrenia. NeuroImage, 29(2), 409-416. doi:10.1016/j.neuroimage.2005.07.051 Kapur, S. (2003). Psychosis as a state of aberrant salience: a framework linking biology,
phenomenology, and pharmacology in schizophrenia. Am. J. Psychiatry, 160,13– 23.doi:10.1176/appi.ajp.160.1.13
Kessler, R. C., Birnbaum, H., Demler, O., Falloon, I. R., Gagnon, E., Guyer, M., . . . Wu, E. Q. (2005). The Prevalence and Correlates of Nonaffective Psychosis in the National Comorbidity Survey Replication (NCS-R). Biological Psychiatry, 58(8), 668-676. doi:10.1016/j.biopsych.2005.04.034
Leeuw, M. D., Kahn, R. S., & Vink, M. (2014). Fronto-striatal Dysfunction During Reward Processing in Unaffected Siblings of Schizophrenia Patients. Schizophrenia Bulletin, 41(1), 94-103. doi:10.1093/schbul/sbu153
Mcgrath, J., Saha, S., Chant, D., & Welham, J. (2008). Schizophrenia: A Concise Overview of Incidence, Prevalence, and Mortality. Epidemiologic Reviews, 30(1), 67-76.
doi:10.1093/epirev/mxn001
Meyer-Lindenberg, A., Miletich, R. S., Kohn, P. D., Esposito, G., Carson, R. E., Quarantelli, M., . . . Berman, K. F. (2002). Reduced prefrontal activity predicts exaggerated striatal dopaminergic function in schizophrenia. Nature Neuroscience, 5(3), 267-271. doi:10.1038/nn804
Mumford, J. A., Turner, B. O., Ashby, F. G., & Poldrack, R. A. (2012). Deconvolving BOLD activation in event-related designs for multivoxel pattern classification
analyses. NeuroImage, 59(3), 2636-2643. doi:10.1016/j.neuroimage.2011.08.076 Olfson, M., Gerhard, T., Huang, C., Crystal, S., & Stroup, T. S. (2015). Premature Mortality
Among Adults with Schizophrenia in the United States. JAMA Psychiatry, 72(12), 1172. doi:10.1001/jamapsychiatry.2015.1737
Palaniyappan, L., & Liddle, P.F. (2011). Does the salience network play a cardinal role in psychosis? An emerging hypothesis of insular dysfunction. Journal of Psychiatry and Neuroscience, 36, 100-176.
Power, J., Cohen, A., Nelson, S., Wig, G., Barnes, K., Church, J., . . . Petersen, S. (2011). Functional Network Organization of the Human Brain. Neuron, 72(4), 665-678. doi:10.1016/j.neuron.2011.09.006
Pruim, R. H., Mennes, M., Rooij, D. V., Llera, A., Buitelaar, J. K., & Beckmann, C. F. (2015). ICA-AROMA: A robust ICA-based strategy for removing motion artifacts from fMRI data. NeuroImage, 112, 267-277. doi:10.1016/j.neuroimage.2015.02.064
Roiser, J.P., Stephan, K.E., denOuden, H.E., Barnes, T.R., Friston, K.J., & Joyce, E.M. (2009). Do patients with schizophrenia exhibit aberrant salience? Psychological Medicine, 39,199–209.
Saha, S., Chant, D., Welham, J., & Mcgrath, J. (2005). A Systematic Review of the Prevalence of Schizophrenia. PLoS Medicine, 2(5). doi:10.1371/journal.pmed.0020141
Seeley, W. W., Menon, V., Schatzberg, A. F., Keller, J., Glover, G. H., Kenna, H., . . . Greicius,
M. D. (2007). Dissociable Intrinsic Connectivity Networks for Salience Processing and
Executive Control. Journal of Neuroscience,27(9), 2349-2356.
doi:10.1523/jneurosci.5587-06.2007
Schizophrenia. (n.d.). Retrieved March 29, 2018, from
https://www.nimh.nih.gov/health/statistics/schizophrenia.shtml Schizophrenia. (2016, October 11). Retrieved September 28, 2017, from
http://www.mayoclinic.org/diseases-conditions/schizophrenia/symptoms-causes/dxc-20253198
Schultz,W. (1997). Dopamine neurons and their role in reward mechanisms. Curr. Opin.Neurobiol, 7,191–197.doi:10.1016/S0959-4388(97)80007-4
Sharma, A., Wolf, D. H., Ciric, R., Kable, J. W., Moore, T. M., Vandekar, S. N., . . .
Satterthwaite, T. D. (2017). Common Dimensional Reward Deficits Across Mood and Psychotic Disorders: A Connectome-Wide Association Study. American Journal of Psychiatry, 174(7), 657-666. doi:10.1176/appi.ajp.2016.16070774
and depression. Schizophrenia Research, 118(1-3), 154-161. doi:10.1016/j.schres.2009.11.007
Strauss, G.P., Waltz, J.A., & Gold, J.M. (2014). A review of reward processing and motivational impairment in schizophrenia. Schizophrenia Bulletin, 40, S107–S116.
doi:10.1093/schbul/sbt197
Taylor, K.S., Seminowicz, D.A., & Davis, K.D. (2009). Two systems of resting state
connectivity between the insula and cingulate cortex. Human Brain Mapping, 30, 2731– 2745.
Treiber, J. M., White, N. S., Steed, T. C., Bartsch, H., Holland, D., Farid, N., . . . Chen, C. C. (2016). Characterization and Correction of Geometric Distortions in 814 Diffusion Weighted Images. Plos One, 11(3). doi:10.1371/journal.pone.0152472
Tustison, N. J., Avants, B. B., Cook, P. A., & Gee, J. C. (2010). N4ITK: Improved N3 bias correction with robust B-spline approximation. 2010 IEEE International Symposium on Biomedical Imaging: From Nano to Macro. doi:10.1109/isbi.2010.5490078
van Veelen, N.M., Vink, M., Ramsey, N.F., & Kahn, R.S. (2010). Left dorsolateral prefrontal cortex dysfunction in medication-naïve schizophrenia. Schizophr Res, 123, 22–29. van Veelen, N.M., Vink, M., Ramsey, N.F., van Buuren, M., Hoogendam, J.M., & Kahn, R.S.
(2011). Prefrontal lobe dysfunction predicts treatment response in medication-naive first-episode schizophrenia. Schizophr Res, 129, 156–162.
Vink, M., Leeuw, M. D., Pouwels, R., Munkhof, H. E., Kahn, R. S., & Hillegers, M. (2016). Diminishing striatal activation across adolescent development during reward anticipation in offspring of schizophrenia patients. Schizophrenia Research, 170(1), 73-79.
doi:10.1016/j.schres.2015.11.018
Vink, M., Zandbelt, B. B., Gladwin, T., Hillegers, M., Hoogendam, J. M., Wildenberg, W. P., . . . Kahn, R. S. (2014). Frontostriatal activity and connectivity increase during proactive inhibition across adolescence and early adulthood. Human Brain Mapping, 35(9), 4415-4427. doi:10.1002/hbm.22483
Wang, S., Peterson, D. J., Gatenby, J. C., Li, W., Grabowski, T. J., & Madhyastha, T. M. (2017). Evaluation of Field Map and Nonlinear Registration Methods for Correction of
Susceptibility Artifacts in Diffusion MRI. Frontiers in Neuroinformatics, 11. doi:10.3389/fninf.2017.00017
Wang, Y., Liu, W., Li, Z., Wei, X., Jiang, X., Geng, F., . . . Chan, R. C. (2015). Altered corticostriatal functional connectivity in individuals with high social
anhedonia. Psychological Medicine, 46(01), 125-135. doi:10.1017/s0033291715001592 White, T. P., Joseph, V., Francis, S. T., & Liddle, P. F. (2010). Aberrant salience network
(bilateral insula and anterior cingulate cortex) connectivity during information processing in schizophrenia. Schizophrenia Research, 123(2-3), 105-115.
doi:10.1016/j.schres.2010.07.020
Zandbelt, B.B., van Buuren, M., Kahn, R.S., & Vink, M. (2011). Reduced proactive inhibition in schizophrenia is related to corticostriatal dysfunction and poor working memory. Biol Psychiatry, 70, 1151–1158.
Zhang, Y., Brady, M., & Smith, S. (2001). Segmentation of brain MR images through a hidden Markov random field model and the expectation-maximization algorithm. IEEE
Footnotes
1 An endophenotype is defined as a measurable concept that is in-between disease and distal genotype and represents simpler clues to genetic underpinnings than the disease itself (Gottesman & Gould, 2003).
Table 1.
Brain Regions of Interest (ROIs) Within Each Network
Power ROI ID X Y Z System Closest AAL Region
74 -40.5 -75.27 25.8 Default mode Occipital_Mid_L 75 5.55 66.69 -3.55 Default mode Frontal_Med_Orb_R 76 8.36 47.59 -15.18 Default mode Rectus_R
77 -12.6 -39.64 0.93 Default mode Lingual_L
78 -17.65 63.19 -9.17 Default mode Frontal_Sup_Orb_L 79 -45.79 -60.69 20.85 Default mode Temporal_Mid_L 80 43.43 -72.21 28 Default mode Occipital_Mid_R 81 -43.58 11.99 -34.15 Default mode Temporal_Pole_Mid_L 82 45.64 16.2 -30.02 Default mode Temporal_Pole_Mid_R 83 -68.47 -22.66 -15.74 Default mode Temporal_Inf_L
86 -44.45 -64.64 34.78 Default mode Angular_L 87 -39.05 -74.95 43.72 Default mode Parietal_Inf_L 88 -6.84 -54.9 27.05 Default mode Precuneus_L 89 5.91 -58.82 35.45 Default mode Precuneus_R 90 -11.29 -56.2 15.6 Default mode Precuneus_L 91 -2.94 -48.79 12.87 Default mode Precuneus_L 92 7.94 -48.37 30.57 Default mode Cingulum_Post_R 93 15.12 -63.09 25.98 Default mode Precuneus_R 94 -2.2 -36.68 43.85 Default mode Cingulum_Mid_L 95 10.77 -53.83 17.09 Default mode Precuneus_R 96 52.04 -59.37 35.52 Default mode Angular_R 97 23.33 33.07 47.68 Default mode Frontal_Sup_R
98 -10.09 39.09 52.29 Default mode Frontal_Sup_Medial_L 99 -16.4 28.52 53.05 Default mode Frontal_Sup_L
100 -35.36 19.86 50.8 Default mode Frontal_Mid_L 101 22.11 39.21 38.9 Default mode Frontal_Sup_R 102 12.73 54.87 38.19 Default mode Frontal_Sup_R 103 -10.33 54.63 38.71 Default mode Frontal_Sup_L 104 -19.78 45.07 39.48 Default mode Frontal_Sup_L
105 5.94 54.42 16.18 Default mode Frontal_Sup_Medial_R 106 6.11 63.98 21.96 Default mode Frontal_Sup_Medial_R 107 -7.04 50.82 -1.29 Default mode Cingulum_Ant_L 108 8.8 54.23 3.45 Default mode Frontal_Sup_Medial_R 109 -3.06 44.41 -9.46 Default mode Frontal_Med_Orb_L 110 7.51 42.49 -5.35 Default mode Frontal_Med_Orb_R 111 -11.06 44.62 7.61 Default mode Cingulum_Ant_L 112 -2.06 37.85 36.34 Default mode Frontal_Sup_Medial_L 113 -2.5 41.7 16.05 Default mode Cingulum_Ant_L 114 -20.16 63.65 19.39 Default mode Frontal_Sup_L
117 -55.72 -12.96 -10.24 Default mode Temporal_Mid_L 118 -57.75 -29.7 -3.94 Default mode Temporal_Mid_L 119 64.8 -30.55 -8.7 Default mode Temporal_Mid_R 120 -68.3 -41.41 -5.14 Default mode Temporal_Mid_L 121 13.08 29.99 58.65 Default mode Frontal_Sup_R 122 12.25 35.63 20.3 Default mode Cingulum_Ant_R 123 52.16 -2.43 -16.4 Default mode Temporal_Mid_R 124 -26.44 -39.95 -8.26 Default mode ParaHippocampal_L 125 26.94 -37.34 -12.76 Default mode Fusiform_R
126 -33.93 -38.06 -15.6 Default mode Fusiform_L
128 51.9 6.81 -29.61 Default mode Temporal_Pole_Mid_R 129 -52.89 2.55 -27.06 Default mode Temporal_Mid_L 130 46.68 -50.08 28.76 Default mode Angular_R 131 -49.3 -42.15 0.83 Default mode Temporal_Mid_L 137 -46.17 31.26 -13.03 Default mode Frontal_Inf_Orb_L 139 49.26 35.47 -12.2 Default mode Frontal_Inf_Orb_R 203 10.51 -38.54 50.02 Salience Cingulum_Mid_R 204 55.27 -44.59 36.7 Salience SupraMarginal_R 205 42.05 -0.39 47.1 Salience Precentral_R 206 31.24 32.79 26.39 Salience Frontal_Mid_R 207 47.6 22.16 9.74 Salience Frontal_Inf_Tri_R 208 -35.44 20.03 0.07 Salience Insula_L
209 35.91 21.91 2.62 Salience Insula_R
210 36.89 32.35 -2.24 Salience Frontal_Inf_Orb_R 211 33.56 16.45 -7.58 Salience Insula_R
234 8.62 -3.57 5.76 Subcortical Thalamus_R
Table 2.
Mean and Standard Deviations for Functional Network Connectivity Values During Stimulus Presentation
DMN Within-Network
Connectivity
Salience Within-Network
Connectivity
Subcortical Within-Network
Connectivity
Between-Network Connectivity
Healthy Controls 0.185 (0.059) 0.198 (0.066) 0.245 (0.090) 0.121 (0.066) First-Degree
Relatives
0.220 (0.087) 0.250 (0.117) 0.314 (0.112) 0.177 (0.089)
Note. The above table presents the mean and standard deviations (in parentheses) for outcomes for healthy controls and first-degree relatives of individuals with schizophrenia. Bolded outcome variables indicate significance at the level a = 0.05. Italicized values indicate trending or
Table 3.
Mean and Standard Deviations for Functional Network Connectivity Values During Feedback
DMN Within-Network
Connectivity
Salience Within-Network
Connectivity
Subcortical Within-Network
Connectivity
Between Network Connectivity Healthy Controls 0.182 (0.051) 0.203 (0.073) 0.246 (0.094) 0.121 (0.066) First-Degree
Relatives
0.217 (0.094) 0.233 (0.091) 0.304 (0.103) 0.169 (0.090)
Figure 5. Mean within and between network functional connectivity values for the default mode network, salience network, and subcortical reward related brain regions during stimulus
Figure 6. Mean within and between network functional connectivity values for the default mode network, salience network, and subcortical reward related brain regions during feedback.