TESIS DOCTORAL
STRUCTURAL ISSUES AND ENERGY EFFICIENCY IN DATA CENTERS
Autor: Jordi Arjona Aroca
Director: Antonio Fern´andez Anta, IMDEA Networks Institute
DEPARTAMENTO DE INGENIER´IA TELEM ´ATICA
PH.D THESIS
STRUCTURAL ISSUES AND ENERGY EFFICIENCY IN DATA CENTERS
Author: Jordi Arjona Aroca
Director: Antonio Fern´andez Anta, IMDEA Networks Institute
DEPARTMENT OF TELEMATIC ENGINEERING
A dissertation submitted in partial fulfillment of the requirements for the degree of Doctor of Philosophy
Prepared by
Jordi Arjona Aroca, Universidad Carlos III de Madrid
Under the advice of
Antonio Fern´andez Anta, IMDEA Networks Institute
Departamento de Ingenier´ıa Telem´atica, Universidad Carlos III de Madrid
Date: February 13th, 2015
Contact: [email protected]
STRUCTURAL ISSUES AND ENERGY EFFICIENCY IN DATA CENTERS
Autor: Jordi Arjona Aroca
Director: Antonio Fern´andez Anta, IMDEA Networks Institute
Firma del tribunal calificador:
Presidente:
Vocal:
Secretario:
Calificaci´on:
I had always thought that pursuing a Ph.D. was a matter of faith. Faith in yourself, in your work and faith in your capabilities. Nothing further from reality. Pursuing a Ph.D. has a lot of those things, but the most important thing is to have people behind you, people who support you and who help you to keep pushing.
There is a lot of people without whom this thesis would have been simply impossible. I want to start by thanking the IMDEA Networks Institute. To me it has been like an oasis in the desert, the way of doing a Ph.D. in the way a Ph.D. is done abroad without leaving Spain. It seems to me that doing it in any other place would have been definitely worse and much more difficult. Of course, IMDEA Networks is not just an institution, it is also people, and not just workmates but friends. These years would have not been the same without those soccer games, the spam, the cakes in the kitchen or the multilingual happy birthdays. Thanks Juan Camilo (I know you prefer just Camilo, but guess who is writing :)), great flatmate and better person; Ignacio and all his loud voice cursing, H´ector feeding us with nuts; Elli and Evgenia (we love you a bit, only a bit) and our fights for Antonio’s time; Christian, Angelos, Vincenzo, Arash and Allyson, Thomas, Agust´ın, Luisfo, Philippe, Roderick, . . . I am sure I am forgetting someone, but you know you are important to me. Regarding supervisors and other members of IMDEA, I cannot forget Vincenzo Mancuso and all the times I have knocked on his door “d’ya have a sec??” even when he knew it was not going to be a sec. Thanks also to Joel and Jos´e F´elix for your patience when we were just inventing how to do things. Thanks also to Joerg, Rade, Pierre, Brian, Flora. . . everyone.
I want to specially thank Lin Wang for being my bodyguard during my six months in Beijing, he did not have to fight for me but he was always there. Moreover, he proved himself as a great companion both at work and at leisure. Thanks Lin, you have a big share of merit in this thesis.
Although they will say they have not done anything I want to say in loud voice how proud I am of my parents, Antonio and Mari Rosa, who always supported me and my sister, gave us education, thanks to which I am writing these lines today, and backed and encourage us when we had to go far from them or abroad, because they knew it was the best for us. Thanks Dad and Mum. And also thanks to Silvia, my sister, because she has always been there, although I did not visit her in Germany and she came to China and India.
Talking about faith again, I have to talk about my supervisor, auxiliar father, friend, . . . He always had faith in me (or so he said :)). Thanks for pushing, for being a lighthouse in the dark.
I have already told you but I probably would have never chosen you if it had been my call when I joined IMDEA. It proves how stupid I was and shows that I have learnt something, if I were to choose now I would have absolutely no doubt. Thanks Antonio, for everything and for what it is to come.
With the rise of cloud computing, data centers have been called to play a main role in the Internet scenario nowadays. Despite this relevance, they are probably far from their zenith yet due to the ever increasing demand of contents to be stored in and distributed by the cloud, the need of computing power or the larger and larger amounts of data being analyzed by top companies such as Google, Microsoft or Amazon.
However, everything is not always a bed of roses. Having a data center entails two major issues: they are terribly expensive to build, and they consume huge amounts of power being, therefore, terribly expensive to maintain. For this reason, cutting down the cost of building and increasing the energy efficiency (and hence reducing the carbon footprint) of data centers has been one of the hottest research topics during the last years. In this thesis we propose different techniques that can have an impact in both the building and the maintenance costs of data centers of any size, from small scale to large flagship data centers.
The first part of the thesis is devoted to structural issues. We start by analyzing the bisection (band)width of a topology, of product graphs in particular, a useful parameter to compare and choose among different data center topologies. In that same part we describe the problem of deploying the servers in a data center as a Multidimensional Arrangement Problem (MAP) and propose a heuristic to reduce the deployment and wiring costs.
We target energy efficiency in data centers in the second part of the thesis. We first propose a method to reduce the energy consumption in the data center network: rate adaptation. Rate adaptation is based on the idea of energy proportionality and aims to consume power on network devices proportionally to the load on their links. Our analysis proves that just using rate adaptation we may achieve average energy savings in the order of a30-40%and up to a60%depending on the network topology.
We continue by characterizing the power requirements of a data center server given that, in order to properly increase the energy efficiency of a data center, we first need to understand how energy is being consumed. We present an exhaustive empirical characterization of the power requirements of multiple components of data center servers, namely, the CPU, the disks, and the network card. To do so, we devise different experiments to stress these components, taking into account the multiple available frequencies as well as the fact that we are working with multicore servers. In these experiments, we measure their energy consumption and identify their optimal
operational points. Our study proves that the curve that defines the minimal power consumption of the CPU, as a function of the load in Active Cycles Per Second (ACPS), is neither concave nor purely convex. Moreover, it definitively has a superlinear dependence on the load. We also validate the accuracy of the model derived from our characterization by running different Hadoop applications in diverse scenarios obtaining an error below4.1%on average.
Acknowledgements xi
Abstract xiii
Table of Contents xv
List of Tables xvii
List of Figures xix
I Background 1
1 Introduction 3
1.1 Structural Issues . . . 6
1.2 Understanding and Reducing Energy Consumption in Data Centers . . . 7
1.2.1 Rate Adaptation for Future Data Centers . . . 7
1.2.2 How Servers Use Power . . . 8
1.2.3 Speed Scaling Based Techniques . . . 9
1.2.4 Virtualization Based Techniques . . . 10
1.3 Overview and Summary of Contributions . . . 11
1.4 Roadmap . . . 14
2 Related Work 17 2.1 Bisection Width and Bisection Bandwidth of Product Networks . . . 17
2.1.1 Background . . . 17
2.1.2 Related Work . . . 18
2.2 A Simulated Annealing Approach to the Multidimensional Arrangement Problem 19 2.2.1 Background . . . 19
2.2.2 Related Work . . . 20
2.3 Rate Adaptation and Green Data Center Networking . . . 21
2.3.2 Related Work . . . 23
2.4 Characterizing the Energy Consumption of Data Center Servers . . . 24
2.4.1 Background . . . 24
2.4.2 Related Work . . . 25
2.5 Power Aware Assignment of Virtual Machines to Physical Machines . . . 27
2.5.1 Background . . . 27
2.5.2 Related Work . . . 29
II Structural Issues 33 3 Bisection Width and Bisection Bandwidth of Product Networks 35 3.1 Overview . . . 35
3.2 Definitions . . . 36
3.2.1 Graphs and Bisections . . . 36
3.2.2 Factor and Product Graphs . . . 37
3.2.3 Boundaries and Partitions . . . 38
3.3 Bounds on the BW of Product Graphs . . . 39
3.3.1 Lower Bound . . . 39
3.3.2 Upper Bound . . . 41
3.4 BW of Products of CBTs and Paths . . . 42
3.4.1 Factor and Product Graphs . . . 42
3.4.2 Congestion and Central Cut of Paths and CBTs . . . 43
3.4.3 Bounds on the BW of Products of CBTs and Paths . . . 44
3.5 Products of Rings and Extended Trees . . . 45
3.5.1 Factor and Product Graphs . . . 45
3.5.2 Congestion and Central Cut of Rings and XTs . . . 46
3.5.3 Bounds on the BW of Products of XTs and Rings . . . 48
3.6 BCube . . . 48
3.6.1 Factor and Product Graphs . . . 49
3.6.2 Congestion and Central Cut of BCube . . . 50
3.6.3 Bounds on the BBW of BCube . . . 51
3.7 Conclusions . . . 53
4 Reducing Wiring in Data Centers. A Simulated Annealing Approach 55 4.1 Overview . . . 55
4.2 The Algorithm JAM . . . 56
4.2.1 Notation . . . 56
4.2.2 Overview of JAM . . . 57
4.3 Evaluation of JAM . . . 62
4.3.1 Numerical Results . . . 67
4.4 Conclusions . . . 67
III Understanding and Reducing Energy Consumption in Data Centers 69 5 Incorporating Rate Adaptation to Green Networking 71 5.1 Overview . . . 71
5.2 Problem Description . . . 72
5.2.1 Basic Assumptions . . . 72
5.2.2 Modeling . . . 72
5.3 Approximation . . . 74
5.3.1 Relaxations . . . 74
5.3.2 Roundings . . . 76
5.4 Evaluation . . . 77
5.4.1 Experimental Settings . . . 77
5.4.2 Interpolation Error . . . 79
5.4.3 Approximation Ratio . . . 80
5.4.4 Potential Energy Savings . . . 80
5.4.5 Delay Stretch . . . 81
5.5 Conclusions . . . 83
6 Analysis of the Energy Consumption of Data Center Servers 85 6.1 Overview . . . 85
6.2 Methodology . . . 87
6.2.1 Collecting System Data and Fixing Frequency Parameters . . . 87
6.2.2 CPU . . . 88
6.2.3 Disks . . . 89
6.2.4 Network . . . 89
6.3 Measurements . . . 90
6.3.1 Devices and Setup . . . 90
6.3.2 Baseline and CPU . . . 91
6.3.3 Disks . . . 97
6.3.4 Network . . . 98
6.4 Estimating Energy Consumption . . . 100
6.4.1 Energy Estimation Hypothesis . . . 103
6.4.2 Applications and Scenarios for Validation . . . 105
6.4.3 Experiments and Observed Results . . . 106
6.6 Conclusions . . . 114
7 Efficient Assignment of Virtual Machines to Physical Machines 115 7.1 Overview . . . 115
7.2 Preliminaries . . . 116
7.3 Offline Analysis . . . 119
7.3.1 NP-hardness . . . 119
7.3.2 The(·, m)-VMA and(·,·)-VMA Problems Have PTAS . . . 120
7.3.3 Bounds on the Approximability of the(C,·)-VMA Problem . . . 121
7.4 Online Analysis . . . 125
7.4.1 Lower Bounds . . . 125
7.4.2 Upper Bounds . . . 130
7.5 Experimental Evaluation . . . 139
7.5.1 Experimental Setup . . . 139
7.5.2 Experimental Results for(·, m)-VMA . . . 141
7.5.3 Experimental Results for(C, m)-VMA . . . 147
7.6 Discussion . . . 157
7.7 Conclusions . . . 158
8 Conclusions 159 8.1 Future Work and Open Problems . . . 161
1.1 Classification of Data Center types according to their size. . . 6
1.2 Relation between frequency and voltage for different processors . . . 10
2.1 Effective theoretical data rate of InfiniBand . . . 23
3.1 Bisection bandwidth of different product networks . . . 36
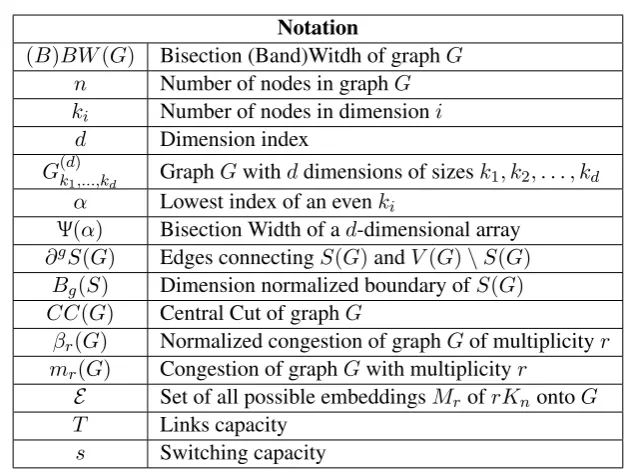
3.2 Basic notation in Chapter 3. . . 39
3.3 Gap between bounds (results in Gbps) . . . 53
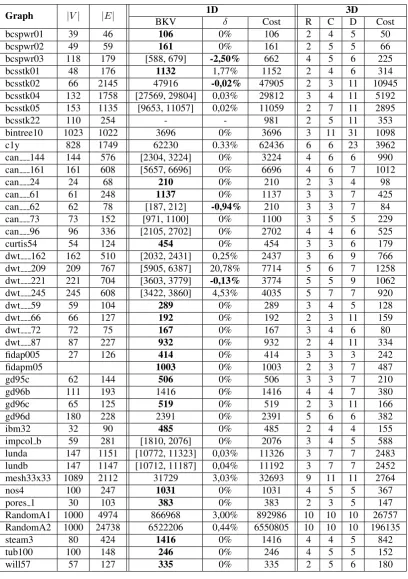
4.1 Results for the minLA benchmark instances with1&3dimensions . . . 63
4.2 Results for the minLA benchmark instances with2dimensions . . . 64
4.3 Results for the QAPlib benchmark instances with1&3dimensions . . . 65
4.4 Results for the QAPlib benchmark instances with2dimensions . . . 66
4.5 Parameters used depending on the number of edges of the graph . . . 67
5.1 Main parameters for the three topologies . . . 78
6.1 Characteristics of the servers under study . . . 90
6.2 Error measured in the different cases of theConnected Serverscenario. . . 108
7.1 Summary of bounds on the approximation/competitive ratioρ. All lower bounds are existential. The number of PMs in an optimal(C,·)-VMA solution is denoted asm∗. The number of PMs in an optimal Bin Packing solution is denoted asm. The load that minimizes the ratio power consumption against load is denoted as x∗. The subset of VMs with load smaller thanx∗is denoted asDs. . . 117
7.2 Summary of bounds on the approximation/competitive ratioρforα = 3,b = 2, andC = 2on the left andC = 1on the right.. All lower bounds are existential. The number of PMs in an optimal (C,·)-VMA solution is denoted asm∗. The number of PMs in an optimal Bin Packing solution is denoted asm. The load that minimizes the ratio power consumption against load is denoted asx∗. The subset of VMs with load smaller thanx∗is denoted asDs. . . 118
1.1 Worldwide use phase electricity consumption of data centers from2005to2012
and the total worldwide electricity use from2008to2012. Data center consum-ption is shown as the aggregation of its main consumers, servers, storage, com-munication and infrastructure. . . 4 1.2 Evolution of the breakdown of a data center energy consumption and a hardware
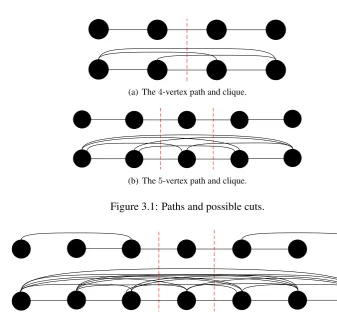
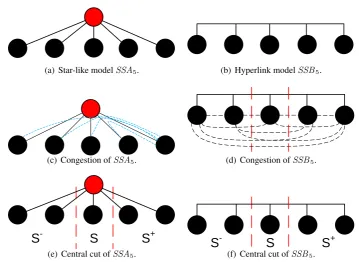
system between 2007-2013. . . 5 3.1 Paths and possible cuts. . . 44 3.2 The7-vertex complete binary tree and the7-vertex clique, with their possible cuts. 44 3.3 Rings and possible cuts. . . 47 3.4 Central cut on a extended complete binary tree. . . 47 3.5 Proposed models for a 5-node switched star,SS5, their congestion and central cut. 50
3.6 Cartesian product of twoSSA5networks. . . 51
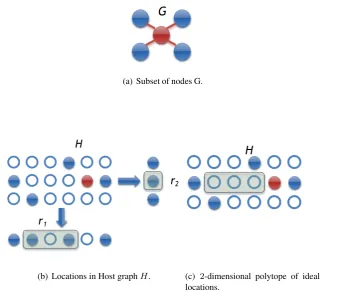
4.1 Flow diagram of JAM. . . 57 4.2 Example of a possible evolution for the multidimensional McAllister allocation
heuristic in2dimensions. The allocated nodes are represented in blue, the nodes belonging to the front in yellow. . . 59 4.3 Example of JAM neighboring function in2dimensions. . . 61 5.1 The synthetic power functionf(·)and the convex alternativeg(·)obtained by the
proposed interpolation. . . 78 5.2 Simulation results for testing (a) the interpolation error and (b) the approximation
ratio of the proposed algorithm based on two topologies:4-ary and20-ary FatTree. 79 5.3 Simulation results for testing the energy saving efficiency using synthetic network
conditions based on three different topologies: FatTree, BCube and DCell. . . 81 5.4 Simulation results for testing the energy saving efficiency using real network
traces based on three different topologies: FatTree, BCube and DCell. . . 82 5.5 The average number of hops for routing each demand under (a) the synthetic
6.1 Power consumption of3servers (Survivor,Nemesis, andErdos) for base-line and CPU characterization experiments. . . 93 6.2 CPU performance bounds ofNemesis. . . 94 6.3 CPU performance bounds ofSurvivor. . . 95 6.4 CPU performance bounds ofErdos. . . 96 6.5 Instantaneous power consumption for reading/writing operations. Results are
pre-sented for every frequency and for4different block sizes for each one of our servers. 99 6.6 Disk reading and writing efficiencies forErdos(red dotted lines) andNemesis
(blue solid lines). . . 100 6.7 Network efficiencies for Survivor under different frequencies and64-B and
1470-B packets. . . 101 6.8 Network efficiencies for Nemesis under different frequencies and 64-B and
1470-B packets. . . 102 6.9 Network efficiencies forErdosunder different frequencies and64-B and1470-B
packets. . . 103 6.10 Power utilization with network activity forErdos, NemesisandSurvivor
(64-B experiments were run with a transmission rateR = 150Mbps, whileR= 400Mbpsfor the experiments with1470-B packets). . . 104 6.11 Energy consumption ofNemesisin the Isolated Server scenario. . . 108 6.12 Energy consumption ofNemesis running PageRank in the Connected Server
scenario, with either small or big packets. . . 109 6.13 Energy consumption ofNemesisrunning WordCount in the Connected Server
scenario, with either small or big packets. . . 110 6.14 Distribution of the sizes of the packets exchanged between Nemesis and
Survivorfor both PageRank and WordCount in the Cloud scenario. . . 111 6.15 Energy consumption ofNemesisandSurvivorin the Cloud scenario. . . 112 7.1 VM load distributions used in the evaluations. . . 141 7.2 (·, m)-VMA: Comparing the power consumed by VMA1 and VMA2 with the
lower bound LBVMA for x∗ = {30,300} GCPS, α = {1.5,2.5} and λ =
{10,100}GCPS for Trace A (Synthetic traces). . . 143 7.3 (·, m)-VMA: Comparing the power consumed by VMA1 and VMA2 with the
lower bound LBVMA for x∗ = {30,300} GCPS, α = {1.5,2.5} and λ =
{10,100}GCPS for Trace B (Google traces). . . 144 7.4 (·, m)-VMA: Comparing the power consumed by the different assignment
7.5 (·, m)-VMA: Comparing the power consumed by the different assignment algo-rithms for x∗ = 30 GCPS, α = 2and λ = {10,30,100} GCPS for Trace B (Google traces). . . 146 7.6 (·, m)-VMA: Comparing the power consumed by the different assignment
al-gorithms for λ = 30 GCPS, α = 2 and increasing values of x∗ for Trace A (Synthetic traces). . . 148 7.7 (·, m)-VMA: Comparing the power consumed by the different assignment
algo-rithms forλ= 30GCPS,α= 2and increasing values ofx∗for Trace B (Google traces). . . 149 7.8 (C, m)-VMA: Comparing the power consumed by VMA1 and VMA2 with the
lower boundLBVMAforx∗ ={0.65,0.9} ·C,C = 153.6GCPS,α={1.5,2.5}
for Trace A (synthetic traces). . . 151 7.9 (C, m)-VMA: Comparing the power consumed by VMA1 and VMA2 with the
lower boundLBVMAforx∗ ={0.65,0.9} ·C,C = 153.6GCPS,α={1.5,2.5}
for Trace B (Google traces). . . 152 7.10 (C, m)-VMA: Comparing the power consumed by the different assignment
al-gorithms for C = 11.2 GCPS, α = 2 and different values of x∗ for Trace A (Synthetic traces). . . 153 7.11 (C, m)-VMA: Comparing the power consumed by the different assignment
algo-rithms forC= 11.2GCPS,α= 2and different values ofx∗for Trace B (Google traces). . . 154 7.12 (C, m)-VMA: Comparing the power consumed by the different assignment
al-gorithms fixing forC = 41.6GCPS,α = 2 and2 different values ofx∗ while varyingbfor Trace A (Synthetic traces). . . 155 7.13 (C, m)-VMA: Comparing the power consumed by the different assignment
Background
Introduction
Internet has revolutionized our world. In15 years it has passed from being hardly found in any home to be hardly not found in any pocket. We have become Internet-addicts and got used to continuously check our emails, videos, photos,. . . Through Google, Facebook, Twitter, we learn about what is happening with our friends or in any remote corner of the world, we are able to contrast news, we have access to any kind of information we are curious about. At the same time, Internet has also overturned the business world, simplifying and reducing the costs of sharing information in and between companies, and allowing any company, no matter how small it is, to have customers all over the world.
This has become real thanks to new concepts like the Internet of things, social networks, or cloud computing. However, at the end of the day, what Internet has done is putting huge amounts of data available to everyone. One of the keys of this availability of data has been the proliferation of data centers. Although some data centers are not necessarily large, like the ones usually deployed at many universities, companies or government institutions, large companies such as Google, Facebook, Amazon or Microsoft, among others, are building large scale data centers all over the world.
A large scale data center can be defined, in a nutshell, as an integrated facility housing a large amount of high end servers, up to the order of tens of thousands, interconnected by a dense network, hosting petabytes of data and consuming up to various tens of mega Watts. According to Belady [31], the building costs of a data center is between$8M-$30M/MW, being the average around$20M/MW, depending on the kind of facility. These numbers lead to costs of$100−150M for small/mid size facilities, while huge data centers, like Facebook’s or Google’s, can be in the order of$600M.
However, although building a data center is expensive, they can be even more expensive to maintain. As we noted above, their average power consumption can be around20MW per year, which unveils a second problem, their energy consumption. In a recent study, Van Heddeghemet al.[86] estimate that, between 2005 and 2012, worldwide aggregated data center energy consum-ption increased almost a50%, reaching270TWh from the previous200TWh. This is roughly a
Figure 1.1: Worldwide use phase electricity consumption of data centers from2005to2012and the total worldwide electricity use from2008to2012. Data center consumption is shown as the aggregation of its main consumers, servers, storage, communication and infrastructure.
1.5%of the total worldwide electricity consumption, and with a compound annual growth rate of a4.4%.
Therefore, it is easy to see whygreeningdata centers has emerged as one of the main targets of the research community during the last years. Greeningdata centers has, in fact, a two-fold objective, reducing operation costs, i.e., saving money; and improving data center sustainability, i.e., reducing the amount of energy consumption attributed to data centers. In the same way, efficiency of several data center components, for instance cooling systems, may lead to a reduction on the building costs.
Data center research has become a broad field of research. Even when we restrain ourselves to reducing building cost or increasing energy efficiency, the complexity and variety of subsystems that can be found in a data center result in a huge amount of particular problems. Even if we restrain ourselves to two topics like optimizing the structural costs and increasing the energy efficiency of the different data center subsystems, the body of related work is overwhelming. In fact, if we look at some data provided by Barroso et al. [27, 28] we can see how the research in the field has contributed to change the energy consumption breakdown of data centers. In Figure 1.2 we can find the energy consumption breakdowns of a legacy data center with a PUE1 value of around2.0in2009and2013, in subfigures 1.2(a) and 1.2(b) respectively. Similarly, in subfigures 1.2(c) and 1.2(d), we can also see the evolution on the distribution of peak power usage
1PUE responds to
23% 30% 12% 33% 2% UPS/PDU IT Equipment CRAC Chiller Ancillary
(a) Typical distribution of energy usage in a conventional datacenter with a PUE of 2.0 - 2009
10% 50% 12% 25% 3% UPS/PDU IT Equipment CRAC Chiller Ancillary
(b) Typical distribution of energy usage in a conventional datacenter with a PUE of 2.0 - 2013
33% 30% 10% 5% 22% CPUs DRAM HDD Networking Other
(c) Approximate distribution of peak power usage in a hardware subsystem in a Google’s data center in 2007.
42% 12% 14% 5% 4% 8% 15% CPUs DRAM HDD Networking Misc. Power Overhead Cooling Overhead
(d) Approximate distribution of peak power usage in a hardware subsystem in a Google’s data center in 2012.
Figure 1.2: Evolution of the breakdown of a data center energy consumption and a hardware system between 2007-2013.
in a hardware subsystem in a Google’s data center between2007and2012. This evolution is the result of intense research in multiple fields concerning each one of the pieces of hardware, usage policies or interaction between them.
Table 1.1: Classification of Data Center types according to their size.
Server Closet
Server Room Localized Data Center
Mid-Tier Data Center
Enterprise Class Data Center Size [sq ft] <200 <500 <1.000 <5.000 >5.000
# Servers (2005) 1.657.947 1.942.214 1.674.648 1.511.999 3.074.424
Estimated Energy consumption 11% 24% 21% 19% 24%
# Servers (est. 2009) 2.135.538 3.057.834 2.107.592 1.869.595 3.604.678
Moreover, although a bit outdated, Bayleyet al.[22], in 2007, presented a study quantify-ing the amount of servers in different facilities accordquantify-ing to their size. Some of the results of that study are presented in Table 1.1, showing the different categories, the estimated number of servers per category in2005as well as the distribution of energy consumption among them, and a prediction of the evolution of these numbers for2009. These numbers show how most of the energy consumed is not necessarily in large enterprise data centers, but in smaller environments in which, in most cases, the PUE does not match the ones achieved by Facebook’s or Google’s flag-ship data centers. Nevertheless, it is important to remark that industry has become aware of this problem and more and more solutions are being provided each day to companies that only need small sized data centers, like Modular or Containerized Data Centers [9, 160] or integrated box solutions like IBM’s Integrated Server Room [91]. In addition to this, Containerized Data Centers could even help to reduce the building costs of large data centers avoiding over built capacity and helping with over time scalability [152].
This thesis is divided in two parts, apart from the Background itself, one for each of the main topics that comprehend the different problems we addressed, these parts are Structural Issues and Understanding and Reducing Energy Consumption in Data Centers. This study intends to help to a better understanding of how energy is consumed in data centers as well as providing solutions which can be applied to data centers in any size range, from server closets to large enterprise data centers. We know provide some insights about what will be covered in these parts.
1.1
Structural Issues
One structural problem of data centers is the need of hosting more and more servers. Some traditional interconnection networks, such as meshes, toruses or grids were not an option given their poor scalability. More structured topologies, like trees or tree-like topologies also showed drawbacks that made difficult to scale them up. For instance, the number of ports per switch required by tree topologies was continuously increasing and so their price. At the same time, given its low bisection bandwidth, the upper tiers were easily congested even when the traffic at lower layers was rather low. Proposing new and better topologies capable to solve these problems became necessary.
bi-section bandwidth. The benefits of using fat-trees led to multiple proposals like VL2 [78] or [131]. However, fat-trees also have some limitations when scaling up, and might end up depending also on large switches. For these reasons, new topology proposals tried to overcome fat-tree by presenting several improvements over it. Two of the most sound proposals were Dcell [80] and BCube [79]. These topologies were able to provide a larger number of redundant paths, reducing the congestion in the network, and better fault tolerance with similar price and energy consumption.
This first stage of studies about data center topologies had several benefits. First, and most obvious, meant an improvement over the existing topologies, allowing better scalability at sim-ilar or lower price, more resilient and less congested networks, helping to gather a broad set of parameters and metrics to compare the goodness of the different topologies. . . Also, it indirectly paved the way for a second wave of works which tackled the problem of energy consumption in data centers, taking advantage of the flexibility and goodnesses of these works.
We will deal with two problems in the context of structural issues. The first one is related to the set of parameters used to compare different network topologies. Two of these parameters, bisection width and bisection bandwidth, are broadly used to measure reliability and bandwidth of networks. We study these parameters for topologies which are, or can be, obtained from as product networks from smaller factor graphs. The second one is related to how the topologies are to be deployed in data centers. All the topologies that we have mentioned in this section share being more complex than most of traditional topologies. With our work we intend reducing the total wiring to be deployed to interconnect the different devices in a data center as well as reducing the average lengths of wires, what leads to less power leakages due to the inherent wire resistance as well as reducing latency.
1.2
Understanding and Reducing Energy Consumption in Data
Centers
As we have already mentioned, improving the energy efficiency of data centers has become an issue of capital importance both for economic and of environmental reasons. Due to this importance, the amount of techniques that have been proposed to help in this area is so huge that it is impossible to present them in just one document. Hence, we now only introduce some of the techniques which are relevant for this thesis.
1.2.1 Rate Adaptation for Future Data Centers
particular, they propose controllers that can dynamically adjust the network structure depending on the amount of traffic. The result is a network were the number of available paths and active links and switches depends directly on the present load. These network controllers claim to be capable to save up to a50%of the network energy costs of the networks they are based in.
Approaches like Elastic Tree and PCube rely in power-down strategies, i.e., switching off routing (switching) devices that are not needed if the traffic routing is optimized and the number of active paths in the network is adapted to the current load. One different and alternative approach is based on rate adaptation.
Rate adaptation was proposed by Nordman and Christensen [133] in 2005. Rate adaptation aims to achieve energy proportionality in the network by adapting the transmission rate of the network devices to the load present in their links. By doing this, the power consumption in the devices should be proportionally reduced and, hence, large energy savings could be achieved when the load in the links is low. Data center networks are known to have a very low average load, being quite low at least60%of the time and experiencing traffic bursts during less that a
5%. Therefore, the savings in data center networks could be considerable.
However, although this technique has been widely studied, only in the very last years we have started to see devices that provide these capacities, such as InfiniBand [4] or the Cray Yarc [145] switch, which were some of the first switches to allow multiple speeds on their links and hence to start adapting their consumption to the associated link load. Nevertheless, there are still several limitations and problems that are expected to be solved by future devices.
One of the problems that we will discuss in this thesis is how, with the right network devices, rate adaption could be introduced in networking and in data centers, reducing the energy costs of data center networks.
1.2.2 How Servers Use Power
Servers are like puzzles where each one of its pieces has its own share of power consumption. At the same time, the global power consumption of a each one of these pieces is not constant, it depends on the stress we introduce in each one of them. Depending on the amount of accesses we do to disk, to memory, on the amount of data we send to or receive from the network and on the amount of processing we do or the heat we generate, the power required by Hard Drives, Memory, Network, CPU or cooling units will vary. There are also more components, as we saw in Figure 1.2, but those are usually assumed to be the major contributors to the power consumption of data center servers.
re-sults from the last quarter of2007against the last available ones (second quarter of2014), we can see a reduction on the power consumption of servers when idle compared to its peak consumption from barely a60%in most servers to roughly a20−25%of power consumption.
If we consider only the active range, i.e., the power variation between the idle state and the peak consumption, it has been traditionally assumed that most of the power is consumed by the CPU. Similarly to what happens with servers, processors do not consume power linearly, in proportion to the load. Although processor power consumption has usually been modeled in a linear fashion, everything changed with the arrival of multicore processors able to work at multiple frequencies. Multicore processors introduced multiple changes. First, cpus in the same processor are able to share on-chip and on-die resources, increasing,hence, the synergies and reducing power requirements [30]. Also, there are new parameters to be considered as variable voltages and frequencies that determine CPU speed and, therefore, power requirements. Due to this new complexity, being able to understand how servers consume power has become a must if we want to devise any technique or strategy that intends to reduce power or energy consumption. In this thesis, we will present an empirical study were some of these aspects were analyzed and we were able to shed some light about the behavior of multicore and multifrequency machines based on real data. This knowledge can be applied in multiple techniques devoted to reduce the aggregated power and energy consumption of data centers. Not understanding the effect that placing a task in a server is going to have on its power consumption will result in non-optimal, in the best case, or in completely non-efficient, in the worst case, implementations of techniques such as speed scaling policies or virtualization strategies. We will now discuss about the latter two practices, speed scaling and virtualization, which are well known examples of techniques used to reduce the aggregated power and energy consumption in data centers.
1.2.3 Speed Scaling Based Techniques
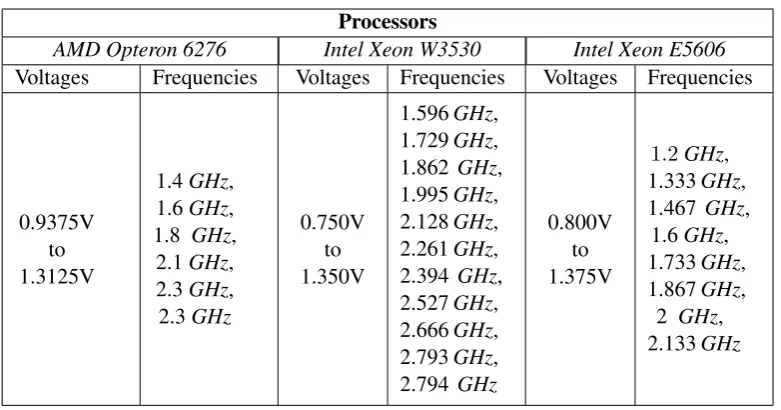
Speed scaling is based on the ability of a processor to change its operating voltage and speed (frequency), and hence the speed and power consumption of the server. It is important to note that the values of voltage and frequency are not independent from one another. There is an intimate relation between them as, usually, the voltage conditions the range of available frequencies. In Table 1.2 we can find the different combinations of frequencies and voltages available for different processors.
One well known and extended implementation of speed scaling isDynamic Voltage and Fre-quency Scaling (DVFS)which can be usually be found in the ample majority of servers which can be found nowadays in the market. DVFS can be configured with different governors or operating policies which will condition the way frequency adapts to the load in the system.
Table 1.2: Relation between frequency and voltage for different processors Processors
AMD Opteron 6276 Intel Xeon W3530 Intel Xeon E5606 Voltages Frequencies Voltages Frequencies Voltages Frequencies
0.9375V to 1.3125V 1.4GHz, 1.6GHz, 1.8 GHz, 2.1GHz, 2.3GHz, 2.3GHz 0.750V to 1.350V 1.596GHz, 1.729GHz, 1.862 GHz, 1.995GHz, 2.128GHz, 2.261GHz, 2.394 GHz, 2.527GHz, 2.666GHz, 2.793GHz, 2.794 GHz 0.800V to 1.375V
1.2GHz, 1.333GHz, 1.467 GHz, 1.6GHz, 1.733GHz, 1.867GHz, 2 GHz, 2.133GHz
Most of the research in this field is devoted to find efficient policies which allow to reduce power consumption or energy consumption. It is important to remark the difference between both targets, let us give an easy example. Assume that we have a task that needs a timeT to complete. If we reduce the operating frequency of the system, and hence the power consumption is reduced fromCtoC0, it might happen that the task being run in our machine now needs a timeT0 to be run. If the total energy consumed T ·C is larger thanT0 ·C0 we will have reduced the power consumption during a period of time, but spent more energy. This is neither good nor bad, both policies have their applications in different scenarios. However, we must remember that it is not trivial to optimize the power required and it is needed to carefully design the policies to be used.
1.2.4 Virtualization Based Techniques
partition-ing or aggregation, partial or complete machine simulation, emulation, time-sharpartition-ing, and many others” [51]. We call each one of these operating environments aVirtual Machine (VM). Hence, instead of running tasks in a per server basis or use multithreading sharing the resources pool, virtualization allows us to run tasks in a per VM basis, therefore running multiple tasks (with limited resources) independently in the same server.
Nevertheless, virtualization only opened the door for future improvements in how to reduce the power consumption of data centers from a server perspective. Two of these consequences were consolidation and virtual machine allocation techniques.
Consolidation is probably the most straightforward consequence of virtualization. Since we gained the ability of putting multiple virtual machines in one server it is logic trying to maximize the efficiency of servers. Consolidation aims to either maximize the aggregated number of tasks being run keeping a constant number of active servers, or minimize the number of servers needed to run a set of tasks. In both cases, the contribution of virtualization to increase the productivity and the energy efficiency of data centers is clear.
Similarly, and intimately related with consolidation, we have virtual machine allocation tech-niques. Given that the assignment of virtual machines to servers is an NP-hard problem (it can be easily reduced to problems such as bin packing or 3-partition for instance, as we will see in Chapter 7), multiple heuristics and algorithms have been devised to tackle the online version of the problem. Algorithms like First Fit, Packing, Most (Least) Loaded First . . . try to obtain the best assignment of tasks to servers according to a certain magnitude, like cost, energy consum-ption. . . although in general try to minimize the number of active servers.
However, most of these algorithms are based on linear models for the power consumption of cores. Based on the insights we got with the characterization of a data center server we will study the effect of assuming a non-linear power consumption model for data centers servers. Based on this model, we will perform a competitive analysis of different VM to physical machine power aware assignment strategies under different hypothesis, like the capacity or the number of available physical machines. We will propose our own strategies and compare their power and energy consumption with the ones of some of the aforementioned algorithms (first fit, packing. . . ).
1.3
Overview and Summary of Contributions
In the previous section we have enumerated several problems and challenges related to data centers. However, although each one of them are broad research topics, they are only a small subset of the challenging problems that are to be solved in such an ecosystem. We know present the problems in which we worked and the contributions we made for each one of them.
another. Similarly, we found that many topologies, old and new, could be seen as a product graph, i.e., as the result of combining smaller graphs with the Cartesian product operation. Inspired by the need of a solution for the bisection width of the multidimensional tori, which was posed by Leighton [105, Problem1.281] and had remained as an open problem for more than20 years, we devised a technique to lower and upper bound the bisection width of product graphs. This technique can be successfully applied to many classical interconnection networks obtained by the application of the Cartesian product of graphs to obtain an exact result for their bisection width and bisection bandwidth. Using this technique we obtained an exact result for both the bisection width and bandwidth of the multidimensional tori, products of extended complete binary trees [65] and rings, and products of mesh connected trees (a.k.a. products of complete binary trees), and paths. Moreover, we show that our technique can also be applied to newly devised and more complex topologies, such as BCube, for which we obtain bounded results for its bisection width and bisection bandwidth.
The second problem we tackled is related to the increasing complexity of most of the lately proposed data center topologies. This is partially due to the need of placing more and more nodes, partially because of the implementation of properties that improve different aspects of the network. Obviously, these networks need to be deployed and this deployment is not trivial. A suboptimal deployment leads to an excess in the associated costs and a worse performance. This excess in the costs is represented, for instance, by deploying extra wiring. Having extra wiring results in more costs in buying the wires, more consumption due to the losses associated to the extra length of the wires, augmented latency (this aspect might seem irrelevant, but there are environments where nanoseconds matter, like in high frequency trading [36, 52]), or simply by having a more complex wiring scheme which is more costly to maintain. Given that a data center network is basically a graph which consists of servers and interconnection devices, and that the set of racks in a data center can be seen as a3-dimensional array, the problem of allocating the servers of a data center into its racks can be seen as an instance of theMultidimensional Arrangement Problem (MAP)[85], which is NP-hard. To solve this problem, we have devised JAM, a Tabu-based two-stage simulated annealing algorithm for the MAP. This algorithm is able to match or approximate most of the best and optimal solutions from a set of81benchmark instances taken from the minimum Linear Arrangement (minLA) and Quadratic Assignment Problem (QAP) literature. Adapting these instances from their original configuration to 1, 2 or3 dimensions, we have also broadened the available instances for minLA and QAP, as well as created a set of benchmark instances in multiple dimensions for MAP.
Moreover, these savings can be increased by combining our technique with power-down policies, i.e, reducing the number of active network devices if possible.
Our next contribution is related to how energy is spent in physical machines. As we mentioned in Subsection 1.2.3, in order to device wise consolidation algorithms or speed scaling policies for our systems, the first step is to properly understand how power is consumed in our physical ma-chines. With the irruption of multicore servers we find a certain inconsistency in the literature as it is usual to find works that assume linear models of consumption for servers, while some others assume models different from linear (such as superlinear models). To shed some light in this problem, we performed an empirical study with3different servers of different architectures (Intel Xeon and AMD Opteron). Our first contribution was showing that the metric used to express load matters, and, hence, using relative magnitudes, like load percentage, might lead to deceiving results. We introduced the Active Cycles Per Second (ACPS) metric, which is an absolute magni-tude, related to the frequency of operation, and that denotes the amount of computer cycles used to process load by a server per second. Our study analyzed the contribution to the total power con-sumption of three different components of data center servers, namely, CPU, disks, and network, and their dependencies in certain parameters, like the frequency. The most important contribution of this work is showing that the curve that defines the minimal CPU power as a function of the load is neither linear nor purely convex as has been previously assumed. Similarly, we also study the effects of the operating frequency and other parameters in the power consumption of disks and network. We validate our model by means of computing the PageRank metric of a graph and a WordCount application in a Hadoop platform, first without network activity, next with bulky network activity, and finally with a two-server cluster. We find that the energy can be estimated with an error that is below4.1%on average and never worse than a10%.
One of the conclusions of the previous work is that there exists an optimal point of operation distinct from the100%. This means, in simple words, that running a server at full load and full speed, is not always optimal. This also contradicts some statements that have been traditionally assumed to be true regarding how much load has to be processed by a server.
Based on the latter study and the conclusions which can be extracted from it, a question that immediately follows is how to assign virtual machines to physical machines in a power efficient way. Our last contribution consists of an analytical study of what we call the Virtual Machine Assignment (VMA) problem. We study this problem from different points of view, imposing, or not, restrictions on the number of physical machines or on their CPU capacity. Namely, we study
lower bounds on the approximation ratio of the(C,·)-VMA and(C, m)-VMA problems. With respect to the online version of these problems, we prove upper and lower bounds on the compet-itive ratio of the(·,·)-VMA,(C,·)-VMA,(·, m)-VMA, and(C, m)-VMA problems. Finally, we compare our algorithm to a modified version to other real approaches and show its advantages by simulation.
1.4
Roadmap
The rest of the thesis is structured as follows. We start with a Background part, including this Introduction Chapter and Chapter 2, which presents an overview of the state of the art for each one of the problems we have mentioned. The rest of the document in divided into two parts, Part II, Structural Issues, and Part III, Understanding and Reducing Energy Consumption in Data Centers. Part II starts with Chapter 3, a study about how to compute the bisection (band)width of different product networks. Also in this part, we find Chapter 4, which presents the design and application of a simulated annealing heuristic to reduce costs in data centers. Already in Part III, we will start, in Chapter 5, by studying how to reduce energy consumption in data center networks by implementing rate adaptation. Afterwards, we will be presenting a characterization of how energy is consumed in a physical machine by 3of its main components, namely, CPU, disk and network. We will conclude Part III with an analytic study about how virtual machines should be assigned to physical machines in order to reduce the energy consumption in data centers and propose different algorithms tackling this problem. Finally, Chapter 8 concludes this thesis with a summary of our main results, a discussion on the implications of these results and future research directions.
This thesis covers contributions from the following literature:
• Jordi Arjona Arocaand Antonio Fern´andez Anta. “Bisection (Band)Width of Prod-uct Networks with Application to Data Centers”. IEEE Transactions on Parallel and Dis-tributed Systemsin vol. 25, issue 3, March 2014.
• Jordi Arjona Aroca, Antonio Fern´andez Anta. “JAM, A Tabu-based Two-Stage Simulated Annealing for the Multidimensional Arrangement Problem”. Hybrid Meta-heuristics 2014, 155-168.
• Lin Wang, Fa Zhang, Chenying Hou,Jordi Arjona Aroca, Zhiyong Liu. “Incorpo-rating Rate Adaptation into Green Networking for Future Data Centers”. 2013 IEEE 12th International Symposium on Network Computing and Applications, NCA’13, Cambridge, MA, USA, August 22-24, 2013. IEEE 2013.
Servers”. International Conference on Future Energy Systems (ACM e-Energy) 2014, 63-74. June 2014.
• Jordi Arjona Aroca, Antonio Fern´andez Anta, Miguel A. Mosteiro and Christopher Thraves. “Power-efficient Assignment of Virtual Machines to Physical Machines”. Work-shop on Adaptive Resource Management and Scheduling on Cloud Computing (ARMS-CC).
Additionally to the above, the following papers with related content have been published during the development of this thesis:
• Jordi Arjona Aroca, Antonio Fern´andez Anta, Miguel A. Mosteiro and Christopher Thraves. “Power-efficient Assignment of Virtual Machines to Physical Machines”. Ac-cepted for Publication in Future Generation Computer Systems Journal (FGCS), Special issue on “Advanced Topics in Resource Management for Ubiquitous Cloud Computing: an Adaptive Approach”.
• Lin Wang, Fa Zhang, Jordi Arjona Aroca, Athanasios V. Vasilakos, Kai Zheng, Chenying Hou, Dan Li, Zhiyong Liu. “GreenDCN: a General Framework for Achieving Network Energy Efficiency in Data Centers”. IEEE Journal on Selected Areas in Commu-nicationsin vol. 32, no. 1, January 2014.
• Jordi Arjona Aroca, Antonio Fern´andez Anta, Miguel A. Mosteiro and Christopher Thraves. “Power-efficient Assignment of Virtual Machines to Physical Machines”. XXI Jornadas de Concurrencia y Sistemas Distribuidos (JCSD 2013), 19-21 June 2013, San Sebasti ˜A¡n, Spain.
• Jordi Arjona Arocaand Antonio Fern´andez Anta. “Bisection (Band)Width of Prod-uct Networks with Application to Data Centers”. 9th Annual Conference on Theory and Applications of Models of Computation, TAMC 2012, May 16-21, 2012, Beijing, China.
Related Work
2.1
Bisection Width and Bisection Bandwidth of Product Networks
2.1.1 Background
The bisection width and the bisection bandwidth of interconnection networks have always been two important parameters of a network. The first one reflects the smallest number of links which have to be removed to split the network into two equal parts, while the second one bounds the amount of data that can be moved between these parts. In general, both values are derivable one from the other, which is the reason why most previous work has been devoted to only one of then (in particular, the bisection width).
The bisection width has been a typical goodness parameter to evaluate and compare inter-connection networks for parallel architectures [57, 61, 105]. This interest has been transferred to the Network-On-Chip topologies, as the natural successors of the parallel architectures of the 90’s [97, 118, 144, 172]. The bisection (band)width is also nowadays being used as a reference parameter on the analysis of the topologies that are being deployed in data centers. The bisec-tion bandwidth can be used to compare the potential throughput between any two halves of the network in different topologies. Similarly, the bisection width also gives some insights on their fault tolerance, showing the maximum number of critical link errors a network can suffer before being split into two halves. This can be seen in recent papers which propose new topologies, like BCube [79] or DCell [80]. The bisection (band)width is one of the parameters used to com-pare these new topologies with classical topologies, like grids, tori, and hypercubes, or with other datacenter topologies, like trees and fat trees.
Finding the exact value of the bisection width is hard in general. Computing it has proven to be challenging even for very simple families of graphs. For instance, the problem of finding the exact bisection width of the multidimensional torus was posed by Leighton [105, Problem1.281] and has remained open for20 years. One general family of interconnection networks, of which the torus is a subfamily, is the family of product networks. The topology of these networks is ob-tained by combining factor graphs with the Cartesian product operator. This technique allows to
build large networks from the smaller factor networks. Many popular interconnection networks are instances of product networks, like the grid and the hypercube. This, however, is not only a characteristic of classical interconnection networks. Some of the recently proposed data cen-ter topologies also share the property of being constructed by combining basic instances, as the already mentioned Bcube [79] and Dcell [80] or HCN and BCN [81].
Summarizing, in the context of data centers, studying the bisection width and bandwidth of product networks will help us to compare some of the most relevant drawbacks and goodnesses of newly proposed and old topologies, such as their reliability or bandwidth.
2.1.2 Related Work
To our knowledge, Youssef [169,170] was among the first to explore the properties of product networks as a family. He presented the idea of working with product networks as a divide-and-conquer problem, obtaining important properties of a product network in terms of the properties of its factor graphs.
The bisection width of arrays and tori was explored by Dally [58] and Leighton [105] in the early90s, presenting exact results for these networks when the number of nodes per dimension was even. The case when there are odd number of nodes per dimension was left open. Rolimet al.[141] gave the exact values for the bisection width of2and3-dimensional grids and tori, but left open the question for higher number of dimensions.
For the special case in which all the factors are isomorphic, Efe and Fern´andez [64] provided a lower bound on the bisection width of a product graph as a function of a new parameter of a factor network they defined, the maximal congestion. Nakano [127] presented the exact value of the bisection width for the Cartesian product of isomorphic paths and cliques (i.e., square grids and Hamming graphs). If the factor graphs haveknodes, he proved that thed-dimensional square grid has bisection widthkd−1 whenkis even, and ((kkd−−1)1) whenkis odd. Similarly, the square Hamming graph has bisection width kd+1 when kis even, and (k+ 1)(kd4−1) when k is odd. The exact bisection width of thed-dimensional square grid was found independently by Efe and Feng [63].
For Chapter 3, the work of Azizoglu and Egecioglu is very relevant. In [19] and [21] they studied the relationship between the isoperimetric number and the bisection width of different product networks. In the former paper, they find the exact value of the bisection width of the cylinders (products of paths and rings) with even number of nodes in its largest dimension. In the latter reference they found the exact bisection width of thed-dimensional gridA(k1,k2,...,kd)
d, with ki nodes along dimensioni, and wherek1 ≥k2 ≥ . . . ≥kd. The value of this bisection width
isBW(A(k1,k2,...,kd) d) =
Pα
i=1Ci, whereαis the smallest index for whichki is even (α=dif no
index is even), andCi= Qd
2.2
A Simulated Annealing Approach to the Multidimensional
Ar-rangement Problem
2.2.1 Background
Assignment and arrangement problems have been extensively studied for decades. The most classical and wellknown application of these problems is the assignment ofnfacilities tom lo-cations in order to minimize or maximize a certain magnitude, such as cost, flow, etc. In this section, we introduce one of these arrangement problems, the Multidimensional Arrangement Problem (MAP), which was firstly studied by Hansen [85]. MAP covers a great number of appli-cations, such as graph drawing or job scheduling (in 1 dimension), the backboard wiring problem or the arrangement of electronic components in printed circuits (in 2 dimensions), and placing servers in the racks of a data center (in 3 dimensions).
MAP can be defined as follows. Given a graph G = (V, E), a host D-dimensional array H(V0, E0) such that |V0| ≥ |V|, we can define the Multidimensional Arrangement Problem as the embedding of Ginto H, i.e., a mapping of the edges of G to paths inH, such that the aggregated length of the paths inHis minimized. As we will usually work with weighted graphs, the goal of MAP is minimizing the weighted sum of the path lengths. Formally, the cost of an embeddingϕ:V →V0is defined as
C(ϕ) = X
(u,v)∈E
wuv·dist(ϕ(u), ϕ(v)), (2.1)
wherewuvis the weight of edge(u, v)anddist(ϕ(u), ϕ(v))is the Manhattan distance (the path
length) between the images ofuandvin the host graphH.
The particular case ofD= 1is a well known problem, called theminimum linear arrange-ment (minLA). In this problem, the objective is to embed a graph onto a one dimensional array. As minLA is known to be NP-complete and MAP has minLA as a special case, it can be con-cluded that MAP is NP-hard.
On the other side, we have Simulated annealing (SA), a local search based metaheuristic, introduced by Kirkpatrick et al. [99] in 1983. It was inspired in the metallurgical process of annealing, and used to solve combinatorial optimization problems. An SA algorithm is usually described by the following elements: initial solution, neighborhood function, cooling rate, num-ber of iterations per temperature, and stop criteria or final temperature. In a nutshell, SA applied to MAP starts from an initial solution ϕ0; and then, in each iteration, a candidate neighboring
solutionϕlis chosen, based on a cost-based neighborhood function. Onceϕlis chosen it is
com-pared against the current solution (ϕ∗) and, depending on whetherδ =C(ϕl)−C(ϕ∗)is larger
than0or not,ϕlis accepted as the new current solutionϕ∗or tested with an acceptance function.
than the best-so-far solutionϕbest, it becomes the newϕbest. After running a given number of
iterations the system’s temperature is cooled down. This process follows until a total number of iterations is run or a termination criteria is met.
Observe that the acceptance function allows the heuristic to admit solutions which are worse than the previous ones. This is generally known as climbing up and helps to avoid that heuristics are trapped in a local optimum. Although the mechanics of SA are not complicated, choosing the cooling rate, stop criteria, and neighborhood function is not trivial.
2.2.2 Related Work
TheQuadratic Assignment Problem,which is a more general problem than MAP, is an NP-hard problem [143] which has been creating interest during more than50years [100]. The QAP objective function can be mathematically formulated as follows
n X
i=1
n X
j=1
fij·dist(π(i)π(j)) + X
i,π(i)
b(i, π(i)),
wherefij is the flow between facilitiesiandj,π(·) is the location at which a facility has been
assigned,dist(x, y)denotes the distance between two locationsxandy, andb(i, x)is the initial allocation cost of facilityito locationx. Many well-known problems, like the traveling salesman problem (TSP), minLA, and MAP, are special cases of QAP.
Some exact algorithms have been developed to solve the QAP problem. However, they are only capable to solve small instances due to the enormous computation capacity required. The largest instances solved optimally surpassed just recently the100locations frontier [70], but most of the latest works still work with instances of 30-40 locations [70] [134]. These algorithms typically use branch and bound, branch and cut, or dynamic programming.
Approximate methods have also been developed to tackle the QAP problem. We classify them in heuristics and metaheuristics. Starting with heuristics, most of the ones that have been developed can be grouped in constructive, enumeration, and improvement methods. We can find some examples of heuristics applied to the QAP problem in [72, 117, 132].
Despite of the richness in heuristics, metaheuristics have been attracting most of the atten-tion lately. Most of the metaheuristics applied to the QAP problem can be included in one of the following families: genetic algorithms (GA) [60, 120], simulated annealing (SA) [42, 167], ant colony optimization (ACO) [149], tabu search (TS) [95, 121, 122, 150], breakout local search (BLS) [34], greedy randomized adaptive search procedures (GRASP) [107], variable neighbor-hood search (VNS) [171], or hybrid combinations of them [71, 151]. Given that QAP is more general than MAP, it is possible to adapt many of these techniques to obtain solutions also for MAP.
the latest works using SA, alone or combined with other techniques. We start with the work of Wang [161], who proposed in 2007 a tabu-based simulated annealing algorithm. In that work, a pure SA algorithm was compared to a tabu-search SA, trying different tabu list sizes and also trying different guided restart and reannealing strategies, enhancing the ability to escape from local optima. In 2012, Wang [162] presented a new work based also on simulated annealing, but trying different guided restart strategies. In both works a local-search-based neighborhood function was used jointly with a geometrical cooling rate schedule (like Kirkpatricket al.[99]), reheating the algorithm when a restart takes place. In 2012, Jingweiet al.[98] presented a new hybrid algorithm combining ant colonies and simulating annealing. Here, simulated annealing was used to select the best ants in each iteration, while the cooling schedule was also geometrical. In 2003, Miseviˇcius [119] presented a very detailed work comparing multiple previously proposed cooling schedules. With this, he proposed an SA heuristic using a normal-local-search-based neighborhood function, an inhomogeneus annealing cooling schedule without equilibrium tests, like the one proposed by Connollyet al.in [55], and modified reannealing so the cooling schedule oscillates depending on the behavior of the annealing. This heuristic was completed by a post optimization stage based on Taillard’s robust tabu search. This heuristic was even able to improve one of the QAPLIB [41] instances.
Finally, Telloet al.[139], in 2008, presented a2-stage simulated annealing algorithm for the minLA problem. This work was able to improve multiple results from the typical set of minLA benchmarks compiled by Petit [137]. Its main contribution is to design a2-stage SA algorithm, where the first stage obtains an initial approximation through a frontal increase minimization al-gorithm, and the second stage is devoted to improve this initial solution. They consider a modified median-based neighborhood function in which the typical 2-exchange strategy is conditioned by the nodes connected to a candidate-to-be-moved node. They also consider different ways of es-tablishing the initial temperature, based on [154], and a different cooling schedule [7]. We will detail these aspects when describing our algorithm in Chapter 4, as we adopted and adapted some of their ideas for our MAP heuristic.
2.3
Rate Adaptation and Green Data Center Networking
2.3.1 Background
and it is still increasing rapidly. Therefore, making the network energy proportional can provide considerable energy savings and tremendous economic benefit.
Traditional data center networks are mostly structured as a 2N tree topology [2]. In a 2N tree, the effective bisection bandwidth can be easily cut down by a small number of failures. Alternatives such as FatTree [10,131], VL2 [78], BCube [79] and DCell [80] provide much richer connectivity and can handle failures more gracefully. However, the static provisioning irrespective to real workloads forces most of the designs into a dilemma: high connectivity comes with high power consumption, as currently used network elements are unlikely energy proportional. It has been verified in [114] that60%of the time, the average traffic stays quite small, and the portion of time in which traffic peaks is less than5%. As a result, the power consumption of the network should be proportional to the workload to achieve energy conservation.
The topic of greening the data center network has been widely explored. Most of the work can be categorized into two groups in general. The most straightforward way is designing energy-efficient topologies which can provide similar connectivity while using less network de-vices [8, 90]. However, the potential of this approach is limited since we have to guarantee suf-ficient bandwidth for traffic bursts. Another option consists in reducing the amount of active devices in current networks. This is generally accomplished by consolidating traffic flows and turning off unnecessary devices (e.g. [87, 111, 146, 165]). The key observation behind this line is the connectivity redundancy and the traffic load variation in current data center networks. Ho-wever, when we switch off devices, the network topology will be changed. Since this topology transformation cannot be completed in a short time, the network may suffer from oscillation. Consequently, maintaining the quality of service in the network will become tricky.
We propose to incorporate rate adaptation into data center networks to achieve energy con-servation. To the best of our knowledge, this approach has not been deeply explored before. Rate adaptation was proposed by Nordman and Christensen [133] and has been widely studied. The main idea of rate adaptation is to approach energy proportionality by varying the link rate adap-tively to meet its carried load. Since being proposed, rate adaptation starts to be supported by some production devices, such as InfiniBand [4]. As shown in Table 2.1, an InfiniBand link is a serial link with single or multiple lanes, each of which can operate at one of five data rates. With a lower data rate, the power consumption is accordingly smaller. Also the ADSL2+ standard [77] and the Cray YARC [145] switch allow links to be configured to specific speeds. Although there are still some limitations in applying rate adaptation directly, we believe that future network de-vices will provide a wide set of operating rates in order to keep up with the green computing trend. In this sense, this work also reveals the potential of saving energy by using rate adaptation in future data center networks.
algo-Table 2.1: Effective theoretical data rate of InfiniBand
Rate SDR DDR QDR FDR EDR
1X 2Gbit/s 4Gbit/s 8Gbit/s 13.64Gbit/s 25Gbit/s 4X 8Gbit/s 16Gbit/s 32Gbit/s 54.4Gbit/s 100Gbit/s 12X 24Gbit/s 48Gbit/s 96Gbit/s 163.64Gbit/s 300Gbit/s
rithms for improving the energy efficiency in data center networks. Specifically, in Chapter 5, we model this rate-adaptive energy-efficient routing problem and provide a constant approximation algorithm to solve it. This is the most significant difference compared with the most relevant work [157] which provides an energy-efficient traffic engineering solution for general networks by utilizing rate adaptation heuristically.
2.3.2 Related Work
We can, basically, group the related work around two main topics, green networks and energy-efficient data center networks.
Significant amount of work has been done on energy-efficient and green networking. Gupta et al. [83] proposed the idea of reducing the overall energy for Internet, and then studied an energy saving problem for LAN (Local Area Network) [84], suggesting to utilize the multiple speed states of Ethernet interfaces. ALR (Adaptive Link Rate) was proposed by Nordman and Christensen [133] for achieving energy proportionality on Ethernet network links. Combining sleeping and rate adaptation, Nedevschiet al. [129] studied how to reduce the network energy consumption during network idle or low-load period. In order to achieve network-global energy efficiency in Internet, Andrewset al.[13] then devised an effective approximation algorithm for a centralized network-wide routing model, assuming speed scaling capabilities for all network elements. They also studied a similar problem by powering down network devices [16]. In a subsequent work, Andrewset al.[15] studied a flow scheduling problem for saving energy in an adversary network environment, while maintaining the stability in the meantime. Cianfrani et al.[53] proposed energy-aware OSPF routing solutions by integrating the energy-saving strategy into IP routing protocols. To achieve scalability, Vasic et al. [157] come up with a heuristic energy-aware traffic engineering solution where multiple operational rates of network devices are exploited. Later, they proposed REsPoNse [156], where energy-critical paths are used to handle the optimality-scalability trade-off in the pursuit of power conservation in networks.
network operational power in large scale systems and data center networks. Recently Wang et al.[165] proposed CARPO, a correlation-aware power optimization algorithm that considers the correlations between different flows.
The second category tries to design better network topologies to reduce the power cost of the whole network. Abts et al.[8] proposed a new kind topology called flatted butterfly which can reduce the number of switches, bringing a big amount of energy savings, while guaranteeing a similar connectivity. They also discussed how to provide dynamic link rates to meet the real link loads. Huanget al.[90] provided another kind of server-centric network topology which can vary bandwidth availability based on traffic demands.
Differing from others, we will consider a new rate-adaptive energy-saving model in data cen-ter networks. With the underlying trend of rate adaptive network devices in mind, we discuss in Chapter 5 how to provide green networking for future data centers.
2.4
Characterizing the Energy Consumption of Data Center Servers
2.4.1 Background
While in Section 2.3.2 we referred to the relevance of network elements regarding energy consumption in data centers, we now concentrate our attention on the characterization of data center servers and the energy they consume.
Indeed, although many energy saving techniques have been proposed during the recent years, such as virtualization plus consolidation or scheduling optimization [102, 126], in order to obtain full benefit of them it is crucial to have a good characterization of the servers in the data center, as a function of the utilization of the server’s components. That is, it is necessary to know and understand the energy and power consumption of servers and how this changes under the differ-ent configurations. There is a large body of literature on characterizing servers’ energy and power consumption. However, the existing literature does not jointly consider phenomena like the irrup-tion of multicore servers and dynamic voltage and frequency scaling (DVFS) [166], which are key to achieve scalability and flexibility in the architecture of a server. With these new parameters, more variables come into play in a server configuration. Learning how to deal with these new parameters and how they interact with other variables is important since this may lead to larger savings.
the maximal computational capacity of the CPU, since this value changes with the operational frequency). Therefore, more complex/complete models for the power consumed by a server are necessary. In order to be consistent, these models have to be based on empirical values. However, we found that there is a lack of empirical work studying servers energy behavior.
The study we present in Chapter 6 tries to partially fill this void by proposing a measurement-based characterization of the energy consumption of a server components with DVFS and multiple cores.
2.4.2 Related Work
There is a large body of work in the field of modeling server energy consumption and its components, both theoretically and empirically. The consumption of servers has been assumed as linear, e.g., by Wanget al. [164], Mishraet al.[124] or Beloglazovet al.[33], who assumed models in which energy consumption mainly depends linearly on CPU utilization. Based on the models, they proposed bin-packing-like algorithms to reduce energy consumption. Other works like the ones from Andrewset al.[14] or Iraniet al.[94] proposed non-linear models, claiming that energy could be saved by running processes at the lowest possible speed.
Moving to the empirical field, we first classify works in two different groups, depending on whether they onsider the effect of frequency in their analysis. We start with works not considering frequency. In this category we find articles proposing models where server components follow a linear behavior, like in [101, 108, 155] or more complex ones, like in [29