© 2016 IJSRSET | Volume 2 | Issue 1 | Print ISSN : 2395-1990 | Online ISSN : 2394-4099 Themed Section: Engineering and Technology
Study of the effect of machining parameters and Analysis of the wear
characteristics of an EDM by ANOVA’s Techniques
Krishan Kant
1, Parveen Tyagi
2, Umesh Gupta
3, Shiv Kumar
41,3Assistant Professor in Mechanical Engineering Department India Gharuan, Punjab India 2,4Assistant Professor in Mathematics (Applied Sciences) , Chandigarh University, Gharuan, Punjab India
ABSTRACT
Electric discharge machining (EDM) is one of the maximum commonly used nontraditional processes for making accurate intricate shapes on hard materials like die steels and is most preferred process to be followed for die and mold making. In this research work, Experiment plan has been designed using Taguchi technique to study the effect of different parameters and their levels by conducting least number of experiments. Based on this L18 orthogonal array is been used. As the most popularly used material in die and mold casting industries are the die steels hence for this work AISI H11 die steel are used as the workpiece material for slot cutting. Effort has been made to find out the optimum machining conditions by varying process parameters like current, powder to be suspended in dielectric, its concentration, tool material and pulse-on duration at three levels with and without using external magnetic field. The results are analyzed using analysis of variance (ANOVA) both analytically and graphically. Significant factors affecting the output parameters have been found using F-test and percentage contribution. From the experimental investigation copper tool followed by C18000 tool has been found to give the best MRR results and high tool wear, whereas tungsten tool has been found to give the least MRR accompanied by least tool wear. The dimensional accuracy of the tools in terms of corner wear, side wear and overcut has also been studied.
Keywords : Electric discharge machining, Taguchi technique, L18 orthogonal array, AISI, H11 die steel.
I.
INTRODUCTION
During the 1930s, attempts were made for the first time to machine metals and diamonds with electrical discharges. Erosion was caused by intermittent arc discharges occurring in air between the tool electrode and work piece connected to a DC power supply. These processes were not very precise due to overheating of the machining area and may be defined as ‘arc machining’ rather than ‘spark machining.’
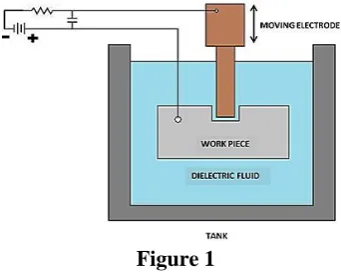
Figure 1
In EDM, a potential difference is applied between the tool and workpiece. Both the tool and the work material are to be conductors of electricity. The tool and the work material are immersed in a dielectric medium. A gap is maintained between the tool and the workpiece. Depending upon the applied potential difference and the gap between the tool and workpiece, an electric field would be established. , the material removal in EDM mainly occurs due to formation of shock waves as the plasma channel collapse owing to discontinuation of applied potential difference.
II.
METHODS AND MATERIAL
A. Parameters Affecting Performance of EDM
Discharge Voltage
Discharge voltage in EDM is related to the spark gap and breakdown strength of the dielectric [Ghosh and Mallick]. Before current flows, open gap voltage increases until it creates an ionization path through the dielectric. Once the current starts flowing, voltage drops and gets stabilized at the working gap level. Higher is the voltage, more is the gap, that improves the flushing conditions and helps to stabilize the cut. MRR, tool wear rate (TWR) and surface roughness increases, by increasing open circuit voltage, because electric field strength increases [Fuller, 1996].
Peak Current
Higher amperage is used in roughing operations and in cavities or details with large surface areas. Machined cavity is a replica of tool electrode and excessive wear will affect the accuracy of machining.
Pulse Duration and Pulse Interval
Each cycle has an on-time and off-time that is expressed in units of microseconds. Since all the work is done during on-time, the duration of these pulses and the number of cycles per second (frequency) are important. Pulse on-time is commonly referred to as pulse duration and pulse off-time is called pulse interval. When the optimum pulse duration for each electrode—work material combination is exceeded, material removal rate starts to decrease.
Pulse Waveform
Different waveforms are generated using different generators .The pulse shape is normally rectangular, but the generators with other pulses have also been developed.
Polarity
Polarity determines the direction of current flow relative to electrode; it can be either positive or negative
depending on applications. In positive or normal polarity workpiece is positive and tool is negative and in reverse or negative polarity workpiece is negative and tool is positive.
Figure 2 : Pulse Waveform of Controlled Pulse
Generator
Dielectric
Basic characteristics necessary for a dielectric in EDM are high dielectric strength and quick recovery after breakdown, effective quenching and flushing ability. TWR and MRR are affected by the type of dielectric and the method of its flushing (Wong et al., 1995). Generally kerosene and deionized water is used as dielectric fluid in EDM. Tap water cannot be used as it ionizes too early and thus breakdown due to presence of salts as impurities occur. Dielectric medium is generally flushed around the spark zone. It is also applied through the tool to achieve efficient removal of molten material.
Pulse-on Time
This is time period during which machining is performed. As the ‘pulse on’ time increases, machining will perform at faster rate and craters will be broader and deeper thereby resulting in poor surface finish and high MRR. Larger the pulse on times means larger is the recast layer and more are the heat affected zones.
Pulse-off Time
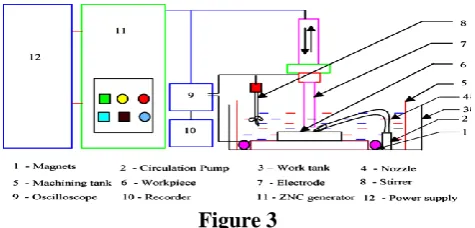
Figure 3
The experimental set up consists of transparent container in which machining is performed called machining tank, placed in the work tank of EDM. Fixture assembly is used to hold the work piece. Dielectric (kerosene oil) fluid is filled in machining tank. A stirrer system is used to avoid particle setting. Small dielectric circulation pump is used. Pump and stirrer assembly are placed in same tank in which machining is performed. Magnetic forces were used to separate the debris from the dielectric fluid, for these two permanent magnets are placed at the bottom of machining tank.
The spark gap is filled with powder particles. When voltage was applied an electric field was created. The powder particles get charged and act as conductors behaving in zigzag manner.
B. Experimental Design
Designing an experiment is the principle need of any experimentation plan. In present study Taguchi Method is used for preparing experimental design. Main steps of experiment plan are listed below.
Defining objective function Selecting an appropriate OA
Selection of factors Pilot Experimentation
Finalizing the factors and their levels
1. Defining Objective Function
The main objective of this experimentation is to study the effect of current, powder concentration, type of powder and magnetic strength on tool behavior during macro and micro EDM, PMEDM during slot cutting to analyze output parameters dimensional and profile accuracy of tool.
2. Selecting an Appropriate OA
The Taguchi method involves reducing the variation in a process through robust design of experiments by using a selected set of experimentation plan. Each factor is assigned column(s) depending on its DOF. Each level of a factor has an equal number of occurrences within each column; and for each level within one column, each level within any other column will occur an equal number of times as well.
3. Selection of Factors
Selection of factors is an important task which is to be done carefully to prepare the most effective design of experiment. Brainstorming and pilot experimentations are conducted to decide factors and their levels.
4. Calculation of DOF
DOF denotes the number of the independent comparisons that can be made in any experiment. The number of factors considered for experimentation, their respective levels determine the total degree of freedom required for designing OA. Mathematically, DOF for each factor is calculated as,
DOF= n-1, where n is the level of each factor
5. Selection of OA for PMEDM
Different factors considered for PEDM experiments and their levels are listed in Table 3.2.
Factors (unit) Levels
Level 1 Level 2 Level 3
Current (A) 2 4 6
Magnetic field (T) 0.1 No -
Tool material Copper C18000 Tungsten
Powder type Tungsten Copper Titanium
Concentration (g/L) 2 4 6
Pulse-on time (µs) 50 100 200
C. Experimental Set Up
Machine Set Up
The experimentation work is performed on T-3822 M Electric Discharge Machine of Victory Electromech placed in non-traditional machining lab at Thapar University, Patiala. A separate arrangement is added for performing powder mixed EDM, a mild steel tank with inside dimensions as length 330 mm, breadth 180 mm, height 187 mm and plate thickness 3 mm. Capacity of the used tank is 9 L. A stirrer with the maximum speed of 1400 rpm is used to properly mix the powder in the dielectric medium.
Figure 4: Control Panel
Various input parameters varied on the EDM machine for present study are current and pulse on time. Levels of the input parameters are decided on the basis of pilot experimentation.
Some parameters that are kept constant during the study are listed in
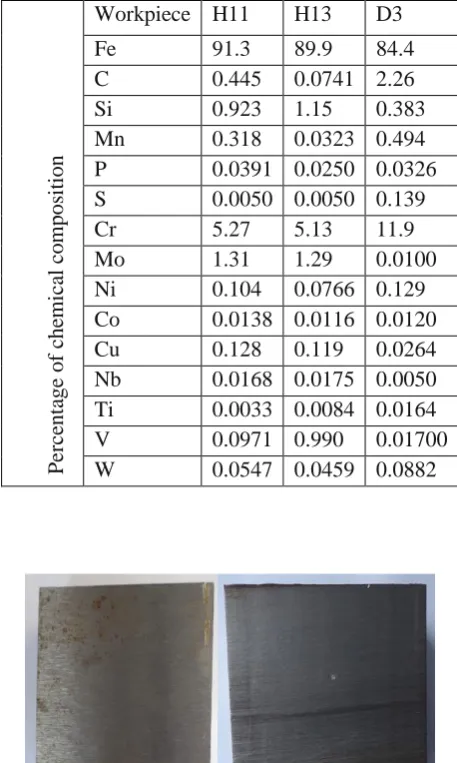
Workpiece and Tool Electrode Details
For experimentation, die steel material is used as workpiece. Before machining, workpiece is properly grinded from both the sides for maintain perfect alignment of workpiece with the tool electrode during machining. Three electrode materials used for machining purpose, namely copper, tungsten and C18000 (alloy (Copper, Chromium, Nickel, Silicon (beryllium free)), all with diameter 2.4mm and 30mm length. Workpiece materials before machining and tool electrodes are shown in
Per
ce
nt
age o
f che
m
ica
l co
m
pos
it
ion
Workpiece H11 H13 D3
Fe 91.3 89.9 84.4
C 0.445 0.0741 2.26
Si 0.923 1.15 0.383
Mn 0.318 0.0323 0.494
P 0.0391 0.0250 0.0326
S 0.0050 0.0050 0.139
Cr 5.27 5.13 11.9
Mo 1.31 1.29 0.0100
Ni 0.104 0.0766 0.129
Co 0.0138 0.0116 0.0120
Cu 0.128 0.119 0.0264
Nb 0.0168 0.0175 0.0050
Ti 0.0033 0.0084 0.0164
V 0.0971 0.990 0.01700
W 0.0547 0.0459 0.0882
III.
RESULTS AND DISCUSSION
The effect of powder mixed in dielectric, concentration of powder, current, tool material and pulse-on duration is analyzed on MRR and TWR with and without using external magnetic field. Using Taguchi experimental design, L18 orthogonal array is used for the experiments using bar magnets of 0.1 T. Schematic representation of the tool and the workpiece is shown in Fig. 4.1. Tool is made in contact with the workpiece up to 10 mm in length and machining duration is kept 10 minutes.
A. MRR for H11 Workpiece
The results for MRR calculated by the Eq. are given in Table
B. Results of MRR for H11 workpiece
The results are analyzed using ANOVA. It helps in identifying the important process parameters affecting the response. Results for mean of MRR calculated at 90% confidence level ANOVA table for MRR of H11workpiece the MRR is found to increase with increase in current till the current reaches value of 4
(Note: For 90% CI, Fcritical(2,6) = 3.46, Fcritical(1,6) = 3.78, PC= percentage contribution)
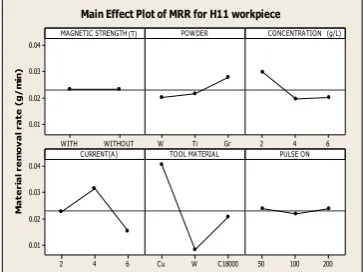
The principle followed by F-test is that, greater is the F value for an input parameter the larger is its effect on output parameter. ANOVA shows the results of MRR of PMEDM with and without the use of magnetic strength. Under such experimental conditions the two factors i.e. tool material (F value 15.56) and current (F value 4.27) are found to be significant. The highest MRR is achieved using copper tool followed by C18000 alloy and, the tungsten tool is found to give the least MRR among the three tool materials used. The following pattern is observed due to difference in their electrical conductivities as the electrical conductivity of copper is found to be the highest. Thus MRR achieved by the tungsten is very low due to its poor electrical conductivity.The second significant factor is the current having F value as 4.27. Initially the MRR is found to increase with increase in current till the current reaches value of 4 A after that the MRR begins to decrease when current approaches the value of 6 A. The reason behind this may be due to the situation of arcing rather than spark and also due to the fact that as the current increases the downward movement of tool becomes fast as a result there is not enough time for the removal of debris and the suspended powder which of arcing. The next highest value of F is for the concentration 1.58 g/L. MRR is found to decrease with concentration because as the amount of powder suspended in the dielectric increases, the circulation of the powder particles is not enough also with increase in concentration above a certain level arcing occurs as the effective gap between the tool and the workpiece decreases with increase in concentration. The performance of factors at various levels is clearly abscissa represents levels of various factors and ordinate represents MRR (g/min). The center line represents mean value of the levels.
M
a
te
ri
a
l
re
m
o
v
a
l
ra
te
(
g
/
m
in
)
WITHOUT WITH 0.04 0.03 0.02 0.01
Gr Ti
W 2 4 6
6 4 2 0.04 0.03
0.02 0.01
C18000 W
Cu 50 100 200
MAGNETIC STRENGTH POWDER CONCENTRATION
CURRENT TOOL MATERIAL PULSE ON Main Effect Plot of MRR for H11 workpiece
(T)
(A)
(g/L)
The highest MRR is achieved on suspension of graphite powder as its density and electrical resistivity is least among the all three. The MRR obtained by titanium is slightly higher as compared to tungsten but less than graphite as the electrical resistivity and density of titanium is less than tungsten but higher than graphite. Thus less is the density and electrical resistivity of a powder more is the MRR achieved by it till the concentration reaches an optimum level. The effect of pulse on duration and magnetic strength have not been found to be very significant and have been ranked as 5th and 6th respectively based on their F values. The MRR is found to increase on increasing the pulse on duration as more melting and vaporization of workpiece will take place when time for which the energy supplied increases. Magnetic strength has least effect on the MRR. The MRR obtained under the influence of magnetic field is slightly less than that obtained without the use of magnets but overall the effect of this factor is negligible. Based on the ANOVA the factors are assigned ranks and are listed in Table 4.3.
Le vel
Mag netic stren gth (T)
Powd er
Concent ration (g/L)
Curre nt (A)
Tool mater ial
Pulse -on time (µs)
1 0.023 110
0.019 97
0.02966 5
0.022 665
0.040 553
0.023 775 2 0.023
181
0.021 665
0.01966 3
0.031 552
0.008 220
0.021 775
3 0.027
775
0.02010 8
0.015 220
0.020 663
0.023 887 De
lta
0.000 071
0.007 778
0.01000 2
0.016 332
0.032 333
0.002 112 Ra
nk
6 4 3 2 1 5
C. Response table for MRR of H11workpiece
Optimal design
In the experimental study, the mean effect plots (Fig. 4.1.) is used to evaluate the mean MRR at optimal trial conditions considering higher F-value and corresponding percentage contribution two parameters are found to be significant tool material and current. The level of these factors which gives the maximum MRR are noted from main effect plot (Fig. 4.1) and the corresponding MRR for is directly obtained from Maximum value of these parameters is selected
because MRR is the higher the better type of response variable. Desired mean in this case is estimated as:
= 0.031552 + 0.040553 –
0.0231456 = 0.0489594 g/min
Confidence interval
√
Where = F ratio
α = 0.1 (risk) Confidence = 1 – α
= DOF for mean (always 1) = Total DOF (=17)
= Average of all experimental trials
= Number of tests under that condition using the
participating factors
=
=
= 3.6
N is the number of trial in the experiment = Variance of error
CI = √
= 0.00966
Thus the optimum value of MRR is given by (0.0489594 ± 0.00966) g/min.
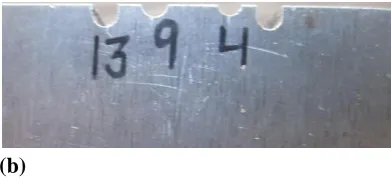
The workpiece samples from different views of H11 after each cut is shown in Figures shows top view which indicates the length of cut shows the side views where depth till which machining has been completed can be seen.
(b)
Figure 7 : (a) Top view of H11 workpiece (b) Side
views of H11 workpiece
D. Results and Analysis of TWR
The effect of powder mixed in dielectric, concentration of powder, current, tool material and pulse on duration on tool wear rate is analyzed with and without using external magnetic field on tool wear rate, using Taguchi experimental design. L18 orthogonal array is used for the experiments using bar magnets of 0.1 T. It is smaller the better type of response variable. TWR is calculated by measuring the initial and final weight of the tool using a weighing machine with least count of 0.001 g
TWR= g/min
Where Wi = Initial weight of the workpiece (g)
Wf = Final weight of the workpiece after the experimentation (g)
t = Machining time (min)
E. Results and analysis of TWR for H11 workpiece
Results for mean TWR for H11 workpiece are given in Table Ex pt. No Mag netic stren gth (T) Po wde r Concen tration (g/L) Cur rent (A) Tool mat erial Pul se-on (µs ) TW R (g/ min )
1 With W 2 2 Cu 50 0.00
067
2 With W 4 4 W 10
0
0.00 006
3 With W 6 6 C18
000 20 0
0.00 066
4 With Ti 2 2 W 10
0
0.00 006
5 With Ti 4 4 C18 20 0.00
000 0 067
6 With Ti 6 6 Cu 50 0.00
067
7 With Gr 2 4 Cu 20
0
0.00 060
8 With Gr 4 6 W 50 0.00
067
9 With Gr 6 2 C18
000 10 0
0.00 670 10 With
out
W 2 6 C18
000 10 0
0.00 133 11 With
out
W 4 2 Cu 20
0
0.00 067 12 With
out
W 6 4 W 50 0.00
006 13 With
out
Ti 2 4 C18
000
50 0.00 200 14 With
out
Ti 4 6 Cu 10
0
0.00 067 15 With
out
Ti 6 2 W 20
0
0.00 006 16 With
out
Gr 2 6 W 20
0
0.00 067 17 With
out
Gr 4 2 C18
000
50 0.00 067 18 With
out
Gr 6 4 Cu 10
0
0.00 133
F. Results of TWR for H11 workpiece
These results of TWR are analyzed using ANOVA at 90% confidence level and result is given in Table 4.11.
Paramete r Sym bol D OF
SS Varianc e F -val ue PC Magnetic strength (T)
A 1 0.0000 0036 0.0000 0036 0.1 8 0.91 4
Powder B 2 0.0000 04
0.0000 02
1 10.1 62 Concentr
ation (g/L)
C 2 0.0000 04 0.0000 02 0.8 7 10.1 62 Current (A)
D 2 0.0000 02 0.0000 01 0.5 1 5.08 1 Tool material
time (µs) 05 02 6 03 Residual
error
6 0.0000 13
0.0000 02
33.0 28
Total 17 0.0000
3936
(Note: For 90% CI, Fcritical(2,6) = 3.46, Fcritical(1,6) = 3.78, PC= percentage contribution)
G. ANOVA table for TWR of H11 workpiece
Based on this analysis conducted, most significant factor is tool material. The highest tool wear is observed with C18000 alloy followed by copper tool. Tungsten tool has been found to give the least tool wear. This is because of difference in the melting points of the tool materials. Thoriated tungsten having 2% thorium has the highest melting point 3695 K hence it gives the lowest tool wear whereas there is not much difference in the melting points of opper and C18000 alloy the melting point of pure copper is approximately 1357 K and C18000 is 1311 K approx. Thus the tool wear of C18000 is slightly higher than that of copper. Tool wear of a particular material also depends on the density of that material; the density of copper is 8.75 g/cm3 of alloy C18000 is 8.81 g/cm3 whereas the density of the thoriated tungsten is almost double of them hence tool wear observed in the tungsten used is almost negligible. Thermal conductivity of copper at 100 ºC is about 400 W/m-K and of alloy C18000 is 208 W/m K and that of tungsten is 173 W/m-K although tool wear is found to decrease with increase in thermal conductivity but in this case it is not a dominating factor. Pulse on duration is the second factor affecting the tool wear rate after the tool material. Tool wear rate increases with pulse on duration till 100 µs after that tool wear rate begins to decrease as the level reaches tool 200 µs, the reason behind this may be that as the pulse on durations increase the layer of carbon deposited on the tool due to decomposition of dielectric and from melting if workpiece also increases as a result it protects the tool from wear. Concentration is the third factor affecting the tool wear rate. The tool wear rate decreases with increase in concentration. This may be because as the amount of powder is increased in the dielectric the spark is diffused homogenously and also it widens the plasma channel. The fourth factor affecting the tool wear rate is the type of powder suspended in the dielectric, maximum tool wear is observed when the graphite is
suspended in the dielectric as it has maximum conductivity whereas titanium and tungsten powder suspension gives almost the same tool wear rate. The next factor affecting the tool wear rate is current, the tool wear rate is found to decrease with increase in current the reason behind this may be combined effect of current and magnetic field as the current increases to 6 A the magnetic field produced increases and copper particles being diamagnetic are repelled more strongly thus decreasing the tool wear. The variation of tool wear with different process parameters are shown in Fig. 4.7. In the Fig. 4.7 abscissa represents levels of various factors and ordinate represents TWR (g/min). The center line represents mean value of the levels.
To ol W ea r R at e (g /m in ) WITHOUT WITH 0.0020 0.0015 0.0010 0.0005 0.0000 Gr Ti
W 2 4 6
6 4 2 0.0020 0.0015 0.0010 0.0005 0.0000 C18000 W
Cu 50 100 200
MAGNETIC STRENGTH POWDER CONCENTRATION
CURRENT TOOL MATERIAL PULSE ON Main Effects Plot of TWR for H11 workpiece
(A)
(g/L)
Figure 8: Main effect plots of TWR for H11 workpiece
Based on the analysis the factors are ranked according to their significance of affecting tool wear rate, shown in table Le vel Mag netic stren gth (T) Powd er Concent ration (g/L) Curre nt (A) Tool mater ial Pulse -on (µs)
1 0.001 128 0.000 575 0.00088 8 0.001 472 0.000 768 0.000 688 2 0.000
829 0.000 688 0.00046 7 0.000 787 0.000 162 0.001 692
3 0.001
672 0.00158 0 0.000 677 0.002 005 0.000 555 De lta 0.000 299 0.001 097 0.00111 3 0.000 795 0.001 843 0.001 137 Ra nk
6 4 3 5 1 2
(T)
H. Response table of TWR for H11 workpiece
Optimal Design
In the experimental study, the mean effect plots. are used to evaluate the mean TWR at optimal trial conditions. From Table considering higher F-value and corresponding percentage contribution three parameters are found to be significant tool material followed by current and type of powder. The level of these factors which gives the minimum TWR are noted from main effect and the corresponding TWR for and is directly obtained. Minimum value of these parameters is selected because TWR is the lower the better type of response variable. Desired mean in this case is estimated as:
= 0.000162 + 0.000555 – 0.0010122
= -0.0002952 ≡ 0
The optimal calculation for population mean (µ) gives negative value. This situation may appear for responses which are lower the better type and where the optimum/target value is zero. For such case negative value of µ may not have any physical significance and is to be considered as zero.
Confidence interval
√
Where = F ratio α = 0.1 (risk) Confidence = 1 – α
= DF for mean (always 1) = Total DOF (=17)
= Average of all experimental trials
= Number of tests under that condition using the
participating factors
=
=
= 3.6
N is the number of trial in the experiment = Variance of error
CI = √
=
Thus the optimum value of TWR is given by (0 ± ) g/min.
This experimental investigation was mainly aimed at comparing the tool wear behavior of the three tool material copper, C18000 and tungsten with and without using the external magnetic field. Different process parameters like current, pulse-on time, powder suspended in dielectric (tungsten, titanium and graphite) was varied at three levels with and without using magnetic field. Different output parameters measured are MRR, TWR, geometrical tool wear characteristics (corner wear, side wear), overcut. Some significant conclusions drawn on the basis of analysis of results
Tool material is found to be the most significant factor in case of all the response variables measured with copper giving the highest MRR and TWR followed by C18000 alloy and tungsten.
Besides tool material current is found to be the significant factor in affecting MRR for H11 and D3 workpiece materials, type of powder suspended in dielectric is found to affect the MRR for H13 and D3 workpiece materials.
Including the tool material factor TWR is affected by pulse-on duration for H11 and D3 workpiece, by magnetic strength for H13 workpiece.
AISI H13 workpiece material is found to have maximum MRR and D3 workpiece has shown minimum TWR.
Graphite powder has reported better MRR compared to the two other powders used.
Trials conducted in the presence of external magnetic field have reported to show better MRR and less TWR.
Maximum MRR is achieved at the powder concentration of 2g/L.
Maximum corner wear is reported in tool material C18000 alloy while maximum side wear is shown in tungsten tool.
Overcut is found to decrease with increase in pulse-on duratipulse-on, presence of magnetic strength is also found to decrease the overcut.
IV.
REFERENCES[1]
Aas K.L. (2004) Performance of two graphite
electrode qualities in EDM of seal slots in a jet
engine turbine vane. Journals of Materials
Processing Technology 149:152-156.
[2]
Batish A., Bhattacharya A. (2012) Mechanism
of Material Deposition from Powder ,Electrode
and Dielectric for Surface Modification of H11
and H13 die steels in EDM Process. Material
Science Forum, 701:61-75.
[3]
Bhattacharya A., Batish A. (2012) Surface
Modification of Carbon High Chromium , EN31
and Hot Die Steel using Powder Mixed EDM
Process. Material Science Forum 701:43-59.
[4]
Bhattacharya A., Batish A., Singh G. (2011)
Optimization of Powder Mixed Electric
discharge Machining using Dummy treated
Experimental Design with Analytic Hierarchy
process.
Proceedings
of
Institution
of
Mechanical Engineers, Part – B: Journal of
Engineering Manufacture, 226:103–116.
[5]