Emperor International Journal of Finance and Management Research [EIJFMR] Page 87
AN ECONOMETRIC ANALYSIS OF
MONETARY POLICY KEY RATES ON
SHARE PRICES OF BANKS – A STUDY
WITH REFERENCE TO NATIONAL
STOCK EXCHANGE
Paper Recceived 8th Aug 2017 Paper Accepted 20th Aug 2017 Paper Published 30th Aug 2017 Reviewers: Dr. R. Mathavan Dr.Leela
Mr.RAVI DARSHINI T.S HOD – Post Graduate Department Assistant St.Joseph’s College of Commerce, Bangalore.
Dr. C.S THAMMAIAH Director and Head Academic Manipal Global Education Services
Abstract
The focus of this research paper is to investigate empirically the relationship between key ratios of monetary policy of India with bank index and stock prices of banks. The research employed data from 2012 – 2015. The paper used time series analysis on changes in bank rates, repo, reverse repo, CRR and SLR spanning from 2012 – 2015. Using method of CAAR (cumulative average abnormal returns) an event study methodology were used to analyze the impact of the key ratios on bank stock prices. At 5% level of significance, findings were drawn for the hypothesis. The major findings of the study were that there is a significant difference in the stock prices of major banks pre and post announcement of key ratios made by Reserve Bank of India..
Keywords— Monetary Policy, Stock Prices, Bank
Index, Caar.
I. INTRODUCTION
Monetary policy refers to the use of instruments under the control of the Central bank to regulate the availability, cost and use of money and credit. The monetary authority typically the central bank of a
country is vested with the responsibility of conducting monetary policy.
Monetary policy is the process of a government central bank or monetary authority of a country uses to control (i) the supply of money, (ii) availability of money, and (iii) cost of money or rate of interest to attain a set of objectives oriented towards the growth and stability of the economy. Monetary theory provides insight into how to craft optimal monetary policy.
Monetary policy is concerned with the measures taken to regulate the supply of money, the cost and availability of credit in the economy. Further is also a deal with the distribution of credit between uses and users and also with both the lending and borrowing rates of interest of the banks. In developed countries the monetary policy has been usefully used for overcoming depression and inflation as an anti cyclical policy.
Emperor International Journal of Finance and Management Research [EIJFMR] Page 88 in the supply of currency, variations in bank rates and
other interest rates, open market operations, selective credit controls, and variations in reserve requirements. Here are the goals of monetary policy in a developing economy with special reference to those adopted by RBI.
Policy Framework
The framework aims at setting the policy (repo) rate based one forward looking assessment of inflation, growth and other macroeconomic risks, and modulation of liquidity conditions to anchor money market in the financial system, which in turn influence aggregate demand - a key determinant of inflation and growth.
Once the repo rate is announced, the operating framework on a day to day basis is implemented through proactive liquidity management, which aims at anchoring the operating target – the weighted average call rate (WACR) – around the repo rate. Monetary Policy and Capital Markets
Capital markets play a significant role in forming the economy of the country. Primarily the organised market i.e. trading through stock exchanges is what accounts higher towards the GDP, per capita income, indexes etc. A vibrant capital market is a sign of growth and the functioning of any capital market widely depends on various factors like monetary policy, exchange rates, growth, inflation, etc. The monetary policy measures taken up by RBI are to control the flow of money in the economy as stressed in the previous sections. All monetary policy measures implemented by the Reserve Bank of India has an impact on economy. The present study attempts to study the relationship between the monetary policy measures and the stock prices of NSE..
II. REVIEW OF LITERATURE
This section highlights the research that has happened in the said area in India and abroad. The following section is divided in to two parts. First it covers the research studies that have happened in India. Second part of the literature review covers the research studies outside India.
Research studies in India on Monetary policy
and capital market efficiency.
Emperor International Journal of Finance and Management Research [EIJFMR] Page 89 macroeconomic factors affecting the stock market in
long run are industrial production; wholesale price index and interest rate. (M.Kalyanasundaram, 2010) investigated the relationship among the variables in Brazil and India. Independent variables for the study were GDP, inflation rate, interest rate and BOP, where as dependent variable was the share price index. The study predicted that the countries able to withstand the crisis. The study showed that Brazil in performing better than India on all key aspects. (Clement, 2010) made a study on Empirical test of Indian Stock Market of efficiency in respect of bonus announcement. The sample consisted of all IT companies listed in BSE (list A and B1) for the period 2000 to 2007. He employed daily returns, security returns variability (SRV), Average security returns variability (ASRV), average abnormal returns (AAR), cumulative abnormal returns (CAR) were considered and t test was tested. His findings were that security prices reacted on announcements for bonus issue and Indian market for IT sector in general are efficient but not perfectly efficient to the announcement for bonus issue. (Naliniprava, 2011) investigated the market efficiency and causal relationship between selected Macroeconomic variables and the Indian stock market during the period January 2005 to February 2011 by using Ljung-Box Q test, Breusch-Godfrey LM test, Unit Root test, Granger Causality test. The study confirms the presence of autocorrelation in the Indian stock market and macro economic variables which implies that the market fell into form of Efficient Market Hypothesis. Further the Granger-causality test shows evidence of bidirectional relationship between interest rate and stock market, exchange rate and stock market, international stock market and BSE volume, exchange rate and BSE volume. So it suggests that any change of exchange rate, interest rate and international market significantly influencing the stock market in the economy and vice versa. The
study also reported unidirectional causality running from international stock market to domestic stock market, interest rate, exchange rate and inflation rate indicating sizeable influence in the stock market movement in the considered period. The study points out that the Indian stock market is sensitive towards changing behaviour of international market, exchange rate and interest rate in the economy and they can be used to predict stock market price fluctuations.
Research Studies Outside India on Monetary
Policy and Capital Market Efficiency.
James (1976) studied the efficient market
Emperor International Journal of Finance and Management Research [EIJFMR] Page 90 whether the price dividend ratio has marginal
predictive power for stock market returns after accounting for state dependent switching. The study concluded a strong evidence of predictability. The response of returns to the past price dividend ratio is strongly asymmetric about four times larger in the low return state than in the high return state. The study allowed the probability of transitions from one regime to another to depend on economic variables. The results found asymmetric response to the past price dividend ratio. (Gerald R Jensen, 1993) examined the reaction of stock prices to discount rate changes. The results support that discount rate increase are considered bad news while rate decrease are good news. The study also suggests that discount rate changes are more informative than implied by previous studies. (Thorbecke, June 1997) (Chandra, 2003) employed multifactor model to test if stock return data respond to monetary policy shocks. The innovations in the federal fund rate and non borrowed reserves were studied as expansionary policy. The results showed that expansionary policy increases ex stock returns and also assets ex ante return. (Nick von Gersdorff, 2008) attempted to study market efficiency with respect to merger and acquisition announcements using standard event study methodology. The study analyzed the effects of U.S. company mergers and acquisition announcements on stock price’s risk adjusted rate of return using twenty recent mergers. The weak, semi-strong, and strong form efficient market hypotheses which test an investor’s ability to earn a positive abnormal return on the basis of merger announcements are examined. Specifically, this work focuses on the semi-strong form test in an effort to test the efficiency of merger announcement public information. Evidence here supports semi-strong market efficiency along with a positive signal exhibited by the sample of acquiring firms during the event period. Evidence of lingering excess returns after the merger announcement was
also observed. (Wang, Aug2012) investigates the impact of domestic monetary policy rate announcements on the stock markets of New Zealand, Australia, the United Kingdom and the euro area, using event-study methods to identify stock price reactions to the unanticipated/surprise component of announcements. As Australia and New Zealand did not reach the zero bound we investigate whether there is an impact from the global financial crisis on stock market reactions that can be distinguished from the asymmetric reactions to surprises that characterise the business cycle. We find that the euro area and the UK both show a financial crisis effect but behaviour in New Zealand and Australia does not change. We conduct robustness checks and explore confounding factors, especially the impact of ‘guidance’ from central banks that prepares markets for policy rate changes. (Mehmet Ivrendi and Bulent Guloglu, November–December 2012) investigated the interactions between the stock prices and monetary policy regimes in four emerging countries using Markov regime switching autoregressive conditional heteroskedasticity (MS - ARCH) model. The study concluded that there exists an asymmetric relationship between the volatility of stock prices and stability of monetary policy regimes. (Ali Ozdagli and Yifan Yu, July 2012–December 2012) focused on the Hong Kong stock market’s response to U.S. monetary policy, and found that changes in the Hongkong stock prices are not directly influence US monetary policy.
Research Gap in Indian Scenario
Emperor International Journal of Finance and Management Research [EIJFMR] Page 91 across any study conducted on RBI announcements
on monetary policy on pricing of shares for the period 2012-2015
Statement of Problem
The changes in the key ratios and rates of RBI affect the behaviour of businesses but also the capital market. Monetary policy instruments are used for affecting the liquidity in the system and also cost of borrowing. The two apex bodies of the country the SEBI and RBI play role in shaping the economy of the country. Are the functions of these bodies in correlation with each other? Does the decision of one body affect the other or not is of utmost importance to know the rhythm of the capital market and monetary policy in India. In the past the process of monetary policy of RBI has undergone a tremendous change and so in the regulations of SEBI. Studying the capital market efficiency is an ongoing study which held the various stake holders to take decisions on trading in the capital market. Keeping this mind the present study has made an attempt to analyse the impact of key ratios of monetary policy on bank stock prices.
Objectives
1. To study the market efficiency with respect to announcements of key ratios of monetary policy on shares of banking industry
2. The study the stock returns between pre and post announcement period.
Time Period of the Study
Time period post liberalisation from 2012-2015. Data Sources
The Historical data was collected from authenticated sources like – Reserve Bank Of India, National Stock Exchange, Respective Banks / Companies’ official web sites and also using the proprietary repositories of PROWESS-CMIE licensed
to the Academic Library of St. Joseph’s College of Business Administration, Bangalore.
Sampling Strategy
The sample chosen for the study includes all announcements made by RBI on Bank rate, SLR, REPO and Reverse REPO for the period 2012-2015. The impact of these announcements is analyzed on top 10 banks listed on BANK NIFTY index.
Methodology
In this study, event study methodology has been used to calculate abnormal returns (AR), Average abnormal return (AAR) and cumulative average abnormal return (CAAR) around the monetary policy announcements. The study uses an event window of 42 days i.e., 21 days prior and 21 days after the event day. The event day is the date on which RBI has announced the change in key ratios of monetary policy. It is defined as t=0, 21 days before the event date are designed -21 to -1 and 21 days after the event day are designed as +1 to +21.
In the present study daily closing prices of bank stock and bank index are being used to analyze the impact of announcements of key ratios on bank stock prices. The daily returns for each of the bank stock prices for the event window period are computed as
Rat = (Pit – Pit-1) / Pit-1
Where Pit and Pit-1 are respectively daily closing prices for the bank i at time t and t-1, the actual returns for the market/ index are also computed as Rmt = (Iit – Iit-1) / Iit-1
Where Iit & Iit-1 are respectively daily closing index values at time t and t-1. The expected returns on a stock have been estimated using the market model of Sharpe (1964).
Rit = αi +βi Rmt +εit
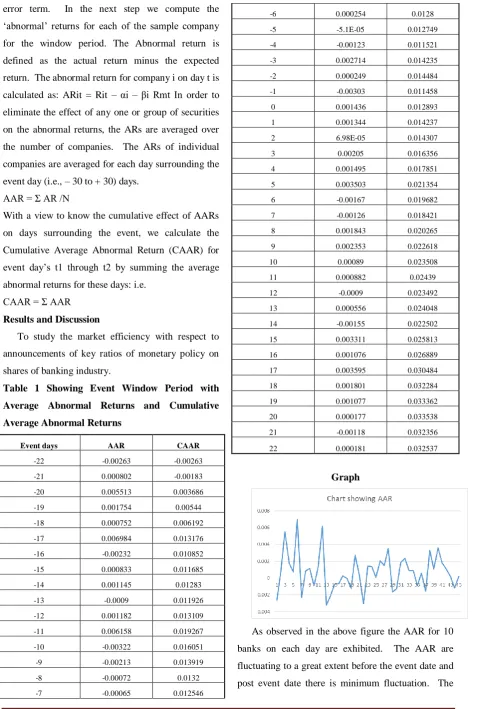
Emperor International Journal of Finance and Management Research [EIJFMR] Page 92 error term. In the next step we compute the
‘abnormal’ returns for each of the sample company for the window period. The Abnormal return is defined as the actual return minus the expected return. The abnormal return for company i on day t is calculated as: ARit = Rit – αi – βi Rmt In order to eliminate the effect of any one or group of securities on the abnormal returns, the ARs are averaged over the number of companies. The ARs of individual companies are averaged for each day surrounding the event day (i.e., – 30 to + 30) days.
AAR = Ʃ AR /N
With a view to know the cumulative effect of AARs on days surrounding the event, we calculate the Cumulative Average Abnormal Return (CAAR) for event day’s t1 through t2 by summing the average abnormal returns for these days: i.e.
CAAR = Ʃ AAR Results and Discussion
To study the market efficiency with respect to announcements of key ratios of monetary policy on shares of banking industry.
Table 1 Showing Event Window Period with
Average Abnormal Returns and Cumulative
Average Abnormal Returns
Event days AAR CAAR
-22 -0.00263 -0.00263
-21 0.000802 -0.00183
-20 0.005513 0.003686
-19 0.001754 0.00544
-18 0.000752 0.006192
-17 0.006984 0.013176
-16 -0.00232 0.010852
-15 0.000833 0.011685
-14 0.001145 0.01283
-13 -0.0009 0.011926
-12 0.001182 0.013109
-11 0.006158 0.019267
-10 -0.00322 0.016051
-9 -0.00213 0.013919
-8 -0.00072 0.0132
-7 -0.00065 0.012546
-6 0.000254 0.0128
-5 -5.1E-05 0.012749
-4 -0.00123 0.011521
-3 0.002714 0.014235
-2 0.000249 0.014484
-1 -0.00303 0.011458
0 0.001436 0.012893
1 0.001344 0.014237
2 6.98E-05 0.014307
3 0.00205 0.016356
4 0.001495 0.017851
5 0.003503 0.021354
6 -0.00167 0.019682
7 -0.00126 0.018421
8 0.001843 0.020265
9 0.002353 0.022618
10 0.00089 0.023508
11 0.000882 0.02439
12 -0.0009 0.023492
13 0.000556 0.024048
14 -0.00155 0.022502
15 0.003311 0.025813
16 0.001076 0.026889
17 0.003595 0.030484
18 0.001801 0.032284
19 0.001077 0.033362
20 0.000177 0.033538
21 -0.00118 0.032356
22 0.000181 0.032537
Graph
Emperor International Journal of Finance and Management Research [EIJFMR] Page 93 highest positive and negative AAR during the
window period has been +0.006 and – 0.003. On the event date or day 0 the AAR has stood at + 0.0014 which shows that the monetary policy announcements has given a positive impact on the share prices of banks. The graph shows that the AAR post the event
day has stabilised. It can be concluded that the announcements has given a positive impact on the share prices of the banks. There is a clear evidence of semi strong form of efficiency in the Indian capital market to announcements of key rates of RBI.
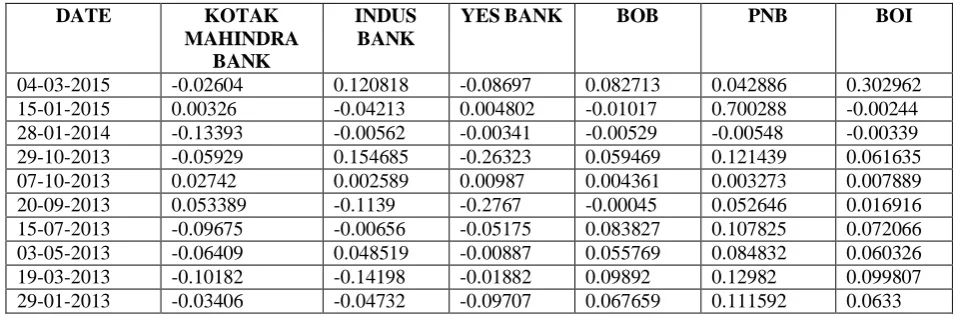
Table 2 Abnormal Returns for the Event Dates as Summarized below for the Banking sector.
Among the calculated abnormal returns of all the banks in the sample the abnormal returns on the day of announcement is chosen and analysed the above table denotes the abnormal returns for all top 10 banks from Bank Nifty index on the event day that is the day on which the announcement is made.
It can be observed that on 29.01.2013 four banks shown positive abnormal returns and six banks shown negative abnormal returns. Hence, it can be inferred these four banks that is SBI, BOB, PNB, and BOI have gained on the event date.
Where 19.03.2103 six banks has shown positive abnormal returns and four banks shown negative abnormal returns. Hence, it can be inferred these six banks that is ICICI, SBI, AXIS, BOB, PNB, and BOI have gained on the event date.
On 03.05.2013 five banks shown positive abnormal returns and five banks shown negative abnormal returns. Hence, it can be inferred these five banks that is HDFC, INDUSIND BANK, BOB, PNB, and BOI have gained on the event date.
On 15.07.2013 six banks shown positive abnormal returns and four banks shown negative abnormal returns. Hence, it can be inferred these six banks that is ICICI, HDFC, SBI, BOB, PNB, and BOI have gained on the event date.
On 20.09.2013 five banks shown positive abnormal returns and five banks shown negative abnormal returns. Hence, it can be inferred these five banks that is HDFC, SBI, KOTAKMAHINDRA, PNB, and BOI have gained on the event date.
On 07.10.2013 eight banks shown positive abnormal returns and two banks shown negative abnormal returns. Hence, it can be inferred these eight banks that is HDFC, SBI, KOTAK MAHINDRA, INDUSIND BANK, YES BANK, BOB, PNB, and BOI have gained on the event date.
On 29.10.2013 six banks shown positive abnormal returns and four banks shown negative abnormal returns. Hence, it can be inferred these six banks that is HDFC, SBI, INDUSIND BANK, BOB, PNB, and BOI have gained on the event date.
DATE KOTAK
MAHINDRA BANK
INDUS BANK
YES BANK BOB PNB BOI
04-03-2015 -0.02604 0.120818 -0.08697 0.082713 0.042886 0.302962
15-01-2015 0.00326 -0.04213 0.004802 -0.01017 0.700288 -0.00244
28-01-2014 -0.13393 -0.00562 -0.00341 -0.00529 -0.00548 -0.00339
29-10-2013 -0.05929 0.154685 -0.26323 0.059469 0.121439 0.061635
07-10-2013 0.02742 0.002589 0.00987 0.004361 0.003273 0.007889
20-09-2013 0.053389 -0.1139 -0.2767 -0.00045 0.052646 0.016916
15-07-2013 -0.09675 -0.00656 -0.05175 0.083827 0.107825 0.072066
03-05-2013 -0.06409 0.048519 -0.00887 0.055769 0.084832 0.060326
19-03-2013 -0.10182 -0.14198 -0.01882 0.09892 0.12982 0.099807
Emperor International Journal of Finance and Management Research [EIJFMR] Page 94 On 28.01.2014 two banks shown positive
abnormal returns and eight banks shown negative abnormal returns. Hence, it can be inferred these two banks that is SBI, AXIS BANK, have gained on the event date.
On 15.01.2015 seven banks shown positive abnormal returns and three banks shown negative abnormal returns. Hence, it can be inferred these seven banks that is ICICI, HDFC, SBI, AXIS, KOTAK MAHINDRA, YES BANK and PNB have gained on the event date.
On 04.03.2015 seven banks shown positive abnormal returns and three banks shown negative abnormal returns. Hence, it can be inferred these seven banks that is ICICI, AXIS BANK, INDUSIND, SBI, BOB, PNB, and BOI have gained on the event date.
From the above it can be inferred that SBI, BOB, PNB and BOI have had positive abnormal returns on almost all event dates announced by RBI.
Hypothesis
H0: There is no significant difference in the distribution patterns of the returns
H1: There is significant difference in the distribution patterns of the returns
Wilcoxon Signed Rank Test
Hypothesis:
H0: The difference between the pair do not follow a symmetric distribution around zero.
H1: The difference between the pair follow a symmetric distribution around zero.
Name of the Company Period Mean std devi Sig.
Indusind_1a before .00239 .0111 .858
after .00134 .0101
SBI_1a before .00375 .0031 .758
after .00406 .0020
AXIS_1a before .00147 .0075 .338
after .00339 .0042
BOB_2a before -.00003 .0026 .158
after .00652 .0252
PNB_2a before .01158 .0514 .733
after .00262 .0075
BOI_2a before .00080 .0112 .072
after .00798 .0157
SBI_2a before .00357 .0014 .733
after .00365 .0023
AXIS_3a before .00060 .0030 .072
after -.00151 .0035
Indusind_4a before .00568 .0071 .548
after .01103 .0221
PNB_4a before .00710 .0085 .910
after .00756 .0207
BOI_4a before .00108 .0043 .910
Emperor International Journal of Finance and Management Research [EIJFMR] Page 95
ICICI_4a before -.00021 .0012 .615
after -.00003 .0012
AXIS_4a before -.00180 .0048 .242
after .00039 .0057
YES_5a before .01302 .0814 .783
after .00649 .0285
SBI_5a before .00079 .0028 .858
after .00071 .0019
YES_6a before -.00744 .0265 .263
after .00022 .0118
SBI_6a before .00061 .0012 .783
after .00028 .0007
Indusind_7a before -.00073 .0116 .338
after -.00629 .0134
BOB_7a before .00125 .0016 .548
after .00143 .0021
Indusind_8a before .00069 .0047 .189
after .00001 .0043
BOB_8a before .00060 .0022 .263
after .00130 .0024
YES_9a before -.00053 .0020 .036
after -.00151 .0019
BOB_10a before .00075 .0011 .115
after .00139 .0016
AXIS_10a before -.00037 .0032 .338
after .00132 .0051
III. CONCLUSION
The study concludes that the announcements of key monetary policy rates by RBI has brought significant changes in the share prices of top banks
REFERENCE
[1] Nick von Gersdorff, D. F. (2008). US mergers and acquisitions : A test of market efficiency. Journal of Finance and Accountancy , Pg 1-9.
[2] Norden, S. V. ( 1993. ). " Regime Switching in Stock Market Returns", International Conference on Financial Market Dynamics and. Economics Department, Carleton University, .
[3] Nunn kenneth, H. j. (June 1986). "Corporate bond price data sources and return/risk measurement".
Journal of finance and quantitative analysis , Vol 21, No.2, 197-208.
[4] Srivastava Aman, (December, 2010). "Relevance of Macro Economic factors for the Indian Stock Market". Decision , Vol. 37, No.3.