Estimating the Probability of Project Completion
by SIM_DEL Estimator
Dr. P.K.Suri, Pallavi Ranjan
Haryana College of Technology and Management, Kaithal, Haryana, India
Abstract— Software has a far ranging nature and sometimes it is difficult to predict the cost. So, it was demanded to develop some useful models that predict the accurate cost, schedule and quality of a software product. There is a great need to accurately predict the cost by selecting the appropriate estimation method. Expert Based Judgment is quite successful. Wideband Delphi estimation comes under this category. This paper is aimed at implementing a simulator in C language which estimates the probability of a successful project completion. Feeding PERT (Project Evaluation and Review Technique) onto the WBD (Wideband Delphi Estimation) Process gives the required probability. Input to the process i.e. optimistic, pessimistic and most likely time for each module is given by the experts based on their highly specific knowledge.
Keywords— WBD, PERT, Simulator, Estimation, Accuracy, Optimistic, Pessimistic, Expert
I. INTRODUCTION
Software development effort estimation is the process of predicting the most realistic use of effort required to develop or maintain software based on incomplete, uncertain or noisy input. It is the process of forecasting or approximating the time and cost of completing project deliverables. Effort estimation has been a critical task for a software project that has attracted a considerable amount of research within software engineering, but no approach has provided consent to produce accurate effort estimates for successful software projects [38, 11]. Software has a far ranging nature and due to lack of powerful, satisfactory techniques, software engineering practitioners continuously fail to accurately predict the cost. So there was a great need to develop useful models that explain the software development life cycle and predict the accurate cost, schedule and quality of a software product. Models can be classified into two categories- algorithmic and non-algorithmic. Both of them have pros and cons. A key factor in selecting the estimation model is accuracy of the estimates, as cost and schedule overruns are not uncommon on large scale software.
A. Need of Accurate Estimation
It is necessary for defining the resources needed to produce, verify and validate the software products for managing software development activities.
It can help to classify and prioritize development projects with respect to an overall business plan. It can be used to determine what resources to commit
to the project and how well these resources will be used.
It can be used to assess the impact of changes and support re-planning.
Projects can be easier to manage and control when resources are better matched to real needs.
Customers expect actual development costs to be in line with estimated costs.
Fig.1 Cost Estimation Process
B. Problems with Poor Estimation
1. Under estimation: In case of underestimate, the
software organization will make a loss and also delay the delivery of software. The delay can cause disruption to the user organization and also invites penalty on the software organization.
2. Estimation occurs at wrong time: Most estimates are
made at the beginning of a project, before requirements are defined and thus before the problem is understood. Every software is unique, and it is impossible to estimate software accurately, when it’s being done for the first time.
3. Estimated time is always used: Most programmers
also tend to spend the allocated time on a task. If something is estimated to take two days, the programmer makes sure that it takes two days. Even if he finishes early, he will tune and polish his solution, or just slack off, until the allocated time is spent. This creates a situation, where nothing gets done faster than the estimates, but some things will take longer than the estimates.
4. Business relies on estimations too heavily: Some
companies the whole sales and marketing departments rely so heavily on estimations that any kind of delay will cause major problems for the company.
5. Wrong people do the estimates: Estimates should be
made by the programmers themselves. Sometimes team leads can do the estimates for them, but the game is lost, if someone with an MBA does the estimates. Run and don’t look back, if this happens in your company. 6. Measurement problems: Estimating the size of the
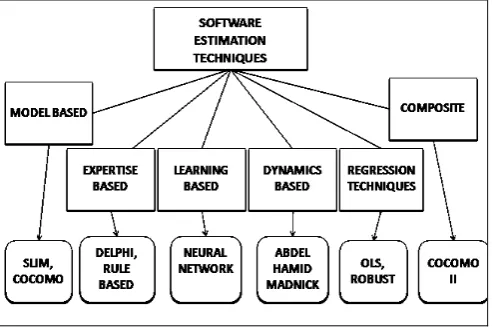
II. SOFTWARE ESTIMATION TEHNIQUES
Significant Research was carried out by Boehm in software cost modelling which began with the extensive 1965 study of the 105 attributes of 169 software project. This led to some useful partial models in the late 1960s and early 1970s. Although much work was carried on developing models of cost estimation, all of them were in same dilemma: “It was very difficult to predict the accurate cost of software development as software grew in size and importance it also grew in complexity.” The fast changing nature of software development has made it very difficult to develop parametric models that yield high accuracy for software development in all domains. Software development costs continue to increase and practitioners continually express their concern over their ability to predict accurately the costs involved. This was a major pitfall experienced. Development of useful models that constructively explain the development life-cycle and accurately predict the cost of developing a software product was a major objective. Hence, many Software estimation models have been evolved.
Fig 2 Software Estimation Techniques
A. Selecting an estimation method
Formal software development effort estimation model have been around for more than 40 years. They are often used in many software engineering books, user friendly tools. In spite of this massive effort and promotion, formal estimation models aren’t in much use. 10 out of the 16 studies reviewed in “Estimation of Software Development Work Effort: Evidence on Expert Judgment and Formal Models” [11] report that using judgment based effort estimation methods led to more accurate effort estimates than using sophisticated formal models.
Second, little work has been done on judgment based effort improvement process. Most of the software industry use judgment based estimation methods. Third, an important reason for the rejection of formal
models might be that experts’ highly specific knowledge—for example, about the developers who are supposed to do the work—frequently can’t be included properly as model input. It’s understandably difficult to trust an estimation method unable to make use of strongly relevant information. It’s hardly possible to unite highly specific knowledge with the
need to establish general relationships in formal models; that is, this limitation isn’t a question of improved models. In short, there are very good reasons to claim that future estimation process improvement and research initiatives should aim at better judgment-based effort estimation processes and not at better formal models.
Fourth, All meaningful estimation models require judgment to produce the input to the models. This might include judgment of complexity, team skill, and the customers’ requirements for the system. This means that software companies benefit from a stronger focus on better judgment-based processes—even when they choose to apply estimation models, for example, in combination with expert judgment.
Fifth, Accuracy of judgment based effort estimation is not up to the mark i.e. far from perfect. For example, they frequently involve a high degree of wishful thinking and inconsistency. The surprising observation is therefore that estimation models haven’t managed to produce more accurate effort estimates. This observation is even more surprising when you consider that models seem to outperform expert judgment in most other disciplines [21].
Finally, according to Magne [11], Judgment-based estimates tend to have a higher degree of wishful thinking. A major advantage of a parametric model is
that it doesn’t modify its estimates when customers, managers, or marketers apply pressure. The only way you can get a parametric model to reduce its estimates is by going on record to make a visible change in the project’s estimated size or in its productivity-driver parameter ratings. Thus, using a calibrated parametric model enables negotiation of the price of a software development contract to be driven by objective adjustment of project size or productivity-driver parameters, rather than by a contest of wills between self-described experts.
For known projects and projects parts, we should use expert judgment method or analogy method if the similarities of them can be got, since it is fast and under this circumstance, reliable.
Using multiple people to estimate is better than one person, it increases the chances of identifying issues that some people may miss, as group sizes increase, the potential for communication failures increases at a faster rate.
III. PROJECT ESTIMATION:WIDEBAND DELPHI (WBD)
A. History
Delphi method was developed in 1950’s by the RAND Corporation Santa Monica, California, in Operations research. [61] It came from Delphi oracle, “Delphi” is a name which was intentionally coined by Kaplan, an associate professor of philosophy at the UCLA working for the RAND Corporation in a research effort directed at improving the use of expert pre-dictions in Policy-making. The foundation of the temple at Delphi and its oracle took place before recorded history. Greeks and some other people came to Delphi to consult the prophetess, who was known as Pythia. Her words were taken to reveal the rules of god. Pythia’s function was to tell the divine purpose in a normative way in order to shape coming events. One should consider that the Delphi monastery was one of the very few spots on the earth where knowledge was accumulated, ordered and preserved. The information came in from the ambassadors through their queries and the answers were written down on metal or stone plates, several of them found by archaeologists. The temple was the locus of knowledge, or, if we put it more mundanely, the Delphic oracle was probably the largest database of the ancient world. The priests could read and write; who else could do so in Greece? If due allowance is made for these circum-stances, modern psychology will find no special difficulties in accounting for the operations of the Pythia and of the priests interpreting her utterances. Knowledge was intended to be used and disseminated to make the world better.
B. Definition
'Standard-Delphi-Method' in the following way: 'It is a survey which is steered by a monitor group, comprises several rounds of a group of experts, who are anonymous among each other and for whose subjective-intuitive prognoses a consensus is aimed at. After each survey round, a standard feedback about the statistical group judgment calculated from median and quartiles of single prognoses is given and if possible, the arguments and counterarguments of the extreme answers are fed back...' [59]
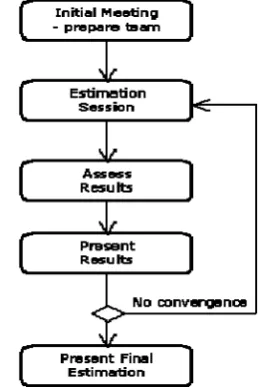
C. The Process
Figure 3 shows the activities undertaken when performing WBD for a project.
Initially, all participants must understand the objectives of the technique.
During the estimation process each individual will use a standard form to record their estimation figures and any notes deemed relevant. The estimation session will continue until each individual has produced estimation figures, at which point facilitator retrieves the figures.
The facilitator assesses the estimates and prepares a presentation including all the estimation figures, task list based upon system requirements, any identified factors affecting the task estimation process. A simple graph or table should be used to capture these figures.
If convergence has not been achieved, then facilitator will present the estimates and task list to the projected team. All estimators recognize the valid tasks that have been missed and any other factors that are necessary to be taken.
Fig. 3 Wideband Delphi Estimation Process Flow
The estimates plotted may look something like the following:
Fig. 4 Estimates after different rounds
You can apply one or both of two established methods; the three point method, also known as weighted average, and the nominal or Delphi method. In the three point method, you survey your experts about a task and ask them to come up with the best case duration, the worst case duration, and the most likely. Average them all out and apply them to the formula:
Work effort = [(Best Case) + (Worst Case) + (Most Likely x 4)] / 6
D. WBD Strengths
It is a simple technique not requiring estimation experts. Applicable to original projects where no previous
metrics exist
The process is an inclusive approach using all the project team to perform an active role in estimation Estimation figures are produced by team consensus
through estimation iteration sessions. More likely to mitigate impact of large individual errors
An expert judgment driven technique using developers to estimate. They are most likely to understand technical complexity and challenges when considering the requirements in context
E. WBD Weaknesses
Must have strong facilitator for estimation sessions to remain unbiased
IV.PERT
(Project) Evaluation and Review Technique (PERT) is a project management tool used to schedule, organize, and coordinate tasks within a project. It is basically a method to analyze the tasks involved in completing a given project, especially the time needed to complete each task, and to identify the minimum time needed to complete the total project. In the network analysis, it is implicitly assumed that the time values are deterministic or variations in time are insignificant. This assumption is valid in regular jobs such as maintenance of a machine etc., construction of building or road, planning for production, as these are done from time to time and various activities could be timed very well. However, in research projects or design of a gear box of a new machine, various activities are based on judgment. A reliable time estimate is difficult to get because the technology is changing rapidly. Time values are subject to chance variations.
A. Objective
The main objective of PERT is to find out the completion for a particular event within specified date. If yes, what are the chances of completing a job? The PERT approach
takes into account the uncertainties. In this approach, three time values are associated with each activity: the optimistic value, the pessimistic value, and the most likely value. These three time values provide a measure of uncertainty associated with that activity.
B. Description
PERT planning involves the following steps that are described below:
1. Identify the specific activities and milestones. The
activities are the tasks required to complete a project. The milestones are the events marking the beginning and the end of one or more activities. It is helpful to list the tasks in a table that in later steps can be expanded to include information on sequence and duration.
2. Determine the proper sequence of the activities. This
step may be combined with the activity identification step since the activity sequence is evident for some tasks. Other tasks may require more analysis to determine the exact order in which they must be performed.
3. Construct a network diagram. Using the activity
sequence information, a network diagram can be drawn showing the sequence of the serial and parallel activities. Each activity represents a node in the network, and the arrows represent the relation between activities. Software packages simplify this step by automatically converting tabular activity information into a network diagram.
4. Estimate the time required for each activity. Weeks
are a commonly used unit of time for activity completion, but any consistent unit of time can be used. A distinguishing feature of PERT is its ability to deal with uncertainty in activity completion time. For each activity, the model usually includes three time estimates:
Optimistic time – generally the shortest time in which the activity can be completed. It is common practice to specify optimistic time to be three standards deviations from the mean so that there is a approximately a 1% chance that the activity will be completed within the optimistic time. This is denoted by t (o).
Most likely time – the completion time having the highest probability. Note that this time is different from the expected time. It is denoted by t (m).
Pessimistic time – the longest time that an activity might require if everything goes wrong. This is denoted by t (p).
PERT assumes a beta probability distribution for the time estimates. For a beta distribution, the expected time for each activity can be approximated using the following weighted average:
Expected time = (Optimistic + 4 * Most likely + Pessimistic) / 6
Fig. 4 Time Distribution Curve
This expected time may be displayed on the network diagram. To calculate the variance for each activity completion time, if three standard deviation times were selected for the optimistic and pessimistic times, then there are six standard deviations between them, so the variance is given by:
2= [(Pessimistic - Optimistic) / 6]2
5.Determine the critical path. The critical path is
determined by adding the times for the activities in each sequence and determining the longest path in the project. The critical path determines the total calendar time required for the project.
6.Update the PERT chart as the project progresses. Make adjustments in the PERT chart as the project
progresses. As the project unfolds, the estimated times can be replaced with actual times. In cases where there are delays, additional resources may be needed to stay on schedule and the PERT chart may be modified to reflect the new situation.
The expected duration of the project and variance can be known easily by using the formulas. If the exact probability distribution of the path is known, it would have been easy to find out the probability of completing the project in a given time. Since the variance of the path is known, the CHEBYCHEV INEQUALITY could be used to get an estimate of probability for as given duration:
Di=
Prob [project duration x days] =?
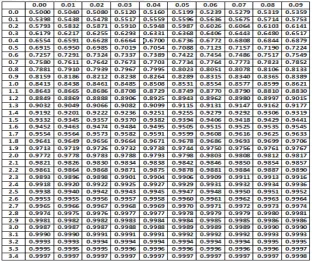
Prob [Z<= Di] = q [can be checked by Normal
Distribution Table]
C. Benefits
PERT is useful because it provides the following information:
Expected project completion time
Probability of completion before a specified date The critical path activities that directly impact the
completion time
Activity start and end date.
D. Prerequisites
Personnel should already have a good understanding of formal project management terminology, tools, and techniques
PERT form template of equivalent tool (e.g. software)
Choose the most appropriate scheduling method Select and organize a team to perform project tasks.
E. Limitations
The activity time estimates are somewhat subjective and depend on judgment. In cases where there is little experience in performing an activity, the numbers may be only a guess. In other cases, if the person or group performing the activity estimates the time there may be bias in the estimate.
Even if the activity times are well-estimated, PERT assumes a beta distribution for these time estimates, but the actual distribution may be different.
Even if the beta distribution assumption holds, PERT assumes that the probability distribution of the project completion time is the same as that of the critical path. Because other paths can become the critical path if their associated activities are delayed, PERT consistently underestimates the expected project completion time.
The underestimation of the project completion time due to alternate paths becoming critical is
perhaps the most serious of these issues. To overcome this limitation, Monte Carlo simulations can be performed on the network to eliminate this optimistic bias in the expected project completion time.
V. PROPOSED WORK
Estimating the probability of project completion by design of “SIM_DEL” Simulator in “C”
A. Algorithm
1. Identify the Expert Panel and arrange the session. Goto Step 2
2. KICKOFF MEETING:
Discuss Core Responsibilities, WBS and Project Risks.
Discuss the available resources for project. Provide estimation checklist to experts and
provide opportunity to discuss it. Goto Step 3
3. Experts give us initial estimates by judging the information. Goto Step4
4. DELPHI ESTIMATION MEETING:
Each expert gives us the optimistic t(o), pessimistic t(p) and most likely time t(m). Average estimate is calculated and
communicated to the Panel Differences are observed.
o If the difference is major:
{Expert with the widest deviation from mean is asked to explain how he came across this}. Go to Step 4 again
o Else
{Go to Step 5}
5. SIM_DEL ESTIMATOR
Expected Time t(e) and Standard Deviation is calculated
t (e) =
Determine the Early Start Time
o Initial Event is supposed to occur at time
equal to zero i.e. E1=0
o Next event is supposed to occur when
preceding activities are completed. The earliest time Ej for node j is given by Ej =
i [Ei + Dij] where I is a collection of nodes which precede node j.
o Repeat this step for next eligible activity
until the end node is reached. Determine Critical Path
o It determines the sequence of critical
activities. It is the longest path from starting event to ending event.
Estimate the Probability of Project completion
Di=
Prob [project duration x days] =?
Prob [Z<= Di] = q [can be checked by Normal
Distribution Table]
VI.RESULTS
VII. CONCLUSION AND FUTUREWORK
If this project is performed 100 times under the same conditions, there will be 30 chances when this job would take 41.5 weeks or less to complete it. As an alternative to the PERT technique and to provide a greater degree of flexibility in specifying likely activity durations, we can use MONTE- CARLO SIMULATION techniques to evaluate the risks of not achieving deadlines. It involves calculating the activity completion times, each time selecting estimated activity times randomly (RANDOM No.) From a set of estimates.
Scheduled time of completing the event is 41.5 weeks. Therefore the distance in standard deviations:
D(i) = [41.5 – 42.8] / √6.12 = -0.52 P[Z>= -0.52] = 1-P[Z<=0.52]= = 1- 0.70 = 0.30
ACKNOWLEDGMENT
Sincere Thanks to HCTM Technical Campus Management Kaithal- 136027, Haryana, India for their constant encouragement.
REFERENCES
[1] Albrecht, A.J., October 1979. “Measuring Application Development Productivity”, Proc. Joint SHARE, GUIDE, and IBM Application Development Symp.
[2] Albrecht, A.J., AD/M Productivity Measurement and Estimate Validation, IBM Corporate Information Systems, IBM Corp., Purchase, New York.
[3] Andrew Stellman & Jennifer Greene Applied Software Project Management Estimation, http://www.stellman-greene.com [4] Armstrong, J. S., W. B. Denniston, and M.M. Gordon, "The Use of
the Decomposition Principle in Making Judgments." Organizational Behaviora and Human Performance, 14 (1975), 257-263.
[5] J. D. Aron, Estimating Resource for Large Programming Systems, NATO Science Committee, Rome, Italy, October 1969.
[6] Banker, R. D., H. Chang, et al. (1994). "Evidence on economies of scale in software development." Information and Software Technology 36(5): 275-282.
[7] Barbara A. Kitchenham, Tore Dybå, Magne Jørgensen. 2004. IEEE Proceedings of the 26th International Conference on Software Engineering (ICSE’04)
[8] Barbara Kitchenham, Emilia Mendes. 2009. Why Comparative Effort Prediction Studies may be Invalid © ACM 2009 ISBN: 978-1-60558-634-2.
[9] Bergeron, F. and J. Y. St-Arnaud (1992). "Estimation of information systems development efforts: a pilot study." Information and Management 22(4): 239-254.
[10] Boehm, B., C. Abts and S. Chulani, “Software development cost estimation approaches – A survey”, Annals of Software Engineering, 10, pp. 177-205, 2000.
[11] Boehm, 1981 “Software Engineering Economics”, Prentice Hall.
[12] Boehm B.W. and W.Royce. Nov 1988. “Ada COCOMO and Ada
Process Model”, Proc. 3rd International COCOMO Users Meeting, Software Engineering Institute, Pittsburgh, Nov 1987, plus refinements presented at the Fourth International COCOMO Users Group Meeting.
[13] Boehm, B. W. and P. N. Papaccio, 1988. Understanding and controlling software costs. IEEE Transactions on Software Engineering 14(10): 1462-1477.
“COCOMO, Ada COCOMO and COCOMO 2.9” by Barry Boehm in the proc. 9th Int’l COCOMO Estimation Meeting.
[15] F.Brooks, 1975. The Mythical Man-Month; Essays on Software Engineering. Addison-Wesley, Reading, Massachusetts.
[16] Capers Jones, Chief Scientist Emeritus Software Productivity Research LLC. Version 5 – February 27, 2005. How Software Estimation Tools Work.
[17] Chatzoglou, P. D. and L. A. Macaulay (1998). "A rule-based approach to developing software development prediction models." Automated Software Engineering 5(2): 211-243.
[18] Cockcroft, S. (1996). "Estimating CASE development size from outline specifications." Information and Software Technology 38(6): 391-399.
[19] Conte S.D., H.E. Dunsmore, and V.Y. Shen, 1986. Software Engineering Metrics and Models, Benjamin Cummings, Menlo Park, Calif.
[20] 9. R.M. Dawes, D. Faust, and P.E. Meehl, “Clinical versus Actuarial Judgment,” Science, vol. 243, no. 4899, 1989, pp. 1668– 1674
[21] DeMarco, T., Controlling Software Projects: A 4anagement, Measurement, and Estimation. Yourdon Press, New York, 1982. [22] DeMarco, T., 1982, Controlling Software Projects, Yourdon Press,
Englewood Cliffs, N.J.
[23] M. V. Deshpande, S. G. Bhirud. August 2010. Analysis of Combining Software Estimation Techniques. International Journal of Computer Applications (0975 – 8887)
[24] Dolado, J. J. (2000). "A validation of the component-based method for software size estimation." IEEE Transactions on Software Engineering 26(10): 1006-1021
[25] Software Effort and Schedule Estimation, Faghih Farshad,
University of Calgary,1997,http://www.enel.ucalgary.ca/People/Smith/619.94/pre
v689/1997.94/reports/farshad.htm
[26] Fredrick P.Brooks, 1975. The Mythical Man Month, Addison Wesley.
[27] Allan J. Alberecht and John E. Gaffhey, November 1983, Software Function, Source Lines of Code and Development Effort Prediction : A software Science Validation . IEEE transactions on Software Engineering.
[28] Gaffney, J.E., Jr., 1996. “Software Cost Estimation using Simplified Function Points, “ Proc. 8th Ann. Software Technology Conf. [29] Gray, A. and S. MacDonell (1996), “A Comparison of Techniques
for Developing Predictive Models of Software Metrics,”
Information and Software Technology 39, 1997.
[30] Halstead, M.H. 1977. Elements of Software Science, Elsevier, NewYork.
[31] Ali Idri, Alain Abran, Taghi M. Khosgoftaar. 2001. Fuzzy Analogy- A New Approach for Software Cost Estimation. International Workshop on Software Measurement (IWSM’01).
[32] Jensen, R.W., 1984, A Comparison of the Jensen and COCOMO Estimation Models,” Proc. Int’l Soc. Of Parametric Analysts, PO Box 6402, Chesterfield, MO 63006-6402, pp. 96-106.
[33] Jensen, R.W., 1996. “Management Impact on Software Cost and Schedule,” Crosstalk, pp. 6-10.
[34] Jones, C., 1986. The SPR Feature Point Method, Software Productivity Research, Inc., Software Productivity Research Inc., New England Executive Park,Burlington.
[35] 2. M. Jørgensen, “Estimation of Software Development Work Effort: Evidence on Expert Judgment and Formal Models,” Int’l J. Forecasting, vol. 23, no. 3, 2007, pp. 449–462.
[36] Jovan Popović1 and Dragan Bojić1. 2012. A Comparative
Evaluation of Effort Estimation Methods in the Software Life Cycle. ComSIS Vol. 9, No. 1, January 2012.
[37] Kemerer, C.F., “An empirical validation of software cost estimation models”, Communications of the ACM, 30:5, 1987.
[38] Software Cost Estimation: Metrics and Models, Johnson, Kim, University of Calgary, 1998.
[39] N.R. Sanders and L.P. Ritzman, “On Knowing When to Switch from Quantitative to Judgemental Forecasts,” Int’l J. Operations & Production Management, vol. 11, no. 6, 1991, pp. 27–37.
[40] The Comparison of the Software Cost Estimating Methods, University of Calgary, 1997.
[41] Magne Jørgensen, A Review of Studies on Expert Estimation of Software Development Effort, March 2002.
[42] Magne Jorgensen and Barry Boehm Software Development Effort Estimation: Formal Models or Expert Judgment? Published by the IEEE Computer Society 074 0-7459/09/$25.00©2009IEEE [43] Magne Jørgensen. May 2007 Forecasting of Software Development
Work Effort: Evidence on Expert Judgment and Formal Model. [44] Minkiewicz, A. and A. DeMarco, 1995. The PRICE Software
Model, Lockheed Martin PRICE Systems, Ste. 200, 700 East Gate Dr., Mt. Laurel, NJ 08054.
[45] Software Metrics: A Guide to Planning, Analysis, and Application, Pandian, C. Ravindranath, Auerback Publishers, 2003
[46] Park, R.E., 1988. The Central Equations of the PRICE Software Cost Model, Lockheed Martin PRICE Systems, Ste.200, 700 East Gate Dr., Mt. Laurel, NJ 08054.
[47] Parvinder S. Sandhu, Porush Bassi, and Amanpreet Singh Brar. 2008. Software Effort Estimation Using Soft Computing Techniques. World Academy of Science, Engineering and Technology 46 2008.
[48] Putnam, Lawrence H.; Ware Myers (2003). Five core metrics : the intelligence behind successful software management. Dorset House Publishing. ISBN 0-932633-55-2.
[49] Putnam, Lawrence H. (1978). "A General Empirical Solution to the Macro Software Sizing and Estimating Problem".IEEE transactions on Software Engineering, VOL. SE-4, NO. 4, pp 345-361. [50] Richard D. Stuzke, May 1996. Software Estimating Technology: A
Survey. Crosstalk.
[51] Samaresh Mishra1, Kabita Hazra2, and Rajib Mall3. October 2011. A Survey of Metrics for Software Development Effort Estimation. International Journal of Research and Reviews in Computer Science (IJRRCS)
[52] M. Jørgensen and M. Shepperd, “A Systematic Review of Software Development Cost Estimation Studies,” IEEE Trans. Software Eng.,
vol. 33, no. 1, 2007, pp. 33–53.
[53] Stein Grimstad*, Magne Jørgensen, Kjetil Moløkken-Østvold. 13 June 2005. Software effort estimation terminology: The tower of Babel. Information and Software Technology 48 (2006) 302–310 [54] Symons, C., 1991. Software Sizing and Estimating: Mark II FPA,
Wiley and Sons, New York.
[55] Robert C. Tausworthe, 1981. Deep Space Network Estimation Model, Jet Propulsion Report.
[56] Vahid Khatibi, Dayang N. A. Jawawi. 2010. Software Cost Estimation Methods: A Review. Journal of Emerging Trends in Computing and Information Science.
[57] Whitmire, S.A., Apr. 1995, 3D Function Points: Scientific and Real Time Extensions to Function Points, Boeing Airplane Company report BCS-G3252, dated 1992. It was published in the Proc. 1992 Pacific Northwest Quality Conference. A more accessible reference by the same author is “An introduction to 3D Function Points,” Software Development, p. 43.
[58] Wechsler, Wolfgang (1978): Delphi-Methode, Gestaltung und Potential für betriebliche Prognoseprozesse, Schriftenreihe Wirtschaftswissenschaftliche Forschung und Entwicklung, München.
[59] Wittig, G (1995), “Estimating Software Development Effort with Connectionist Models,” Working Paper Series 33/95, Monash University.