The Effect of Foundation Embedment on Seismic SSI Response of
EPR
TMNuclear Island Structures
Mansour Tabatabaie1), Basilio Sumodobila1), Calvin Wong2) and Todd Oswald3)
1) SC Solutions, Inc., Oakland, CA, U.S.A. 2) AREVA NP, Inc., San Jose, CA, U.S.A. 3) AREVA NP, Inc., Charlotte, NC, U.S.A.
ABSTRACT
This paper examines the seismic soil-structure interaction (SSI) response of the EPRTM nuclear island (NI) to assess
the effect of NI embedment on the structural response. Two SSI models corresponding to a surface-supported and embedded NI models are analyzed for ten generic soil cases and three postulated seismic ground motions adopted as part of the standard plant design certification. This paper presents the results of the SSI analyses and general conclusions regarding the effect of NI embedment on the buildings response.
INTRODUCTION
The EPRTM nuclear power plant is an advanced pressurized water reactor facility designed and developed by
AREVA NP, Inc. The plant consists primarily of a nuclear island (NI) and several other significant buildings outside the NI.
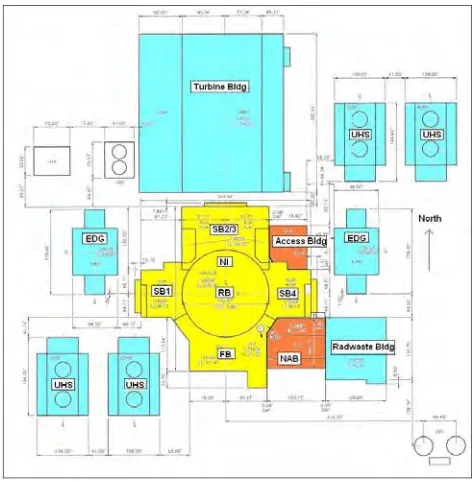
A plan view of the EPRTM structures is shown in Fig. 1. The structures within the NI consist of the reactor building (RB),
fuel building (FB), safeguard building 1 (SB1), safeguard building 2/3 (SB2/3) and safeguard building 4 (SB4). The nuclear island is embedded approximately 11.85m below ground surface. The standard plant design certification has adopted ten generic soil profiles that range from hard rock to stiff soil to soft soil conditions that are likely to be encountered at plant sites in the United States. Three sets of free-field seismic ground motions representing the rock/soil outcrop motions in the eastern United States are considered for the standard design. Each soil profile is associated with one or, and in a few cases, two of the seismic control motions.
The seismic SSI response of the NI is calculated for two cases of surface-supported and embedded NI to assess the effect of NI embedment on the structural response. This paper presents the seismic soil-structure interaction (SSI) analyses and selected results of the surface-supported and embedded NI models for the ten generic soil cases and three postulated seismic ground motions. Based on the results of all analysis cases, general conclusions on the effect of foundation embedment on the seismic response of NI structures are presented.
METHODOLOGY
The soil structure interaction analyses were performed using the computer program SASSI [1, 2 and 3]. SASSI uses finite element and complex frequency response method to calculate dynamic SSI response of structures founded in horizontally layered soils system over uniform soil/rock half-space. The primary soil material nonlinearity is the strain-compatible soil shear modulus and damping ratios. The seismic environment may consist of vertically or inclined propagating shear and compression waves, and horizontally propagating surface waves. The structure is modeled using standard finite elements with interaction nodes at the soil/structure interface.
Soil Model
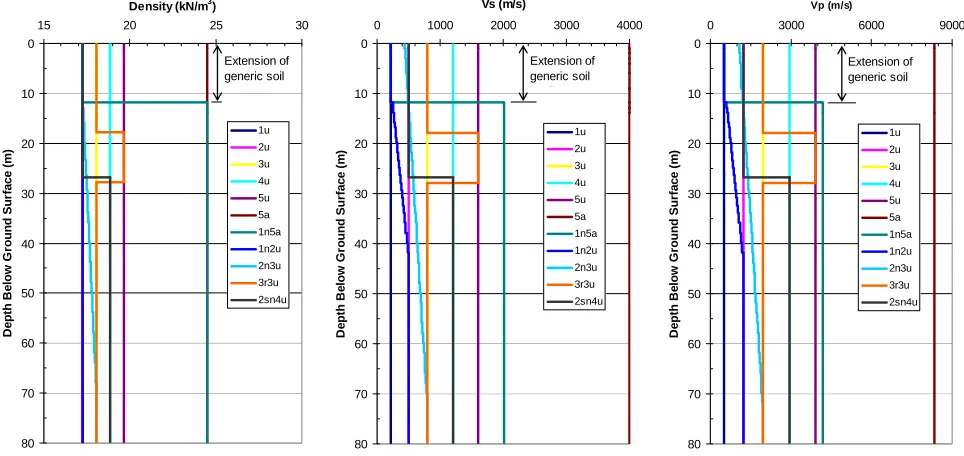
Ten generic soil profiles have been adopted for the seismic SSI response analyses as part of the EPRTM standard
design certification in the United States [4]. These profiles range from hard rock to stiff soil to soft soil conditions, and are designated as “1u”, “2u”, “3u”, “4u”, “5u”, “5a”, “1n2u”, 2n3u”, 2sn4u” and “3r3u”. For the SSI analyses of the surface-supported NI model, the top of the generic soil profiles is assumed at the base of NI (El. -11.85m); i.e. the soil layers between the ground surface and bottom of the NI basemat are ignored. For the embedded NI model, the generic soil profiles are extended 11.85m from the base of the structure (El. -11.85m) to the ground surface (El. 0.0m); i.e. the side soils between the bottom of NI and ground surface are included in the SSI model. The density and velocity profiles for the generic soil cases are shown in Fig. 2. The soil profiles “1u”, “2u”, “3u”, “4u” and “5u” represent uniform soil/rock halfspace with Vs=213, 500, 800, 1200 and 1600m/s, respectively. Soil case “5a” represents rigid base rock or fixed-base condition (Vs=4000 m/s). The “1n2u” and “2n3u” represent a layered site with stiffness increasing with depth from “1u” to “2u” and “2u” to “3u”, respectively. The “3r3u” is a uniform halfspace soil corresponding to “3u” with a stiff soil layer inclusion. The “2sn4u” comprises a medium stiff soil layer over stiff rock halfspace. In addition, a new soil case “1n5a” is defined for the embedded NI, which represents a hard rock profile (between “5u” and “5a”) with a soft backfill layer. In general, these profiles are expected to envelop the variations in soil layering and properties for potential plant sites in the eastern United States.
0
10
20
30
40
50
60
70
80
15 20 25 30
Density (kN/m3)
D
e
pt
h B
e
lo
w
G
ro
u
n
d
S
u
rf
ace (
m
)
1u 2u 3u 4u 5u 5a 1n5a 1n2u 2n3u 3r3u 2sn4u
Extension of generic soil
0
10
20
30
40
50
60
70
80
0 3000 6000 9000
Vp (m/s)
D
e
pth B
e
low
G
ro
un
d Sur
fa
c
e
(
m
)
1u 2u 3u 4u 5u 5a 1n5a 1n2u 2n3u 3r3u 2sn4u
Extension of generic soil 0
10
20
30
40
50
60
70
80
0 1000 2000 3000 4000
Vs (m/s)
D
e
pth B
e
low
G
ro
un
d Sur
fa
c
e
(
m
)
1u 2u 3u 4u 5u 5a 1n5a 1n2u 2n3u 3r3u 2sn4u
Extension of generic soil
fil
Fig. 2 – Generic Soil Profiles and Properties
Input Motions
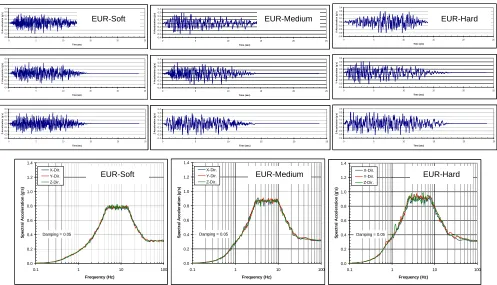
Three sets of three-component reference soil/rock outcrop motions corresponding to the bottom of NI basemat are used for the SSI analyses [4]. These motions are referred to as EUR Hard, EUR Medium and EUR Soft motions. The acceleration time histories and the 5%-damped acceleration response spectra of all three motions are shown in Fig. 3.
correspond to hypothetical soil/rock outcrop at the bottom of NI basemat (set at El. -11.85m). This ensures that both the surface and embedded NI models use consistent foundation input motions specified at the base of NI.
-0.4 -0.3 -0.2 -0.1 0.0 0.1 0.2 0.3 0.4
0 5 10 15 20 25
Time (sec) X -A c c e le ra ti o n (g 's ) -0.4 -0.3 -0.2 -0.1 0.0 0.1 0.2 0.3 0.4
0 5 10 15 20 25
Time (sec) Y -A c c e le ra ti o n (g 's ) -0.4 -0.3 -0.2 -0.1 0.0 0.1 0.2 0.3 0.4
0 5 10 15 20 25
Time (sec) Z-A cc e le ra ti on ( g' s) -0.4 -0.3 -0.2 -0.1 0.0 0.1 0.2 0.3 0.4
0 5 10 15 20 25
Time (sec) X -A c c e le ra ti o n (g 's ) -0.4 -0.3 -0.2 -0.1 0.0 0.1 0.2 0.3 0.4
0 5 10 15 20 25
Time (sec) Y -A c c ele ra ti o n ( g 's ) -0.4 -0.3 -0.2 -0.1 0.0 0.1 0.2 0.3 0.4
0 5 10 15 20 25
Time (sec) Z-A cc e le ra ti on ( g' s ) -0.4 -0.3 -0.2 -0.1 0.0 0.1 0.2 0.3 0.4
0 5 10 15 20 25
Time (sec) X -A c cel er a ti o n ( g 's ) -0.4 -0.3 -0.2 -0.1 0.0 0.1 0.2 0.3 0.4
0 5 10 15 20 25
Time (sec) Y -A cce le ra ti on ( g 's ) -0.4 -0.3 -0.2 -0.1 0.0 0.1 0.2 0.3 0.4
0 5 10 15 20 25
Time (sec) Z-A c c ele ra ti on ( g' s ) 0.0 0.2 0.4 0.6 0.8 1.0 1.2 1.4
0.1 1 10 100
Frequency (Hz) Sp ec tr al A c ce le ra ti o n ( g 's ) X-Dir. Y-Dir. Z-Dir.
Damping = 0.05
0.0 0.2 0.4 0.6 0.8 1.0 1.2 1.4
0.1 1 10 100
Frequency (Hz) Sp ect ra l A c ce le ra ti on ( g 's ) X-Dir. Y-Dir. Z-Dir.
Damping = 0.05
0.0 0.2 0.4 0.6 0.8 1.0 1.2 1.4
0.1 1 10 100
Frequency (Hz) S p e c tr al A c cel er a ti o n ( g 's ) X-Dir. Y-Dir. Z-Dir.
Damping = 0.05
Fig. 3 – Acceleration Time Histories and Response Spectra of Reference Motions
Structural Model
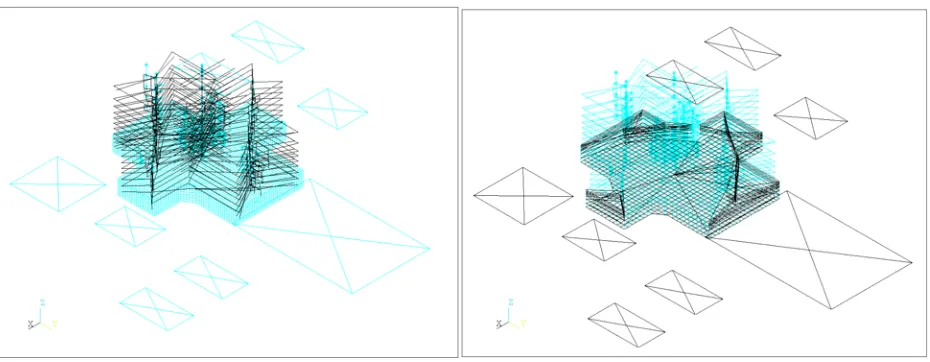
The surface-supported NI model consists of interconnected sticks of RB, FB, SB1, SB2/3 and SB4 structures (NI sticks) connected rigidly to a common NI rigid basemat [4], as shown in Fig. 4. The same NI stick model is used for the embedded NI model except that to model the effect of embedment on the sticks, a series of horizontal rigid links connect the side soil walls to the sticks below ground surface (see Fig. 5). The foundation is modeled with horizontal soil layers over uniform soil/rock halfspace with control motion applied as outcrop motion at the NI basemat level. It is noted that the embedded NAB and access building are located next to the NI but are separated by a small gap so that there is no transfer of loads between these buildings and NI. These structures are not included in the SSI model due to their relatively smaller masses as compared to those of the NI. The sidewalls adjacent to these buildings are not connected to side soil (see Fig. 5)
Fig. 4 – SASSI Structural Model of Surface-Supported NI NI NAB Access Bldg Turbine Bldg EUR-Medium
EUR-Soft EUR-Hard
Fig. 5 –SASSI Structural Model of Embedded NI
Site Response Analysis
Site response analyses were performed using program SHAKE for 13 combinations of soil profiles and reference soil/rock outcrop motions (“1u-s”, “2u-s”, “2u-m”, “3u-m”, “4u-m”, “4u-h”, “5u-h”, “5a-h”, “1n2u-s”, “2n3u-m”, “2sn4u-m”, “3r3u-m” and “1n5a-h”) to develop the corresponding free-field motions at the top of each soil profile for the embedded NI analyses. The SHAKE analysis was performed for both horizontal and vertical input motions without any iteration on soil properties. The above computed motions from SHAKE analyses are used as input motion at the free-field ground surface (corresponding to El. 0.0m) for the SSI analysis of the embedded NI models.
SSI Analysis
Using a combination of the soil profiles and input motions, a total of 12 SSI analysis cases of the surface-supported and 13 SSI analysis cases of the embedded NI models were performed, as indicated above for the site response analyses. Each analysis case consisted of three separate SASSI runs with three components of the input motion applied separately in the x, y and z directions. The results of the three analyses (i.e. response due to x-input, y-input and z-input) in terms of acceleration time history responses at any output node were then algebraically summed and the results were used to calculate the maximum acceleration response and acceleration response spectra.
Discussion of Results
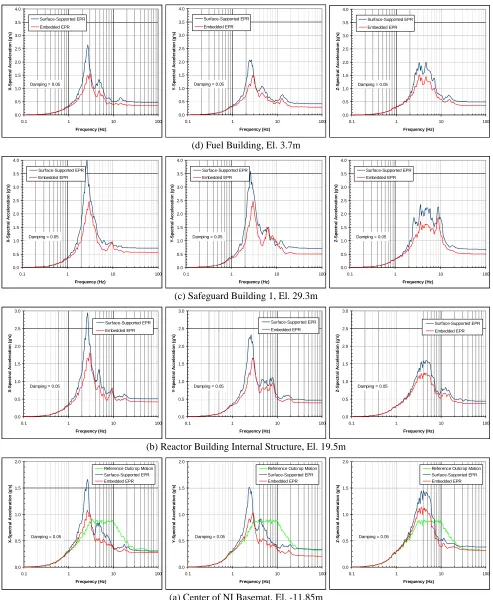
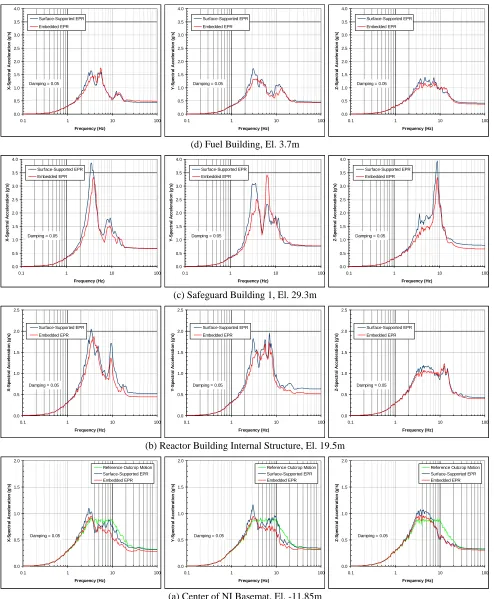
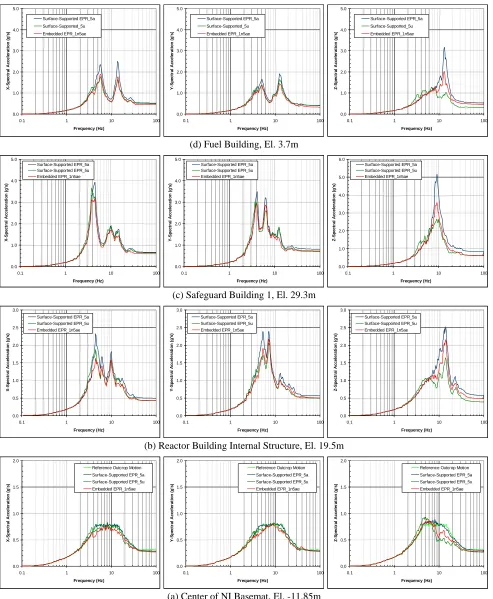
The results of the SSI analyses were calculated for the surface-supported and embedded NI model for all analysis cases. The typical results of maximum accelerations and acceleration response spectra for three significant analysis cases 2sn4u-m, 4u-m and 1n5a-h are presented and discussed below. Figures 6, 7 and 8 show comparison of computed spectra for the embedded and surface-supported NI at the center of basemat and a selected location in the reactor building internal structure (RBIS), safeguard building 1 (SB1) and fuel building (FB) for the analysis cases 2sn4u-m, 4u-m and 1n5a-h, respectively. The ratios of maximum accelerations are compared in Table 1.
Analysis Case 2sn4u-medium (2sn4u-m): Significant reductions in the spectral response across the entire frequency spectrum are observed in all three directions due to embedment effects for this analysis case. The reduction in maximum acceleration response due to the embedment effects are found to be on the order of 10 to 40 percent at locations examined (see Table 1).
Analysis Case 4u-medium (4u-m): The results for analysis case 4u-m indicate some reductions or no significant change in the spectral response due to the embedment effects in all three x, y and z directions except for some locations in the SB1 and SB2/3 where an increase in the response in a narrow frequency range of 6-7 Hz is observed in the y direction [for example, see Fig. 7(c)]. Significant reductions in the computed maximum accelerations (up to 20 percent) are observed due to the embedment effects (see Table 1).
structural response in the x and y directions at all locations examined due to embedment effects when compared to the 5u profile. In the z direction, the embedment causes the structural response to exceed those of the 5u profile due to the embedment effects. In all cases the results are significantly lower than those of the surface-supported NI with 5a profile.
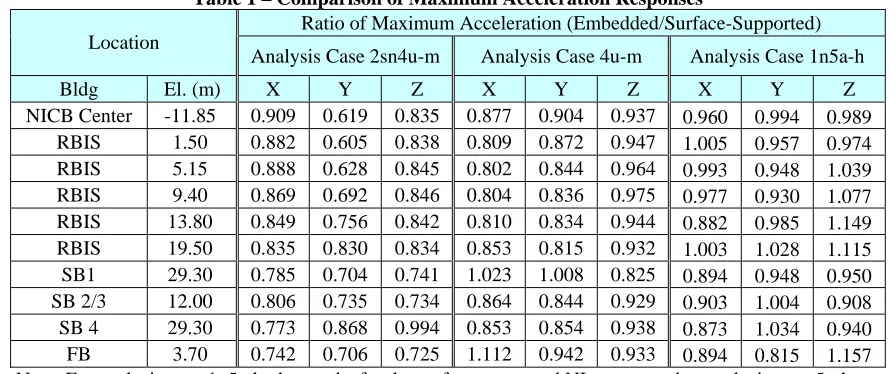
Table 1 – Comparison of Maximum Acceleration Responses
Ratio of Maximum Acceleration (Embedded/Surface-Supported) Location
Analysis Case 2sn4u-m Analysis Case 4u-m Analysis Case 1n5a-h
Bldg El. (m) X Y Z X Y Z X Y Z
NICB Center -11.85 0.909 0.619 0.835 0.877 0.904 0.937 0.960 0.994 0.989
RBIS 1.50 0.882 0.605 0.838 0.809 0.872 0.947 1.005 0.957 0.974
RBIS 5.15 0.888 0.628 0.845 0.802 0.844 0.964 0.993 0.948 1.039
RBIS 9.40 0.869 0.692 0.846 0.804 0.836 0.975 0.977 0.930 1.077
RBIS 13.80 0.849 0.756 0.842 0.810 0.834 0.944 0.882 0.985 1.149
RBIS 19.50 0.835 0.830 0.834 0.853 0.815 0.932 1.003 1.028 1.115
SB1 29.30 0.785 0.704 0.741 1.023 1.008 0.825 0.894 0.948 0.950
SB 2/3 12.00 0.806 0.735 0.734 0.864 0.844 0.929 0.903 1.004 0.908
SB 4 29.30 0.773 0.868 0.994 0.853 0.854 0.938 0.873 1.034 0.940
FB 3.70 0.742 0.706 0.725 1.112 0.942 0.933 0.894 0.815 1.157
Note: For analysis case 1n5a-h, the results for the surface-supported NI correspond to analysis case 5u-h.
SUMMARY AND CONCLUSIONS
Seismic SSI response of the EPRTM NI structures was calculated for two cases of the surface-supported and
embedded NI model using computer program SASSI. The analyses considered ten generic soil cases (ranging from hard rock to stiff soil to soft soil conditions that are likely to be encountered at plant sites in the United States) and three postulated seismic ground motions (corresponding to EUR Hard, EUR Medium and EUR Soft motions). Each soil profile is associated with one or, and in a few cases, two of the seismic control motions. Selected results in terms of the maximum accelerations and acceleration response spectra on the NI basemat and at several key locations in the structure were presented and compared for the surface-supported versus embedded NI model for three controlling cases “2sn4u-m”, “4u-m” and “1n5a-h”.
In general, the effect of embedment is the reduction of the maximum acceleration and acceleration response spectra across the frequency spectrum. However, the degree of this reduction depends on the soil profile, NI structures properties and input motion. In general, more reductions in the response due to embedment effects seem to be associated with the softer soil profiles except where the spectral response is affected by the structural frequency shift. As the soil properties become stiffer, the responses of the internal structures appear to be less influenced by the embedment effects since they are not directly connected by the side soils. In general, the structures that have direct contact with the side soils (SB1, SB2/3, SB4 and FB) appear to be more sensitive to the embedment effects regardless of the soil stiffness.
It is noted that the effect of non-horizontally layered sites or sites having sloping rock condition directly under the plant are not considered in this study. Such effects could be significant and may require site-specific studies.
ACKNOWLEDGEMENTS
This study was partially supported by AREVA NP, Inc. The authors acknowledge their support.
REFERENCES
1. Lysmer, J., Tabatabaie, M., Tajirian, F., Vahdani, S. and Ostadan, F., “SASSI – A System for Analysis of Soil Structure
Interaction,” Report No. UCB/GT/81-02, Geotechnical Engineering, Department of Civil Engineering, University of
California, Berkeley, April 1981.
2. Tajirian, F. and Tabatabaie, M., “Vibration Analysis of Foundations on Layered Media,” ASCE proceedings on
Vibrations for Soils and Foundations, Detroit, Michigan, 1985.
3. MTR/SASSI, “System for Analysis of Soil-Structure Interaction,” Version 8.01, Volume I User’s Manual, MTR &
Associates, Inc., Lafayette, California, 2007.
4. AREVA Calculation No. 32-9025669-003, “US EPR Standard Nuclear Island, Soil-Structure Interaction Analysis.” 5. Schnabel, Lysmer, J. and Seed, H.B., “SHAKE91, A Computer Program for Conducting equivalent Linear Seismic
0.0 0.5 1.0 1.5 2.0 2.5 3.0 3.5 4.0
0.1 1 10 100
Frequency (Hz) X-Spec tr a l Acc el er a ti on ( g 's ) Surface-Supported EPR Embedded EPR
Damping = 0.05
0.0 0.5 1.0 1.5 2.0 2.5 3.0 3.5 4.0
0.1 1 10 100
Frequency (Hz) Y-Spec tr al Acc el er a ti o n ( g' s ) Surface-Supported EPR Embedded EPR
Damping = 0.05
0.0 0.5 1.0 1.5 2.0 2.5 3.0 3.5 4.0
0.1 1 10 100
Frequency (Hz) Z -S p e c tr a l A c c e le ra ti o n ( g 's ) Surface-Supported EPR Embedded EPR
Damping = 0.05
(d) Fuel Building, El. 3.7m
0.0 0.5 1.0 1.5 2.0 2.5 3.0 3.5 4.0
0.1 1 10 100
Frequency (Hz) X -S p e c tr a l A c c e le ra tio n (g 's ) Surface-Supported EPR Embedded EPR
Damping = 0.05
0.0 0.5 1.0 1.5 2.0 2.5 3.0 3.5 4.0
0.1 1 10 100
Frequency (Hz) Y -S p e c tr a l A c c e le ra tio n (g 's ) Surface-Supported EPR Embedded EPR
Damping = 0.05
0.0 0.5 1.0 1.5 2.0 2.5 3.0 3.5 4.0
0.1 1 10 100
Frequency (Hz) Z -S p e c tr a l A c c e le ra tio n (g 's ) Surface-Supported EPR Embedded EPR
Damping = 0.05
(c) Safeguard Building 1, El. 29.3m
0.0 0.5 1.0 1.5 2.0 2.5 3.0
0.1 1 10 100
Frequency (Hz) X -S pe ct ral A cce ler at io n (g 's) Surface-Supported EPR Embedded EPR
Damping = 0.05
0.0 0.5 1.0 1.5 2.0 2.5 3.0
0.1 1 10 100
Frequency (Hz) Y -S pe ct ral A cce ler at io n (g 's ) Surface-Supported EPR Embedded EPR
Damping = 0.05
0.0 0.5 1.0 1.5 2.0 2.5 3.0
0.1 1 10 100
Frequency (Hz) Z-S pe ct ral A cce ler at io n (g 's ) Surface-Supported EPR Embedded EPR
Damping = 0.05
(b) Reactor Building Internal Structure, El. 19.5m
0.0 0.5 1.0 1.5 2.0
0.1 1 10 100
Frequency (Hz) X -S p e c tr a l A c c e le ra tio n (g 's )
Reference Outcrop Motion Surface-Supported EPR Embedded EPR
Damping = 0.05
0.0 0.5 1.0 1.5 2.0
0.1 1 10 100
Frequency (Hz) Y -S p e c tr a l A c c e le ra tio n (g 's )
Reference Outcrop Motion Surface-Supported EPR Embedded EPR
Damping = 0.05
0.0 0.5 1.0 1.5 2.0
0.1 1 10 100
Frequency (Hz) Z -S p e c tr a l A c c e le ra tio n (g 's )
Reference Outcrop Motion Surface-Supported EPR Embedded EPR
Damping = 0.05
(a) Center of NI Basemat, El. -11.85m
0.0 0.5 1.0 1.5 2.0 2.5 3.0 3.5 4.0
0.1 1 10 100
Frequency (Hz) X -S p ect ral A cce ler a ti o n ( g 's) Surface-Supported EPR Embedded EPR
Damping = 0.05
0.0 0.5 1.0 1.5 2.0 2.5 3.0 3.5 4.0
0.1 1 10 100
Frequency (Hz) Y -S p ect ral A cce ler a ti o n ( g 's ) Surface-Supported EPR Embedded EPR
Damping = 0.05
0.0 0.5 1.0 1.5 2.0 2.5 3.0 3.5 4.0
0.1 1 10 100
Frequency (Hz) Z -S p ect ral A cce ler a ti o n ( g 's ) Surface-Supported EPR Embedded EPR
Damping = 0.05
(d) Fuel Building, El. 3.7m
0.0 0.5 1.0 1.5 2.0 2.5 3.0 3.5 4.0
0.1 1 10 100
Frequency (Hz) X -S p ect ral A cce ler a ti o n ( g 's) Surface-Supported EPR Embedded EPR
Damping = 0.05
0.0 0.5 1.0 1.5 2.0 2.5 3.0 3.5 4.0
0.1 1 10 100
Frequency (Hz) Y -S p ect ral A cce ler a ti o n ( g 's ) Surface-Supported EPR Embedded EPR
Damping = 0.05
0.0 0.5 1.0 1.5 2.0 2.5 3.0 3.5 4.0
0.1 1 10 100
Frequency (Hz) Z -S p ect ral A cce ler a ti o n ( g 's ) Surface-Supported EPR Embedded EPR
Damping = 0.05
(c) Safeguard Building 1, El. 29.3m
0.0 0.5 1.0 1.5 2.0 2.5
0.1 1 10 100
Frequency (Hz) X-Sp e ct ra l Ac ce ler at io n ( g 's ) Surface-Supported EPR Embedded EPR
Damping = 0.05
0.0 0.5 1.0 1.5 2.0 2.5
0.1 1 10 100
Frequency (Hz) Y-Sp e ct ra l Ac ce ler at io n ( g 's ) Surface-Supported EPR Embedded EPR
Damping = 0.05
0.0 0.5 1.0 1.5 2.0 2.5
0.1 1 10 100
Frequency (Hz) Z -S p e c tr a l A c c e le ra ti o n (g 's ) Surface-Supported EPR Embedded EPR
Damping = 0.05
(b) Reactor Building Internal Structure, El. 19.5m
0.0 0.5 1.0 1.5 2.0
0.1 1 10 100
Frequency (Hz) X -S p ect ral A cce ler a ti o n ( g 's)
Reference Outcrop Motion Surface-Supported EPR Embedded EPR
Damping = 0.05
0.0 0.5 1.0 1.5 2.0
0.1 1 10 100
Frequency (Hz) Y -S p ect ral A cce ler a ti o n ( g 's )
Reference Outcrop Motion Surface-Supported EPR Embedded EPR
Damping = 0.05
0.0 0.5 1.0 1.5 2.0
0.1 1 10 100
Frequency (Hz) Z -S p ect ral A cce ler a ti o n ( g 's )
Reference Outcrop Motion Surface-Supported EPR Embedded EPR
Damping = 0.05
(a) Center of NI Basemat, El. -11.85m
0.0 1.0 2.0 3.0 4.0 5.0
0.1 1 10 100
Frequency (Hz) X -S p ect ral A cce ler a ti o n ( g 's) Surface-Supported EPR_5a Surface-Supported_5u Embedded EPR_1n5ae 0.0 1.0 2.0 3.0 4.0 5.0
0.1 1 10 100
Frequency (Hz) Y -S p ect ral A cce ler a ti o n ( g 's ) Surface-Supported EPR_5a Surface-Supported_5u Embedded EPR_1n5ae 0.0 1.0 2.0 3.0 4.0 5.0
0.1 1 10 100
Frequency (Hz) Z -S p ect ral A cce ler a ti o n ( g 's ) Surface-Supported EPR_5a Surface-Supported_5u Embedded EPR_1n5ae
(d) Fuel Building, El. 3.7m
0.0 1.0 2.0 3.0 4.0 5.0
0.1 1 10 100
Frequency (Hz) X -S p ect ral A cce ler a ti o n ( g 's) Surface-Supported EPR_5a Surface-Supported EPR_5u Embedded EPR_1n5ae 0.0 1.0 2.0 3.0 4.0 5.0
0.1 1 10 100
Frequency (Hz) Y -S p ect ral A cce ler a ti o n ( g 's ) Surface-Supported EPR_5a Surface-Supported EPR_5u Embedded EPR_1n5ae 0.0 1.0 2.0 3.0 4.0 5.0 6.0
0.1 1 10 100
Frequency (Hz) Z -S p ect ral A cce ler a ti o n ( g 's ) Surface-Supported EPR_5a Surface-Supported EPR_5u Embedded EPR_1n5ae
(c) Safeguard Building 1, El. 29.3m
0.0 0.5 1.0 1.5 2.0 2.5 3.0
0.1 1 10 100
Frequency (Hz) X-Sp e ct ra l Ac ce ler at io n ( g 's ) Surface-Supported EPR_5a Surface-Supported EPR_5u Embedded EPR_1n5ae 0.0 0.5 1.0 1.5 2.0 2.5 3.0
0.1 1 10 100
Frequency (Hz) Y-Sp e ct ra l Ac ce ler at io n ( g 's ) Surface-Supported EPR_5a Surface-Supported EPR_5u Embedded EPR_1n5ae 0.0 0.5 1.0 1.5 2.0 2.5 3.0
0.1 1 10 100
Frequency (Hz) Z -S p e c tr a l A c c e le ra ti o n (g 's ) Surface-Supported EPR_5a Surface-Supported EPR_5u Embedded EPR_1n5ae
(b) Reactor Building Internal Structure, El. 19.5m
0.0 0.5 1.0 1.5 2.0
0.1 1 10 100
Frequency (Hz) X -S p ect ral A cce ler a ti o n ( g 's)
Reference Outcrop Motion Surface-Supported EPR_5a Surface-Supported EPR_5u Embedded EPR_1n5ae 0.0 0.5 1.0 1.5 2.0
0.1 1 10 100
Frequency (Hz) Y -S p ect ral A cce ler a ti o n ( g 's )
Reference Outcrop Motion Surface-Supported EPR_5a Surface-Supported EPR_5u Embedded EPR_1n5ae 0.0 0.5 1.0 1.5 2.0
0.1 1 10 100
Frequency (Hz) Z -S p ect ral A cce ler a ti o n ( g 's )
Reference Outcrop Motion Surface-Supported EPR_5a
Surface-Supported EPR_5u Embedded EPR_1n5ae
(a) Center of NI Basemat, El. -11.85m