Volume 9, No. 1, January-February 2018
International Journal of Advanced Research in Computer Science
RESEARCH PAPER
Available Online at www.ijarcs.info
ISSN No. 0976-5697
CHANGE DETECTION OF REMOTE SENSING IMAGES USING LEVY FLIGHT
PSO
Josephina Paul
KCAET, Tavanur Kerala Agricultural University
Malappuram,India
Abstract: In this paper, we propose an improved fusion technique for the change detection of remote sensing images. Two difference images, one log ratio image and other a difference image generated by subtraction were fused in the undecimated wavelet domain, as UWT is good in representing images into multiscale, pyramidal form. The resultant sub band images were segmented with a Particle Swarm Optimization algorithm with Levy flights due to its robustness against local optima, unlike the standard PSO. The accuracy metrics - Percent Correct Clustering (PCC) and Kappa statistic - were used to compare the performance of the proposed method with a few other algorithms and found to be outperforming.
Keywords: Undecimated Wavelet Transform, Fusion, Particle Swarm Optimization, Levy Flight, Remote sensing
I. INTRODUCTION
Due to diverse applications such as medical diagnosis, industrial production, video surveillance and land cover changes monitoring, change detection[1-3] has gained great interest in the recent decades. In this paper the emphasis is on geographical change detection using remote sensing imageries as the rationale behind this is manifold. The first fact is the availability of satellite images of different resolution and various technologies present in processing and analyzing them. At the same time, the challenges arising in real-time problems such as disaster management, protecting ecology and monitoring land use changes are increasing and therefore, developing potential solutions to handle these complexities have become the need of the hour. Though several methods are available today, many of them are inefficient in detecting the actual changes occurred when the nature of changes involved are heterogeneous, and which makes this research relevant. In order to detect changes occurred, two images of the same scene acquired at two time stamps are required. Since the quality of remote sensing images are prone to be affected by many external factors while capturing, it has to be pre-processed for minimizing such effects. The radiometric errors due to atmospheric haze, sun angle, azimuth etc. are rectified by suitable software. Geometric errors are corrected by registering the images to the same co-ordinates. Filtering operations are often done for removing the noise inherent in the images while capturing. After preprocessing operations, the difference image(DI) is generated, for which, two commonly adopted methods are rationing and subtraction [3]. While the former employs ratio operation on corresponding pixels of the two input images, the latter generates the DI by subtracting the pixels of the input images. Finally, the labeling of pixels into two groups - changed and unchanged- are done to produce a binary change map. For this, the techniques often used are segmentation in the supervised or unsupervised paradigm[4] or by the usual thresholding method. From the literature, it
is evident that the quality of the difference image and the segmentation algorithm determines the accuracy of the change map, and therefore, in this study, the emphasis has been given on these two issues. In order to enhance the quality of difference images, we have proposed a fusion technique[5] using two types of difference images, one being a DI generated by subtraction and other DI, by rationing that can complement information each other while combining. Ratioing has been done on logarithmic scale as the logarithmic operation scales down the range of variation of pixels, and thus, the effect of noise also can be reduced considerably. Since the DI by subtraction is a true reflection of the intensity values of the various covered objects of the scene, for the change detection problems, it is more appropriate. . In [3], fusion of two difference images at the DWT coefficient level is done to enhance the true signal components in the resultant DI in a change detection problem. Although the accuracy obtained is found to be high, the shift and scale variance of DWT, which are not suitable in the case of change detection, reduces the attraction of this method. Therefore, we have performed the fusion in the Undecimated Discrete Wavelet Trasform (UWT/UDWT) domain, which are scale and shift invariant. For moe details, it can be referred to [6] as present study is an extension of the work done in [6].
The rest of the paper is organized as follows: Section II discusses the motivation behind the proposed method and the theoretical framework available in the literature. Section III details the proposed algorithm and the datasets and the experiments are discussed in section IV. A brief discussion on the results is presented in section V and finally, the future work intended are discussed in section VI.
II. METHODOLOGY
A. Motivation
localization.[7]. Due to this property, they can be used for representing the signals into multiple coarseness at different scales. ie. an image can be viewed more closely to see its intricacies by splitting the image into various frequencies. While the higher frequencies carry the salient features like edges and lines, the lower frequencies hold the surface characteristics. Many families of wavelets have been developed over the past decades, since its first implementation by Mallat and Meyer. Among them, the discrete wavelets are the most successfully employed, in various image processing applications as seen in the literature[3]. However, due to their decimated property which leads to halving the size at every level of decomposition, they are not appropriate for change detection problems. On the contrary, the undecimated variant, called UWT or UDWT, which has no subsampling on decomposition and thus preserve size with shift invariance, are more suitable in change detection problems, and therefore, we have used UWT in this study.
UDWT
The undecimated wavelet comes under various names, Shift translation wavelet, stationary wavelet or redundant [7]. Since there is no down sampling while filtering, the resultant bands are of the same size as that of the original signal. The denoising capability owing to representing information in a few singularities makes the UWT suitable for image analysis as in the case of any other wavelets. Since most of the coefficients are very small quantities, wavelet thresholding can remove most of the noise inherent in the images. One dimensional and 2-dimensional UWT are common of which, the latter is used for processing images. In two-dimensional wavelet transform, the signal (image) is decomposed into four bands, LL, LH, HL and HH that corresponds to the low, horizontal, vertical and diagonal components of frequencies. On successive decomposition, the LL-approximation component is again split into LLL, LLH, LHL and LHH, thus generates 3J+1 redundancy on J levels of decomposition.
Particle Swarm Optimization
The PSO is a meta-heuristic, nature inspired algorithm proposed by Kennedy and Eberhart, imitating the behavior of social insects such as school of fish, flocks of birds etc. in solving optimization problems. It is a population-based algorithm, where every particle in it represents a candidate solution, and again competing for achieving a global solution. The meta-heuristics underlying in it work as follows: each particle tries to learn from its own experience and the best solution among the swarm and remember this solution until a better value is achieved iteratively [8-10]. The position of the particles are updated and an objective function is evaluated on every iteration and compared with the previous fitness value to find the local best and the global best. If the new positions are better than the one in the memory, the current value becomes the best and the process is repeated till it converges to the global optimum value. Since its inception, several variants of PSO have been developed and implemented successfully for solving optimization problems. Since the segmentation of changed and unchanged pixels can be considered as an optimization problem, it is represented mathematically,
(1)
where K is the number of clusters, vi is the cluster centre of
ith cluster and d is the Euclidian norm and n is the
number of data points belonging to the ith cluster. Since our
objective is to find the minimum error of the fitness function, the objective function of PSO is a minimization problem, iteratively trying to reach the global optimum value. Initially the particles of the swarm are distributed randomly in the search space by a designated position witth zero velocity. On every iteration, the velocity and position are updated using the following equations
(2)
(3) Where is the velocity of ith particle at iteration t+1,
is the velocity of ith particle at iteration t, c1 and c2
are acceleration parameters, ,
are the position of ith particle at iteration
t+1, and t respectively, pBesti is the particle’s best position
and gBest is the best position among the swarm, and is
the element level multiplication of matrix.
PSO is found to be performing well for the optimization problems. However, the classical PSO suffers from the following shortfalls: The probability of getting trapped into local optima is very high in the case of the PSO by Eberhart[7]. Another drawback is that it ends up with premature convergence. After a few iterations, the particles’ ability of exploring new search path gets deteriorated due to stagnation of velocity. Therefore, to address these shortfalls, several variants of PSO can be seen in literature. PSO with Levy flight have been proposed in [11-12], where the particles occasionally perform Levy walk to escape from the local optima.
B. Levy Flights
Levy flight, is a random walk with isotropic steps, following certain probability distribution. After a large number of steps, it reaches to a stable distribution as the movements are isotropic. It can be expressed in terms of Fourier transform as
(4)
Where is skewness or scale factor. When is 0, the distribution is symmetric. [0,2] is referred to as Levy index that is acting as an index of stability. When =1, it forms the Cauchy probability distribution and if =2, it follows Gaussian distribution. From this, it is clear that controls the shape of the distribution.
Now, the position is updated by Levy flight as (5)
Where is the Levy flight and determins the
shape of the flight as given above. For small values of , the Levy step will be longer and for large values, it is short. The flight length at an instant can be calculated by Mantegna’s equation
(6)
and and (7)
The stepsize S is normally multiplied by 0.01, to alleviate the aggressive nature of random walks.
III. THE PROPOSED CHANGE DETECTION TECHNIQUE
The proposed method involves a fusion of the two difference images in the UWT domain and a segmentaion of the fused DI which is detailed as in the Fig 1. In this technique, we have used undecimated discrete wavelet transform, due to its property of shift and scale invariance. The log ratio image and the DI generated by subtraction were decomposed by UWT and the coefficients were generated. In the present experiment, UDWT decomposition upto two levels were done as beyond this level it could not produce satisfactory improvements on the results. Wavelet thresholding was employed on these coefficients using Donoho & Johnstone’s formula of threshold
(8)
where is the threshold and M and N are the dimension
of the image and
In order to enhance the signal content, the coefficients from the two input images were combined on different rules: low frequencies by averaging and high frequencies by minimum local energy rule as follows
LLr,b = (LLn,b+ LLl,b)/2 (9)
(10)
Algorithm: To generate the change map from two temporal images
Input: two source images taken at two time points t1 and t2 Output: binary change map
1. Generate difference image by subtraction
2. Generate log ratio image taking natural logarithm of two input images
3. Apply UDWT decomposition on both difference images upto desired levels
4. Fuse the low frequency coefficients using equation (8) 5. Apply equation (9) to generate the high frequency fused
sub band DI
6. Employ Levy flight PSO algorithm to segment the sub images into two clusters-changed and unchanged
7. Generate a binary map of the segmented sub band DI
Fig 1. Proposed Technique
In the next step, an unsupervised segmentation algorithm has been employed to group the changed and unchanged pixels. Here, we have used a Particle Swarm Optimization algorithm, with Levy flight, a variant of PSO with Levy flights seen in [11-12].
The initial particle positions are drawn from the solution space with an initial zero velocity, and the fitness function is evaluated using equation 1. The initial position is assigned as the pBesti of the particle and based on the best fitness
value, the gBest of the particle is determined. On every
successive iteration, the velocity and position are updated using equations 2 & 3 respectively if the value of random number is below 0.5; otherwise they are updated by equation 5. In this problem the step length S is multiplied by the current particle position together with the global component of the PSO equation as
(11)
and thus, the stepsize is depending on the distance between the current position of the particle and the global best position of the swarm. The fitness of the new positions are evaluated again and the pBesti and gBest are reassigned if
a better value is found. The process repeats until the maximum iteration is reached. The detailed algorithm is given in Fig 2.
Once the cluster centres are obtained, the image is segmented into two clusters. A binary change map is generated by labeling the pixels in cluster 1 as 0 and cluster 2 as 1.
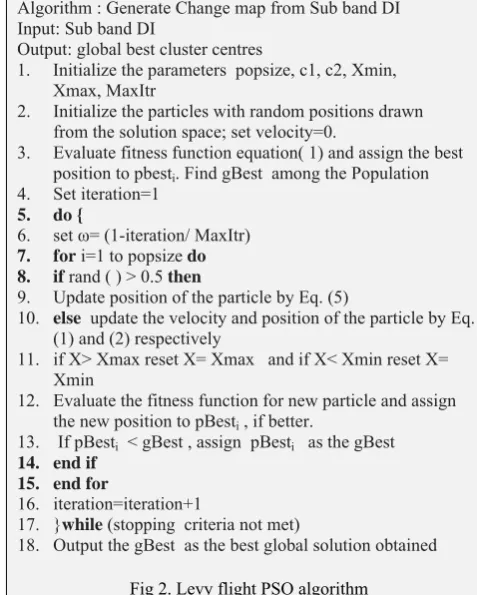
Algorithm : Generate Change map from Sub band DI Input: Sub band DI
Output: global best cluster centres
1. Initialize the parameters popsize, c1, c2, Xmin, Xmax, MaxItr
2. Initialize the particles with random positions drawn from the solution space; set velocity=0.
3. Evaluate fitness function equation( 1) and assign the best position to pbesti. Find gBest among the Population
4. Set iteration=1
5. do {
6. set ω= (1-iteration/ MaxItr)
7. for i=1 to popsize do 8. if rand ( ) > 0.5 then
9. Update position of the particle by Eq. (5)
10. else update the velocity and position of the particle by Eq.
(1) and (2) respectively
11. if X> Xmax reset X= Xmax and if X< Xmin reset X= Xmin
12. Evaluate the fitness function for new particle and assign the new position to pBesti , if better.
13. If pBesti < gBest , assign pBesti as the gBest
14. end if
15. end for
16. iteration=iteration+1
17. }while (stopping criteria not met)
[image:3.595.317.556.339.637.2]18. Output the gBest as the best global solution obtained
Fig 2. Levy flight PSO algorithm
IV. DATASETS
Data set 2: The second dataset is the image of Lake of Tahoe, Reno city in USA. Out of the two images, one was acquired on August 5, 1986 and another on August 5, 1992, both by the Landsat 5 MSS scanner. A portion of the image with 200 x 200 pixels was clipped for this study purpose and preprocessed.
The accuracy of the technique was evaluated using the Percent Correct Clustering (PCC) and Kappa statistic, which is a measure of agreement between two sets of classification considering the random chance of agreement. Mathematically, it can be written as
Percent Correct Clustering (PCC)=
(TP+TN)/(TP+TN+FP+FN)
Where TP is true positive, TN is true negative, FP is false positive and FN is false negative of the segmented pixels and
Kappa K = (observed accuracy - expected accuracy)/(1 - expected accuracy)
[image:4.595.327.541.53.397.2]
Fig 3. Band 2 of multitemporal images of Malampuzha Dam, India (a) Image acquired in 2001 (b) image acquired in 2002 c) Reference Map
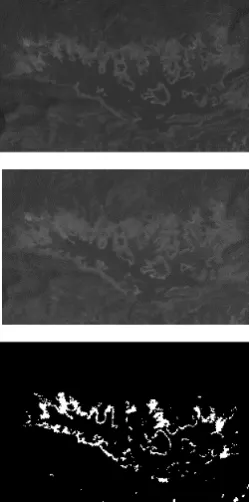
Fig 4. Band 1 of multitemporal images of Lake of Tahoe, Reno (a) Image acquired on 5th Aug 1986 (b) image acquired on 5th Aug 1992 c)
Reference Map of Reno, Tahoe
Table 1. Results of various methods on Malampuzha Reservoir, Kerala, India
Method PCC(%) Kappa(K) PCC(%) Kappa(K) Band 2 Band 3
UWT fusion with K means
83.8219 0.483530 85.3344 0.461400
UWT fusion with PSO
83.8234 0.483540 89.8000 0.472231
UWT fusion with PSOLF
85.5063 0.490282 90.3328 0.474080
Fig 5. Change Detection results of Malampuzha Reservoir with (a) UDWT fusion with K-means (b) UDWT fusion with PSO (c) UDWT fusion with PSOLF
V. RESULTS AND DISCUSSION
[image:4.595.95.220.287.539.2]Various experimental set ups and their results are detailed in the following paragraphs.
Table 2. Results of various methods on Lake of Tahoe, Reno City
Method PCC(%) Kappa(K) PCC(%) Kappa(K) Band 1 Band 2
UWT fusion with K means
98.6100 0.5742500 96.8475 0.5057240
UWT fusion with PSO
98.6675 0.7177644 96.9000 0.5065627
UWT fusion with PSOLF
98.6725 0.7185359 97.0025 0.5187310
[image:4.595.38.267.586.664.2]demonstrated in [6]. For this, we have used the Levy flight PSO to label the changed and unchanged pixels. The results were compared with the K-means clustering algorithm and the standard PSO. All these experiments were done on Reno dataset and Malampuzha data set as well, and the results obtained are listed in the tables as given below.
From Table 1, it is well demonstrated that the PCC and Kappa statistic(K) for the band 1 DI and band2 DI obtained for the proposed method is more accurate compared to other two methods. While the PCC for Kmeans and standard PSO for band 1 are 83.8219% and 83.8234 respectively, PCC for the proposed method is 85.5063, a better value. Similarly, the Kappa value obtained for the proposed method is 0.490282 against 0.48353 for Kmeans and 0.48354 for PSO, which is obviously more acceptable. For the band 2 DI, even better results have been obtained with PCC 90.3328 and Kappa 0.474080. The same trend can be seen in the results of the Lake of Tahoe, Reno dataset as well, which is given in Table 2. Secondly, for the visual analysis, the proposed algorithm produces a better change map (Fig 5c), whereas the K means and standard PSO produces a more noisy output (Fig 5a and b), in the case of Malampuzha dataset. For the Reno dataset, while the change map of the proposed method shows a well-defined boundary of the changed regions (Fig 6c) as in the reference map, the other two methods produced only dotted boundary of the Change maps (Fig 6a and b).
[image:5.595.31.286.375.449.2]
Fig 6. Change Detection results of Lake of Tahoe, Reno with (a) UDWT fusion with K-means (b) UDWT fusion with PSO (c) UDWT fusion with PSOLF
VI. CONCLUSION AND FUTURE WORK
In this experiment, we have generated a DI on fusion and segmented the image with Levy flight PSO. The results are compared with other two methods, K means method and standard PSO. From the results, it is evident that the proposed method outperforms the other two methods in generating change map. The overall performance of the proposed algorithm on different data sets is found to be high both qualitatively and quantitatively. From the quantitative results and the change maps obtained, it can be inferred that the proposed method is more suitable for generating change maps. The introduction of Levy flight in PSO has helped reduce the problem of getting trapped in local minima; yet,
it depends on the choice of the initial values also. It is aimed to concentrate in the next work, to develop better soft computing methods that can produce a consistent and even better result.
VII.REFERENCES
[1] Macleod, R. D., And Congalton, R. G., 1998, A quantitative comparison of change detection algorithms for monitoring eelgrass from remotely sensed data. Photogrammetric Engineering and Remote Sensing, 64, 207–216.
[2] D. Lu, P. Mausel, E. Brondi´Zio And E. Moran, Change detection Techniques, Int. J. Remote Sensing, 2003, Vol. 25, No. 12, 2365–2407.
[3] Maoguo Gong, Member, Zhiqiang Zhou, and Jingjing Ma, Change detection in Synthetic Aperture Radar Images based on Image Fusion and Fuzzy Clustering, IEEE Transactions on Image Processing, Vol. 21, No. 4, April 2012
[4] Turgay Celik and Kai-Kuang Ma, Unsupervised Change detection for Satellite Images Using Dual-Tree Complex Wavelet Transform, IEEE Transactions On Geoscience And Remote Sensing, Vol. 48, No. 3, 2010
[5] R. S. Blum, “Robust image fusion using a statistical signal processing approach,” Information Fusion, vol. 6, no. 2, pp. 119–128, 2005.
[6] Josephina Paul, Change detection using undecimated wavelet transform fusion and Genetic Algorithm, International Journal of Emerging Technology and Advanced Engineering, Vol 8(1), Jan 2018.
[7] S. Mallat, A Wavelet Tour of Signal Processing, 2nd ed., Academic Press, 1999.
[8] J Kennedy, RC Eberhart, Particle swarm optimization, Proceedings of the IEEE International Joint Conference on Neural Networks, Vol. 4, pp 1942–1948, 1995.
[9] Kennedy J and Eberhart R (2001) Swarm intelligence. Morgan Kaufmann Publishers Inc., San Francisco, CA. [10] X.H. Shi, Y.C. Liang, H.P. Lee, C. Lu, L.M. Wang, An
improved GA and a novel PSO-GA-based hybrid algorithm, Inf. Process. Lett. 93 (2005) 255–261.
[11] H. Haklı, H. Uguz, A novel particle swarm optimization algorithm with Levy flight, Applied Soft Computing (23) (2014) 333–345.
[12] R. Jensi, G. Wiselin Jiji, An enhanced particle swarm optimization with Levy flight for global Optimization, Applied Soft Computing 43 (2016) 248–261