Scholarship at UWindsor
Scholarship at UWindsor
Electronic Theses and Dissertations Theses, Dissertations, and Major Papers
1-27-2016
Development and Analysis of a Split-Cycle Engine Fuelled with
Development and Analysis of a Split-Cycle Engine Fuelled with
Methane
Methane
Iain Cameron University of Windsor
Follow this and additional works at: https://scholar.uwindsor.ca/etd
Recommended Citation Recommended Citation
Cameron, Iain, "Development and Analysis of a Split-Cycle Engine Fuelled with Methane" (2016). Electronic Theses and Dissertations. 5630.
https://scholar.uwindsor.ca/etd/5630
This online database contains the full-text of PhD dissertations and Masters’ theses of University of Windsor students from 1954 forward. These documents are made available for personal study and research purposes only, in accordance with the Canadian Copyright Act and the Creative Commons license—CC BY-NC-ND (Attribution, Non-Commercial, No Derivative Works). Under this license, works must always be attributed to the copyright holder (original author), cannot be used for any commercial purposes, and may not be altered. Any other use would require the permission of the copyright holder. Students may inquire about withdrawing their dissertation and/or thesis from this database. For additional inquiries, please contact the repository administrator via email
FUELLED WITH METHANE
by:
Iain A.S. Cameron
A Dissertation
Submitted to the Faculty of Graduate Studies
through Mechanical, Automotive, and Materials Engineering in Partial Fulfillment of the Requirements for
the Degree of Doctor of Philosophy at the University of Windsor
Windsor, Ontario, Canada
METHANE
by
Iain A.S.Cameron
APPROVED BY:
Dr. R. Fraser, External Examiner
University of Waterloo
Dr. D. Green
Department of Mechanical, Automotive, and Materials Engineering
Dr. G. Rankin
Department of Mechanical, Automotive, and Materials Engineering
Dr. B. Minaker
Department of Mechanical, Automotive, and Materials Engineering
Dr. A. Sobiesiak, Advisor
Department of Mechanical, Automotive, and Materials Engineering
Author’s Declaration of Originality
I hereby certify that I am the sole author of this thesis and that no part of this thesis has
been published or submitted for publication.
I certify that, to the best of my knowledge, my thesis does not infringe upon anyone’s
copyright nor violate any proprietary rights and that any ideas, techniques, quotations, or any other material from the work of other people included in my thesis, published or otherwise, are fully acknowledged in accordance with the standard referencing practices.
Furthermore, to the extent that I have included copyrighted material that surpasses the bounds of fair dealing within the meaning of the Canada Copyright Act, I certify that I
have obtained a written permission from the copyright owner(s) to include such material(s) in my thesis and have included copies of such copyright clearances to my appendix.
Abstract
Natural gas, which is primarily composed of methane, offers many advantages over other
hydrocarbon fuels for use in reciprocating piston engines. Generally, these include: a high octane rating, wide flammability limits, a high gravimetric energy content, reduced CO2
output, and lower levels of harmful exhaust gas emissions. However, natural gas presents some unique challenges due to its low density and slow laminar burning velocity. The former causes issues with volumetric efficiency and/or charge homogeneity depending on
the fuel delivery method. The latter results in prolonged combustion durations that are counter-productive to high fuel conversion efficiencies.
A split-cycle engine divides the conventional four-stroke engine process between two adjoin-ing cylinders: one cylinder for intake and compression, the second cylinder for combustion
and exhaust. The passage that connects these two cylinders together provides an alternative location for fuel injection and mixing. Furthermore, the fluid exchange process occurring
from this passage to the combustion chamber is a source of turbulence generation desired to enhance the rate of combustion.
In this work a spark ignition split-cycle research engine has been developed and tested for
the purpose of evaluating its ability to alleviate the aforementioned problems associated with natural gas (methane) fuelled engines. A novel fuel injector location and timing have
been employed and the results show excellent mixture homogeneity was achieved. The fuelling strategy also decoupled the injection event from the engine’s intake air flow rate;
however, the volumetric efficiency still remained low, between 71–75 %, due to flow losses in the compression cylinder. Combustion rates were found to be very rapid with both early and main burn duration periods on the order of 10–15°CA (crank angle), despite
un-favourable burning conditions (i.e. low cylinder temperature and late combustion phasing). The exhaust gas emission levels of nitrogen oxide, carbon monoxide, and total unburned
Acknowledgements
I would like to begin by thanking my supervisor, Dr. Andrzej Sobiesiak, whose guidance
and encouragement has brought me to a fulfilling and successful conclusion of my doctoral studies. The liberty that he afforded me in my research allowed me to freely pursue my
interests, and while this was not always the easiest route, it has led to a richer and more rewarding experience. I thank him for his patience and unwavering support.
I would also like to thank my doctoral committee members, Dr. Bruce Minaker, Dr. Gary Rankin, Dr. Daniel Green, and Dr. Roydon Fraser, for their feedback and recommendations regarding this dissertation.
This research would not have been possible without the financial contributions from the Natural Sciences and Engineering Research Council of Canada, the AUTO21 Network
Cen-tres of Excellence, the Ontario Ministry of Research and Innovation, and the University of Windsor Faculty of Graduate Studies.
Furthermore, I owe a large debt of gratitude to the team of technicians who helped me over the past few years. Special thanks to Bruce Durfy for his endless help and fruitful technical
input; to Andrew Jenner for rising to the challenge of my machining requests and doing so in a timely manner; and to Marc St.Pierre for his meticulous machining of the engine cylinder head. Additional support from Patrick Seguin, Dean Poublon, Mark Gryn, and
the entire Technical Support Centre staff is also gratefully acknowledged.
I appreciate the camaraderie and support of my fellow graduate students: Zakaria Movahedi,
Indika Gallage, Tony Nguyen, and Xisheng Zhou.
I would like to extend a special thank you to Mr. Francis Levangie, my high school
Auto-motive teacher, who first sparked my interest in autoAuto-motive engineering. It was under his mentorship that I became enamoured with internal combustion engines and chose to attend
the University of Windsor.
I am eternally grateful to my parents, Elaine and Stewart, who have unconditionally
sup-ported and encouraged my academic endeavours. I am also grateful to my sisters, Maureen and Meaghan, for their love and support.
Finally, I would like to acknowledge my wife, Aman, whose patience and encouragement
throughout this dissertation is beyond words; I cannot imagine how I would have completed it without her.
Contents
Author’s Declaration of Originality iii
Abstract iv
Dedication v
Acknowledgements vi
List of Tables xii
List of Figures xiv
Abbreviations xxi
Units xxiv
Notation xxv
1 Introduction 1
1.1 Overview . . . 1
1.2 Big-Picture Implications . . . 4
1.3 Research Objectives . . . 6
1.4 Organization of Thesis . . . 7
2 Background 9 2.1 The Split-Cycle Engine: An Introduction . . . 9
2.1.1 Operating Principles . . . 9
2.1.2 Split-Cycle Challenges . . . 12
2.1.3 Split-Cycle Advantages . . . 13
2.1.4 Relevant Literature . . . 17
2.1.5 Selection of Split-Cycle Configuration . . . 18
2.2 Emissions from Spark-Ignition Engines . . . 19
2.2.1 Carbon Dioxide (CO2) . . . 19
2.2.2 Oxides of Nitrogen (NOx) . . . 20
2.2.3 Carbon Monoxide (CO) . . . 22
2.2.4 Unburned Hydrocarbons (UHCs) . . . 23
2.2.6 Emission Reduction Strategies . . . 24
2.3 Natural Gas Engine Technology . . . 27
2.3.1 Combustion Chamber Design . . . 27
2.3.2 Hydrogen Supplementation . . . 28
2.3.3 Direct Injection . . . 30
2.3.4 Pre-Chamber Gas Jet Ignition . . . 31
2.3.5 Summary . . . 31
2.4 Turbulence and Combustion . . . 32
2.4.1 Turbulent Scales . . . 32
2.4.2 Interaction Between Combustion and Turbulence . . . 34
2.4.3 Generating In-Cylinder Turbulence . . . 37
2.4.4 Summary . . . 38
3 Split-Cycle Engine Design 39 3.1 Engine Overview . . . 39
3.2 Cranktrain . . . 42
3.2.1 Crankshaft Modification . . . 42
3.2.2 Piston and Connecting Rod . . . 47
3.3 Engine Block . . . 49
3.4 Cylinder Head . . . 49
3.4.1 Design Methodology . . . 49
3.4.2 Port, Valve, and Chamber Configuration . . . 50
3.4.3 Construction and Materials . . . 52
3.4.4 Cooling Passages . . . 54
3.4.5 Reverse Poppet Valve Seats . . . 55
3.4.6 Spark Plug and Transducer Locations . . . 56
3.4.7 Crossover Passage and Fuel Injector . . . 57
3.5 Reverse Poppet, Overhead Cam (OHC) Valvetrain . . . 59
3.5.1 Overview . . . 59
3.5.2 Design Constraints . . . 60
3.5.3 Valve Lift Profile . . . 62
3.5.4 Valvetrain Geometry . . . 63
3.5.5 Dynamic Simulation . . . 67
3.5.6 Camshaft . . . 71
3.5.7 Reverse Poppet Valve . . . 73
3.5.8 Reverse Poppet Valve Spring . . . 74
3.5.9 Reverse Poppet Rocker Arm . . . 78
3.5.10 Tappet and Spring Retainer . . . 79
3.6 Pushrod Valvetrain . . . 82
3.6.1 Rocker Arm Shaft Modification . . . 83
3.6.2 Camshaft Modifications . . . 83
3.6.3 Camshaft Lobe Profiles . . . 85
3.7 Timing Belt Drive . . . 88
4.1 Engine Dynamometer . . . 94
4.1.1 Speed and Load Control . . . 94
4.1.2 Engine Synchronous Belt Drive . . . 94
4.1.3 Flywheel . . . 97
4.2 Mechanical Engine Subsystems . . . 98
4.2.1 Engine Cooling System . . . 98
4.2.2 Engine Oiling System . . . 100
4.2.3 Air Intake System . . . 102
4.2.4 Exhaust System . . . 107
4.2.5 Fuel System . . . 108
4.3 Emissions Analysis . . . 110
4.4 Data Acquisition and Control System Hardware . . . 111
4.4.1 General . . . 111
4.4.2 Crank Angle Encoder . . . 114
4.4.3 Engine Pressure Measurements . . . 117
4.4.4 Temperature Measurement . . . 119
4.4.5 Air/Fuel Ratio Measurement . . . 120
4.4.6 Spark Ignition System . . . 121
4.4.7 Fuel Injection Control . . . 122
4.5 LabVIEWProgramming . . . 124
4.5.1 DAQ and Low-Level Control . . . 124
4.5.2 High-Level Engine Control . . . 127
4.6 Instrument Design Uncertainty . . . 127
5 Data Processing and Analysis 129 5.1 Data Post-Processing . . . 129
5.1.1 Zero-Level Pressure Correction . . . 129
5.1.2 Data Filtering for Noise Rejection . . . 131
5.1.3 Selecting the Number of Engine Cycles to Analyse . . . 133
5.2 Engine and Combustion Analysis Metrics . . . 134
5.2.1 Mean Effective Pressure (MEP) . . . 134
5.2.2 Coefficient of Variation (COV) . . . 135
5.2.3 Polytropic Indices . . . 136
5.2.4 Mass Fraction Burned (MFB) . . . 137
5.2.5 Burn Duration and Phasing . . . 141
5.2.6 Pressure Rise Rate (PRR) . . . 142
5.2.7 Fuel Conversion Efficiency . . . 142
5.2.8 Volumetric Efficiency . . . 142
6 Engine Trials: Experimental Results and Discussion 144 6.1 General . . . 144
6.2 Test Conditions . . . 145
6.3 Engine Operating Characteristics . . . 146
6.3.1 Working Pressures . . . 146
6.3.3 Mixture Homogeneity . . . 154
6.3.4 Volumetric Efficiency . . . 156
6.4 Issues and Limitations . . . 159
6.4.1 Valve Timing Adjustment . . . 159
6.4.2 Peak Pressure Limitation . . . 160
6.4.3 Crankcase Blow-By . . . 162
6.4.4 Lean-Limit Backfire . . . 165
6.5 Combustion Characteristics . . . 169
6.5.1 Rate of Combustion . . . 169
6.5.2 Combustion Phasing . . . 183
6.5.3 Cyclic Variability and Lean Operating Limit . . . 188
6.6 Exhaust Gas Emissions . . . 192
6.6.1 General . . . 192
6.6.2 Ignition Timing Effects . . . 193
6.6.3 Air/Fuel Ratio Effects . . . 196
6.7 Energy Balance . . . 199
6.8 Summary . . . 203
7 1-D Numerical Engine Simulation 205 7.1 General . . . 205
7.2 Model Equations . . . 206
7.2.1 Heat Transfer . . . 206
7.2.2 Combustion . . . 209
7.2.3 Gas Exchange . . . 210
7.3 Third-Party Optimization Software . . . 211
7.4 Modelling Results . . . 213
7.4.1 Comparison with Experimental Data . . . 213
7.4.2 Crossover Volume Effects . . . 216
7.4.3 Valve Timing Effects . . . 221
8 In-Cylinder Turbulence and Combustion Regime Estimation 232 8.1 Purpose and Scope . . . 232
8.2 RPV Flow Apparatus . . . 233
8.3 Flow Visualization . . . 236
8.3.1 General . . . 236
8.3.2 Hardware and Configuration . . . 237
8.3.3 Flow Seeding . . . 237
8.3.4 Visualization Results and Discussion . . . 237
8.4 Velocity Measurements . . . 239
8.4.1 General . . . 239
8.4.2 Laser-Doppler Velocimetry (LDV) . . . 240
8.4.3 LDV Hardware and Configuration . . . 247
8.4.4 Flow Seeding . . . 248
8.4.5 Velocity Analysis . . . 250
8.4.7 Results of a Flow into a Confined Volume . . . 254
8.4.8 Discussion of Results . . . 257
8.5 Estimates for Turbulence and Combustion . . . 261
8.5.1 Laminar Flame Properties . . . 261
8.5.2 Turbulence Length Scales . . . 262
8.5.3 Turbulence Time Scales . . . 263
8.5.4 Combustion Regime . . . 264
8.6 Summary . . . 268
9 Summary, Conclusions, and Recommendations 270 9.1 Summary . . . 270
9.2 Conclusions . . . 273
9.3 Summary of Contributions . . . 274
9.4 Recommendations and Future Work . . . 275
9.4.1 Engine Hardware . . . 275
9.4.2 Numerical Model . . . 276
9.4.3 Turbulence Measurements . . . 277
Bibliography 278
Appendix A CAD Drawings 291
Appendix B Assembly Schematics and Bill of Materials 333
Appendix C Matlab Files 344
Appendix D Calculations and Derivations 363
Appendix E LabVIEW Programming 372
Appendix F Dynamometer Calibration 385
List of Tables
2.1 Description and crank angle duration of processes shown in Figure 2.1. . . . 10
2.2 Breakdown of unburned hydrocarbon pathways [33]. . . 23
3.1 Split-Cycle engine specifications. . . 40
3.2 Comparison of cylinder head material choices. . . 54
3.3 Design constraints for reverse poppet camshaft profile design. . . 62
3.4 Reverse poppet valve spring specifications. . . 76
3.5 Summary of RPV rocker arm design revisions. . . 80
3.6 Intake and exhaust port parameters. . . 86
3.7 Preliminary valve timing based on a numeric engine simulation. . . 87
3.8 Intake/exhaust valve lift specifications. . . 87
4.1 Engine oiling system specifications. . . 102
4.2 Composition of test fuel. . . 108
4.3 Details of emissions analysis system. . . 110
4.4 Uncertainty in 4–20 mA analog inputs caused by resistor. . . 113
4.5 Overview of the engine pressure measurement hardware. . . 117
4.6 Thermocouple specifications. . . 120
4.7 Specifications of AEM inductive spark plug coil. . . 121
4.8 Injector calibration parameters. . . 123
4.9 First-order uncertainty of measured parameters. . . 128
5.1 Calculation intervals for polytropic indices; °CA. . . 136
6.1 General test specifications. . . 145
6.2 Average operating pressures of the crossover passage for all ignition timing and air/fuel ratio conditions. ± indicates standard deviation. . . 148
6.3 Valve timing adjustments made after initial operation. . . 160
6.4 Summary of combustion durations, decomposed into CA0−10 and CA10−90, for plots shown in Figures 6.27 to 6.32. . . 174
6.5 Summary of literary findings on MFB durations and associated test condi-tions, for CNG-fuelled engines. . . 182
7.1 Surface temperatures () used for AVL BOOST model. . . 208
7.2 Constants for port heat transfer coefficient - Equations (7.7) and (7.8). . . . 209
7.4 Specifications of selected cases (A, B, & C) from Figure 7.11. . . 224
7.5 Recommended crossover valve timing based on numerical engine simulation. 229 7.6 Effects of early and late crossover valve timing. . . 231
8.1 LDV signal processor configuration for the flat plate experiment. . . 252
8.2 Experimental LDV results for a RPV flow discharging onto a flat plate. Val-ues averaged from three independent trials. . . 253
B.1 BOM for throttle body; referenced to Figure B.1. . . 340
B.2 BOM for throttle body; referenced to Figure B.2. . . 340
B.3 BOM for air intake system; referenced to Figure B.3. . . 341
B.4 BOM for valvetrain components; referenced to Figure B.4 . . . 342
B.5 BOM for crank angle encoder assembly; referenced to Figure B.5 . . . 343
B.6 BOM for PTO shaft and support assembly; Figure B.6. . . 343
List of Figures
1.1 Energy density comparison of various fuels. . . 5
1.2 Global passenger vehicle CO2 emissions: historic levels and enacted regu-lations [133]. Data has been normalized to New European Driving Cycle (NEDC). . . 6
2.1 Illustration of split-cycle engine operating process. . . 10
2.2 Ideal pressure-volume diagrams of a split-cycle engine; compression cylinder (left), expansion cylinder(right). pi andpx are the intake port and crossover passage pressures, respectively. . . 11
2.3 Effect of polytropic index on isentropic compression of an ideal gas. . . 14
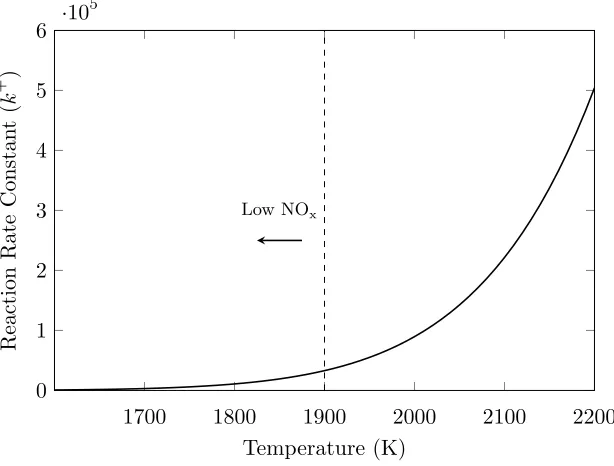
2.4 Ideal Otto cycle with additional expansion via Atkinson cycle (shaded area). 16 2.5 Dependence of NOx formation on temperature. . . 21
2.6 Typical variation in UHC, CO, O2, and NOx emissions as a function of equivalence ratio for a SI engine, adapted from [131]. . . 25
2.7 Rendering of turbulent jet ignition concept, adapted from [135]. . . 31
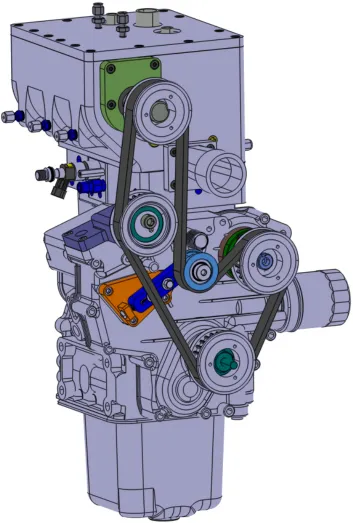
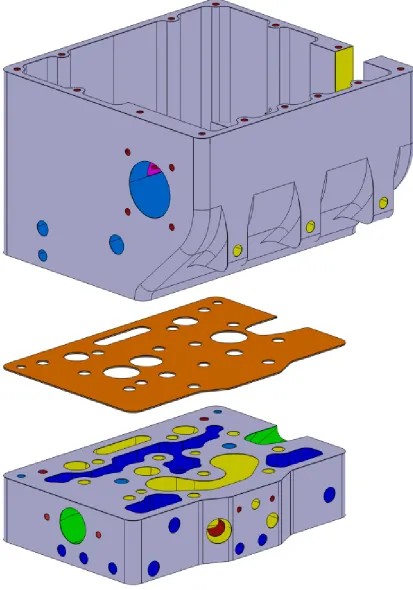
3.1 CAD rendering of split-cycle engine. . . 41
3.2 Depiction of crankshaft journal offset. . . 42
3.3 Exploded-view CAD rendering of split-cycle crankshaft. . . 43
3.4 Primary and secondary unbalanced forces of rotating and reciprocating mass in the split-cycle engine. . . 46
3.5 Magnitude of unbalanced force (in Newtons) of the split-cycle cranktrain. . 46
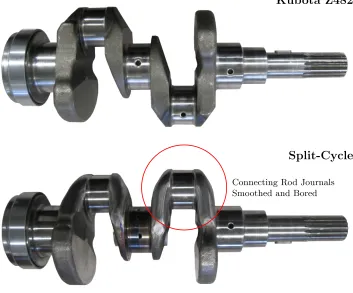
3.6 Original Kubota crankshaft (top) compared to the modified split-cycle ver-sion (bottom). Note the modified unit is shown before additional mass was added to the counterweights. . . 47
3.7 Piston-pin journal of connecting rod; original(left), modified (right) . . . . 48
3.8 Schematic of piston-top profile for the expansion cylinder. . . 48
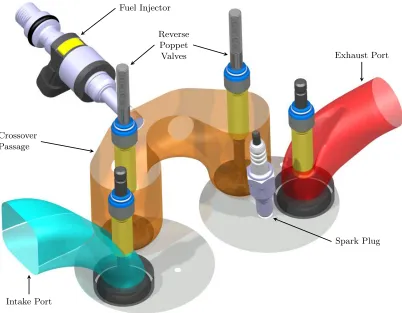
3.9 Split-cycle valve and port configuration. . . 51
3.10 Cross-sectional view of engine intake port: imitation of Kubota intake port for one-piece head design (left), extended port using two-piece head design (right) . . . 51
3.11 Two-piece cylinder head with copper gasket. . . 53
3.12 CAD drawing of cooling passages in lower cylinder head. . . 55
3.13 Angular difference between the reverse poppet valve and its seat. . . 56
3.15 Graphical representation of the location and approximate direction of the fuel spray inside the crossover passage. View is from the top side of the
cylinder head. . . 58
3.16 Photograph of fuel injector installed on engine. . . 59
3.17 Cross-sectional rendering of OHC valvetrain components. . . 60
3.18 Polytropic compression curve showing theoretical timing of pressure equal-ization between cylinder and crossover passage. . . 61
3.19 Lift curve for reverse poppet valves. . . 63
3.20 Geometry of overhead camshaft valvetrain. . . 64
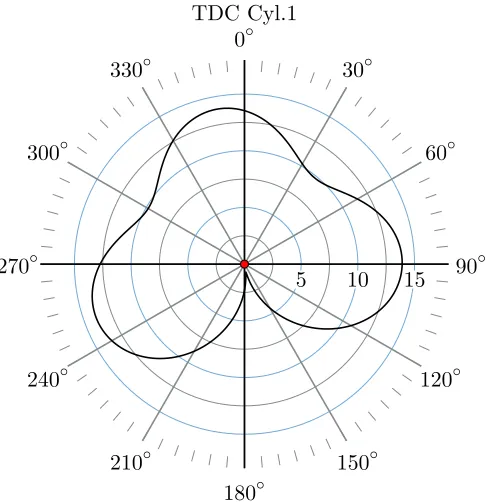
3.21 Camshaft profile and pitch curve shown on a polar coordinate system. . . . 66
3.22 LMS Virtual.Lab.Motion dynamic valvetrain model. . . 67
3.23 Comparison of kinematic and dynamically simulated valve lift. . . 68
3.24 Comparison of kinematic and dynamically simulated valve acceleration. . . 69
3.25 Design process used to develop the reverse poppet valvetrain. . . 70
3.26 Photograph of camshaft (base shaft, no lobes) for OHC valvetrain. . . 72
3.27 Progression of cam lobe profile during machining and polishing process. . . 72
3.28 CAD rendering of the OHC bearing and lubrication system. . . 73
3.29 Photograph of the reverse poppet valve designed in the present work. . . 74
3.30 Flow chart of programmatic valve spring selection using Matlab®. . . 76
3.31 Maximum allowable pressure difference (∆p=pc−px) as a function of the absolute pressure in the crossover passage, px. . . 77
3.32 CAD rendering of the valve spring bridge positioned in the upper cylinder head (left), and a detailed breakout view of the preload adjustment mecha-nism (right). . . 78
3.33 Finite Element Analysis (FEA) of the rocker arm for a 2 kN tappet force and 25.4µm bearing press-fit. Red contours indicate a Von-Mises stress around 400 MPa. . . 81
3.34 Photograph of fully assembled, DLC-coated, RPV rocker arms. Note the small tack welds on the follower bearing axle that were used to prevent the axle from moving during the swaging process. . . 81
3.35 Split-cycle pushrod valvetrain for used for intake and exhaust valves. . . 82
3.36 Photograph of original Kubota rocker shaft layout (left), compared with a CAD rendering of the split-cycle modified configuration (right). . . 83
3.37 Cross-sectional CAD rendering of locking taper mechanism machined into camshaft, providing phase adjustment for the intake and exhaust valve open-ing periods. . . 84
3.38 Pushrod camshaft: Kubota Z482(bottom); modified for split-cycle (top). . . 84
3.39 Intake / exhaust port flow area as a function of lift. . . 86
3.40 Intake and exhaust valve lift profiles. . . 88
3.41 Schematic of synchronous timing belt layout. Coordinates in mm. . . 89
3.42 Photograph of timing belt adjustment mechanisms. . . 89
3.43 Engine front cover: OE Kubota unit (left), modified for split-cycle (right). . 90
4.1 Plan view schematic of engine dynamometer test bed. . . 92
4.3 Exploded view of the engine dynamometer drive-line. . . 96
4.4 Bearing support for dynamometer drive belt pulley: attached to engine block for concentric machining (left); finished installation on engine (right). . . . 97
4.5 Photograph of the engine flywheel mounted on the belt drive stub-shaft. . . 97
4.6 Schematic of engine cooling system. . . 99
4.7 Left: Kubota Z482 cooling thermostat in stock location. Right: Thermostat moved to external mounting block to accommodate new cylinder head. . . . 99
4.8 Breakout view of externally mounted thermostat for engine cooling system. 100 4.9 Photograph of external oiling system used for cylinder head valvetrain com-ponents. Belt guard removed for photo. . . 101
4.10 Layout drawing of engine air intake system. Drawn to scale. . . 103
4.11 Photograph of laminar flow element connected to the differential pressure transmitter. The intake air temperature thermocouple is also visible. . . 103
4.12 LabVIEWsub-VI used to correct the intake air measurement under varying air quality conditions. . . 105
4.13 Photograph of the intake air throttle body assembly. Throttle position is adjusted using an electronic linear actuator (shown in the foreground) that is controlled via LabVIEW. . . 106
4.14 Throttle command voltage versus measured throttle position. . . 107
4.15 Plan view schematic of exhaust system (drawn to scale). . . 108
4.16 Schematic of fuel delivery system. . . 109
4.17 Photographs of the DAQ and electronic control cabinet. . . 111
4.18 CAD rendering of optical encoder mounted on the engine. . . 114
4.19 Output signals from BEI optical crankshaft encoder. . . 115
4.20 Mounting configuration of Kistler 6052C in-cylinder pressure transducer. . . 118
4.21 Piezoresistive pressure transducer cooling circuit. . . 119
4.22 Example of the spark coil dwell period in terms of crank angle degrees. . . . 122
4.23 Nominal current profile for a solenoid type injector showing controllable pa-rameters. Adapted from [48]. . . 123
4.24 Structure of LabVIEW VI for DAQ and low-level control. . . 125
4.25 Segment of LabVIEW VI block diagram used to configure simultaneous acquisition of analog data and crank angle position. . . 126
4.26 Structure of LabVIEW project for engine control. . . 127
5.1 Example of zero-level correction on the expansion cylinder pressure trace using the crossover passage pressure as a datum. Cold motoring conditions at 850 rpm. Raw = uncorrected floating measurement from sensor, Pegged = raw data adjusted for offset error using absolute crossover pressure. . . . 131
5.2 Comparison of pressure filtering methods used to reduce signal noise. . . 132
5.3 Comparison of mass fraction burned (MFB) calculation methods: modified Rassweiler and Withrow (MRW) versus normalized pressure ratio (PRN). Spark timings of 19°CA and 25°CA ATDC-e. . . 141
6.1 Maximum achieved load versus air/fuel equivalence ratio, WOT. . . 146
6.3 Example of pressure-volume diagrams for the compression cylinder (left)
and expansion cylinder (right). Data for 850 RPM, WOT, spark timing: 22°ATDC-e,φ= 1. . . 147 6.4 Logarithmic pressure-volume diagram of the compression cylinder for three
different engine speeds. . . 149 6.5 Example of expansion cylinder filling duration for engine speeds of 850 and
1200 RPM. . . 151 6.6 Average exhaust gas temperature (EGT) as a function of equivalence ratio. 153 6.7 Average exhaust gas temperature (EGT) as a function of ignition timing. . 153 6.8 Ensemble averaged crossover passage pressure traces showing injection event
every third cycle. SOI = Start Of Injection. . . 154 6.9 Average IMEP for first, second, and third cycle multiples, with fuel injection
during cycle three only. Stoichiometric air-fuel ratio (φ= 1). . . 155 6.10 Average IMEP for first, second, and third cycle multiples, with fuel injection
during cycle three only. Lean air-fuel ratio (φ≈0.95). . . 155 6.11 Comparison of volumetric efficiency between split-cycle and Kubota Z482
engines. Error bars indicate standard deviation of measurement. . . 157 6.12 Example of back flow through intake port of the split-cycle engine at IVO. . 158 6.13 Example of valve timing effect on compression cylinder pumping work. R1
and R2 stand for the valve timing revisions shown in Table 6.3. . . 159 6.14 Comparison of two cycles at identical operating conditions, illustrating the
crossover outlet valve being pushed open by combustion pressure. . . 161 6.15 Maximum allowable pressure difference between cylinder and crossover
pas-sage as a function of the absolute pressure in the crossover paspas-sage. Operat-ing regime is shown to be at upper limit of valve closure force under realistic area-ratio conditions. . . 162 6.16 Photograph indicating leaking oil seal during blow-by tests. . . 163 6.17 Comparison of equivalence ratio based on measurements from: exhaust lambda
meter, upstream air and fuel flow rates, and exhaust gas composition. . . . 165 6.18 Example of combustion and crossover pressure traces leading up to and
dur-ing backfire event. . . 166 6.19 Temperature profiles of the crossover passage and exhaust gases during
suc-cessive backfire events. . . 168 6.20 Crossover pressure trace showing sustained autoignition within the passage. 168 6.21 Stacked bar plot showing breakdown of CA0−90into early flame development
period (CA0−10) and main burn duration (CA10−90). Modified Rassweiler and Withrow (MRW) calculation method has been included to show error in CA0−10. φ= 1 and WOT conditions. . . 170 6.22 Effect of spark timing on the average early flame development period (CA0−10).
φ= 1, WOT. . . 171 6.23 Effect of spark timing on the average main combustion duration period
(CA10−90). φ= 1, WOT. . . 171 6.24 Effect of air-fuel equivalence ratio on the average early flame development
6.26 Three-hundred consecutive-cycle dataset showing correlation of early flame
development period (CA0−10) with main combustion duration (CA10−90). . 174
6.27 Comparison of expansion cylinder pressure and mass fraction burned (MFB) profiles, for the fastest and slowest burning cycles in a 300 consecutive-cycle data set, with the ensemble averaged data. Engine speed = 850 RPM. . . 175
6.28 Comparison of expansion cylinder pressure and mass fraction burned (MFB) profiles, for the fastest and slowest burning cycles in a 300 consecutive-cycle data set, with the ensemble averaged data. Engine speed = 1000 RPM. . . 175
6.29 Comparison of expansion cylinder pressure and mass fraction burned (MFB) profiles, for the fastest and slowest burning cycles in a 300 consecutive-cycle data set, with the ensemble averaged data. Engine speed = 1200 RPM. . . 176
6.30 Comparison of expansion cylinder pressure and mass fraction burned (MFB) profiles, for the fastest and slowest burning cycles in a 300 consecutive-cycle data set, with the ensemble averaged data. Engine speed = 850 RPM. . . 176
6.31 Comparison of expansion cylinder pressure and mass fraction burned (MFB) profiles, for the fastest and slowest burning cycles in a 300 consecutive-cycle data set, with the ensemble averaged data. Engine speed = 1000 RPM. . . 177
6.32 Comparison of expansion cylinder pressure and mass fraction burned (MFB) profiles, for the fastest and slowest burning cycles in a 300 consecutive-cycle data set, with the ensemble averaged data. Engine speed = 1200 RPM. . . 177
6.33 Frequency distributions of CA0−90 burn durations for Figures 6.27 to 6.32. . 180
6.34 Typical SI engine combustion phasing compared with split-cycle phasing. . 183
6.35 Phasing of average peak combustion pressure as a function of spark timing. 185 6.36 Phasing of average peak combustion pressure as a function of air/fuel equiv-alence ratio. . . 185
6.37 Example of phasing between the expansion cylinder pressure, the pressure rise rate (PRR), and the mass fraction burned (MFB). . . 186
6.38 Individual-cycle maximum combustion pressure versus the crank angle at which it occurs, known as the location of peak pressure (LPP). Three different spark timings are shown for each engine speed. All data is for stoichiometric operation. . . 187
6.39 COVIMEP and COVLPP as a function of ignition timing. . . 188
6.40 Increase in COVIMEP with decreasing air/fuel equivalence ratio. . . 190
6.41 Increase in COVLPP with decreasing air/fuel equivalence ratio. . . 190
6.42 Comparison of adjacent-cycle IMEP correlations between stoichiometric (φ= 1) and lean (φ= 0.85) burn conditions. . . 191
6.43 Effect of spark timing on exhaust gas emissions. . . 194
6.44 Effect of air/fuel ratio on exhaust gas emissions. . . 197
6.45 Control volume used for energy balance of engine. . . 199
6.46 Breakdown of fuel energy pathways as a function of equivalence ratio. . . . 202
7.1 Block diagram of numerical split-cycle engine model in AVL BOOST. . . . 206
7.2 Valve port discharge coefficients as a function of lift. . . 211
7.3 Feedback flow diagram between modeFRONTIER® and AVL BOOST. . . 212
7.5 Comparison of measured and simulated pressure traces for the split-cycle
engine operating at 850 RPM, WOT, φ= 1, spark timing 20°CA ATDC-e. . 215
7.6 Effect of crossover volume on net IMEP. . . 217
7.7 Effect of crossover volume on crossover pressure. . . 218
7.8 Relationship between crossover passage volume and combined geometric com-pression ratio. . . 219
7.9 Effect of combined geometric compression ratio on net IMEP and average crossover passage pressure. . . 219
7.10 Screenshot of modeFRONTIER® work flow model. . . 223
7.11 Trade-off between net IMEP and crossover pressure for 750 different combi-nations of crossover valve and spark timing. . . 224
7.12 Engine pressure curves for select cases A, B, and C. . . 225
7.13 Pearson correlation coefficients for changes in crossover valve timing. . . 226
8.1 Photograph of RPV flow visualization apparatus. . . 233
8.2 Breakout view of pressure chamber used for RPV flow measurements. . . . 235
8.3 Dimensioned schematic of pressure chamber. (Units: mm) . . . 236
8.4 Time-lapse photographs of a pressurized flow discharging through a reverse poppet valve and impinging on a flat plate. . . 238
8.5 Illustration of dual-beam LDV measurement volume. . . 240
8.6 Example of optical wave interference creating a beat frequency. . . 241
8.7 Illustration of a characteristic Doppler burst. . . 242
8.8 Illustration of LDV fringe model. . . 242
8.9 Illustration of frequency shifting used for flow-reversal measurements. . . . 244
8.10 Illustration of beam refraction through on-axis optical window. . . 247
8.11 Schematic of dual-beam LDV experimental apparatus. . . 248
8.12 Breakout view of apparatus constructed to generate seeding particles (fog) for LDV measurements. . . 249
8.13 Location of measurements for the flat plate LDV experiment. . . 251
8.14 Example of sequential velocity measurements taken for a pressurized flow discharging through a reverse poppet valve and impinging on a flat plate (left). Enhanced view for t = 0–0.1 s (right). 5–30 MHz bandpass filter, 7 MHz frequency shift. . . 253
8.15 Results for a pressurized flow discharging through a reverse poppet valve and impinging on a flat plate; mean velocity(top), and RMS velocity fluctuations (bottom). Error bars show standard error of three repeated measurements. . 254
8.16 Photograph of optical chamber attached to RPV flow apparatus. Note: the valve and chamber are upside-down to prevent condensate from collecting in the optical chamber. . . 255
8.17 Plan view of the chamber used for confined-flow velocity measurements. . . 255
8.18 Comparison of pressure traces: RPV flow into optical chamber versus mo-tored engine at 1000 RPM. . . 257
8.20 Combustion phase diagram adapted from Borghi [21], showing estimated
regime of split-cycle engine. . . 265
8.21 Estimated combustion strain rates as a function of u0o/uL for the limits of ignition timing and equivalence ratio that were empirically evaluated. . . . 268
B.1 Assembly drawing for intake air throttle body; refer to Table B.1 for details. 333 B.2 Assembly drawing for intake air throttle body; refer to Table B.2 for details. 334 B.3 Schematic of air intake system for engine; refer to Table B.3 for details. . . 335
B.4 Assembly drawing of select valvetrain components; refer to Table B.4 for details. . . 336
B.5 Assembly drawing of crank angle encoder components; refer to Table B.5 for details. . . 337
B.6 Assembly drawing of engine PTO shaft and support components; refer to Table B.6 for details. . . 338
B.7 Assembly drawing of engine-dynamometer belt tensioner; refer to Table B.7 for details. . . 339
E.1 Block diagram of DAQ and low-level control VI. . . 373
E.2 Breakdown of VI segments shown in Figures E.3 to E.7. . . 374
E.3 Block diagram of section A. . . 375
E.4 Block diagram of section B. . . 376
E.5 Block diagram of section C. . . 377
E.6 Block diagram of section D. . . 378
E.7 Block diagram of section E. . . 379
E.8 Screenshot of LabVIEWVI used for engine monitoring, DAQ, and low-level control. . . 380
E.9 Block diagram of engine control VI on the FPGA target. . . 381
E.10 Block diagram of engine control VI on the RT target. (Top; page 1/2) . . . 382
E.11 Block diagram of engine control VI on the RT target. (Bottom; page 2/2) . 383 E.12 Screenshot of LabVIEW VI used for engine fuel and spark control. . . 384
Abbreviations
ABDC After Bottom Dead Centre
AC Alternating Current
AFR Air-to-Fuel Ratio
ASTM American Society for Testing and Materials
ATDC After Top Dead Centre
BBDC Before Bottom Dead Centre
BDC Bottom Dead Centre
BHN Brinell Hardness Number
BIP Bowl-In-Piston
BMEP Brake Mean Effective Pressure
BSFC Brake Specific Fuel Consumption
BTDC Before Top Dead Centre
CAD Computer Aided Drafting
CFD Computational Fluid Dynamics
CGI Compacted Graphite Iron
CI Compression Ignition
CNC Computer Numerically Controlled
CNG Compressed Natural Gas
COV Coefficient of Variation
DAQ Data Acquisition System
DI Direct Injection
DLC Diamond-Like Carbon
DOE Design of Experiments
EGR Exhaust Gas Recirculation
EGT Exhaust Gas Temperature
EOC End of Combustion
EPA Environmental Protection Agency
EVC Exhaust Valve Closing
EVO Exhaust Valve Opening
FEA Finite Element Analysis
FMEP Friction Mean Effective Pressure
FPGA Field Programmable Gate Array
GHG Greenhouse Gas
HC Hydrocarbon
HEX Heat Exchanger
HRC Hardness Rockwell C-scale
IDI Indirect Injection
IMEP Indicated Mean Effective Pressure
ISO International Organization for Standardization
IVC Intake Valve Closure
IVO Intake Valve Opening
LFE Laminar Flow Element
LNG Liquefied Natural Gas
LPP Location of Peak Pressure
LTC Low Temperature Combustion
MBT Mean Best Torque
MEP Mean Effective Pressure
MFB Mass Fraction Burned
MRW Modified Rassweiler and Withrow
NEDC New European Driving Cycle
NG Natural Gas
NI National Instruments
NMHC Non-Methane Hydrocarbon
NMOG Non-Methane Organic Gas
OD Outside Diameter
OE Original Equipment
OHC Overhead Camshaft
PR Pressure Ratio
PRN Normalized Pressure Ratio
PRR Pressure Rise Rate
RH Relative Humidity
RON Research Octane Number
RPM Revolutions Per Minute
RPV Reverse Poppet Valve
RSS Root Sum Squared
RT Real Time
SE Standard Error (of the mean)
SI Spark Ignition
SOC Start of Combustion
SOI Start of Injection
TC Thermocouple
TDC Top Dead Centre
THC Total Hydrocarbon
TKE Turbulent Kinetic Energy
TTL Transistor-Transistor Logic
TWCC Three-Way Catalytic Converter
UEGO Universal Exhaust Gas Oxygen
UHC Unburned Hydrocarbon
VI Virtual Instrument
WOT Wide Open Throttle
XIVC Crossover Inlet Valve Closing
XIVO Crossover Inlet Valve Opening
XOVC Crossover Outlet Valve Closing
Units
% Percent
ppm Parts Per Million
° Degrees (temperature or angle)
C Celsius
K Kelvin
µm Micrometre
mm Millimetre
cm Centimetre
m Metre
km Kilometre
L Litre
SLPM Standard Litres Per Minute
g Gram
kg Kilogram
N Newton
kN Kilonewton
Pa Pascal
kPa Kilopascal
MPa Megapascal
GPa Gigapascal
W Watt
MW Megawatt
kWh Kilowatt-hour
HP Horsepower
s Second
Hz Hertz
kHz Kilohertz
MHz Megahertz
S Sample
kS Kilo-sample
MS Mega-sample
mA Milliamp
A Amp
kV Kilovolt
Notation
°CA Degree crank angle
B Engine bore
CA0−10 Crank angle of 0–10 % mass burned CA10−90 Crank angle of 10–90 % mass burned
Cd Flow discharge coefficient
CRgc Combined geometric compression ratio
cp Constant pressure specific heat capacity
cV Constant volume specific heat capacity
D Mass diffusivity
Da Damk¨ohler number
df Fringe spacing
dmv Measurement volume diameter
fD Doppler frequency
fs Frequency shift
h Specific enthalpy
hc Cylinder clearance height ˜
h◦, ˜h◦f Sensible, formation molar enthalpy
K Karlovitz strain parameter
Ka Karlovitz number
k Thermal conductivity
ke Turbulent kinetic energy
Le Lewis number
lk Kolmogorov length scale
lo Integral length scale
˙
m Mass flow rate
NF Number of fringes in the measurement volume
Ns Number of moving fringes to pass a stationary particle
Nu Nusselt number
n Polytropic index, refractive index, number of moles
nc,ne Polytropic index of compression, expansion ˙
ne Molar exhaust flow rate
Pr Prandtl number
¯
px Mean crossover passage pressure
pmax Maximum combustion pressure ˙
Q Heat-transfer rate
QLHV Fuel lower heating value
R Radius
Re,ReT Reynolds number, turbulent Reynolds number
SL Laminar flame propagation speed ¯
Sp Mean piston speed
T Temperature
Tw Wall temperature
t Time, thickness
tk Kolmogorov eddy turnover time
uk Kolmogorov eddy velocity
uL Laminar burning velocity
uo Integral eddy velocity
uT Turbulent burning velocity ¯
u Mean fluid velocity
u⊥p Particle velocity perpendicular to fringes
u0 RMS velocity fluctuations, u- component
V Volume
Vd Cylinder displacement volume
v0 RMS velocity fluctuations, v- component ˙
W Work per unit time
˜
xi Wet mole fraction of speciesi x∗i Dry mole fraction of speciesi
xmv Measurement volume shift through planar window
α Thermal diffusivity, laser beam half-angle
γ Ratio of specific heat capacities
δL Laminar flame thickness
δL,ph Preheat layer thickness of laminar flame
δR Reaction layer thickness of laminar flame
Turbulence dissipation rate
θ Crank angle
θign Crank angle for spark ignition
λ0 Wavelength
µ Dynamic viscosity
ν Kinematic viscosity
ρ Density
ρb Burned gas density
ρu Unburned gas density
σ Standard Deviation
Chapter 1
Introduction
1.1
Overview
Natural gas (NG) offers many advantages over other fuels commonly used for internal combustion engines. These include: a high resistance to auto-ignition, wide flammability
limits, stability under environmental extremes, low evaporative emissions, non-corrosive, and low levels of harmful exhaust gases. Natural gas is also globally abundant, making it
relatively inexpensive compared with heavily refined fuel oils, such as diesel and gasoline. Despite the broad acceptance of these facts, the North American automotive sector is still
largely powered by oil-based fuels. As of 2014, it is estimated that only 112,000 NG vehicles are on the road in the United States, compared to the 14.8 million that exist world-wide [38]. In part, commodity pricing plays a role in the resistance to change. A recent reduction in
oil prices led to a 6.5 % decrease in the sale of NG vehicles in 2014 [105]. Distribution is another factor, with only 864 public compressed natural gas (CNG) refuelling stations
currently operating in the United States [141], and a mere 80 in Canada [31]. But economic and infrastructure issues aside, one of the primary deterrents for engine manufacturers to
switch to NG is the notable reduction in performance that follows. When a conventional, gasoline spark ignition (SI) engine is converted to run on NG, the power output is generally reduced by 10–15 % [35].
The objective of this dissertation is to address the underlying performance issues associated with burning natural gas in a SI engine. The problem was approached from the point of
converting an engine designed for gasoline or diesel to operate on NG. As such, this work has led to the use of a non-conventional engine architecture, known as a split-cycle engine.
A thorough presentation on split-cycle engine operation and its potential benefits will be
covered in Chapter 2, but for now it is sufficient that the reader understands its basic operating premise. The term “split-cycle” refers to the four-stroke process of a conventional engine being divided between two adjoining cylinders. One cylinder performs the intake
and compression of the gas, the second cylinder receives the compressed gas for combustion (expansion) and subsequent exhausting of the products. The exchange process from one
cylinder to the other is a source for generating fluid turbulence, which is beneficial for both air/fuel mixing and fast combustion. Since no commercially available split-cycle engines
currently exist, the design and construction of the engine used in this research constitutes a significant part of the dissertation.
Before the application of split-cycle architecture is discussed, it is necessary to understand the cause of NG engine deficiency. The performance reduction primarily stems from two
properties of the fuel: the density, and the laminar flame speed.
At normal temperature and pressure (NTP)1, NG is in vapour form with a density that is roughly 60 % that of air, and only 14 % that of gasoline vapour. When NG is injected into
the intake manifold it displaces a considerable portion of air that would otherwise enter the engine cylinder, resulting in a reduction to the engine’s volumetric efficiency. There is a slight offsetting advantage from the fact that the stoichiometric (gravimetric) air/fuel ratio
of NG is approximately 1.2 times that of gasoline, meaning less fuel is required per unit mass of air. However, this is of little significance given the large discrepancy in density.
To put this into perspective, consider an engine cylinder with a 1 litre displacement. A stoichiometric air-fuel ratio would require approximately 1.6 % of the cylinder volume to be filled with gasoline, versus 9.5 % for natural gas. In practice, dynamic flow effects and
the absence of latent heat, which is usually present from the evaporation of liquid fuels, further impede cylinder filling. A study performed by Evans and Blaszczyk [53] found a 12%
reduction in brake mean effective pressure (BMEP) when converting a port-injected gasoline engine to run on NG, which they attributed solely to a reduced volumetric efficiency. The
reduction has been found to range anywhere from 10 % to 15 %, depending on the operating conditions [28, 126].
With advances in injector technology, the displacement of intake air can be circumvented by injecting the fuel directly into the engine cylinder, referred to as direct injection (DI),
provided it is done after the intake valve closes. However, due to the small momentum of
the gas jet, mixing between the fuel plume and the air is difficult. Therefore, a trade-off exists: injection before intake valve closure (IVC) ensures mixture uniformity, since the
turbulence level is high during this period and the mixing time is longer; and conversely, injection after IVC improves volumetric efficiency, but is more likely to generate a stratified
mixture [15, 150].
The second property of NG that presents an issue is the laminar burning velocity (uL): de-fined as the flame velocity relative to the unburned reactants [117]. Natural gas is composed
almost entirely of methane (CH4), approximately 96 % by volume, 93 % by mass2, with the remaining constituents including ethane, propane and butane, as well as small quantities of
carbon dioxide, nitrogen and various trace impurities [53]. Of all the hydrocarbon species, methane has the lowest laminar burning velocity, uL ≈ 0.37 m/s [142], translating into a reduced rate of reaction for NG combustion. Despite the fact that engines operate in a tur-bulent combustion regime, the laminar flamelet concept stipulates that a turtur-bulent flame is an aggregate of many asymptotically thin laminar flames [113]. As a consequence, the
laminar flame speed remains an important aspect for combustion in engines.
Experimental studies have shown that the combustion duration does indeed increase when
fuelling is switched from gasoline to natural gas [53, 60, 76]. To compensate for the increased burn duration, spark timing must be advanced to maintain the location of peak cylinder
pressure in the vicinity of piston top dead centre (TDC). When converting an engine from gasoline to NG, without making any changes to the compression ratio, spark timing advances of between 2°CA and 10°CA are required to retain mean-best-torque (MBT) conditions [53].
The inherent problem with advanced combustion phasing is the rise in cylinder pressure before TDC, which requires more compression work and increases heat transfer from the
combustion chamber. In a study performed by Jones and Evans [76], the reduction in overall efficiency, caused by the aforementioned parameters, was found to be 5 %. For these
reasons, it is important to maintain a high rate of combustion when using NG in a SI engine.
It is well known that the rate of combustion can be enhanced by increasing the level of in-cylinder turbulence immediately prior to, and throughout, combustion [39, 61, 70, 94]. In
fact, turbulent flame speeds in engines are an order of magnitude higher than their respective laminar flame speed [17], which allows combustion to finish within the allotted time frame.
The purpose of this research was to investigate whether the turbulent flow-field inherently produced within the combustion chamber of the split-cycle engine is sufficient to provide
a rate of combustion higher than that in conventional SI engines. Since the increment in turbulent flame speed is known to decay with increasing turbulence intensity [22], it was
decidedly important to quantify the level of turbulence within the split-cycle engine, thus providing a reference for the pressure-derived combustion rates. Velocity measurements
have been made to assess the turbulence characteristics in a physically simulated split-cycle combustion chamber, and the results were used to provide insight into the combustion
regime and its limitations.
The use of split-cycle architecture also provided a new option for the physical location of the fuel injector: inside the passage that connects the two engine cylinders together. By
locating the injector here, fuel can be introduced after the intake valve has closed—thus not affecting volumetric efficiency—but unlike direct injection, the fuel injector is not subjected
to the high temperatures of combustion. Furthermore, by using a novel injection timing, there is still ample amount of time for fuel/air mixing prior to combustion. In essence, this
constitutes the best of both configurations.
1.2
Big-Picture Implications
It is reasonable to wonder if the reduced engine performance caused by NG is an acceptable trade-off to benefit from lower fuel costs and reduced exhaust emissions. However, one must
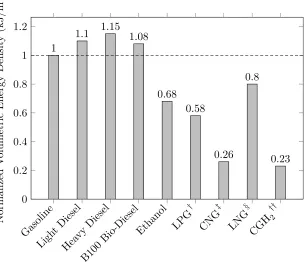
further consider the impact the fuel density has on storage and transportation. Figure 1.1 shows a volumetric energy-density comparison between common fuel types, normalized
using gasoline at NTP conditions. It can be seen that compressed natural gas (CNG) requires approximately four times the volume of gasoline, and five times the volume of
diesel, to produce an equivalent energy content—even when pressurized to 248 bar, which is the standard for many CNG fuel systems [38]. The high storage pressure requires the use of cylindrical pressure vessels, constructed of steel or composite material, which limits
conformability to the vehicle chassis and adds considerable weight, meaning the reduced engine performance will be exacerbated by a heavier fuelling system. In addition, packaging
constraints are unlikely to allow the fuel tank to be enlarged by 400 % for CNG, so reduced range is almost inevitable. Consider, for example, the 2015 Honda Civic: the CNG-powered model has a total range of 311 km (193 miles) per tank, compared to the gasoline-powered
model, which achieves 702 km (436 miles) per tank [140]. Thus, it is obvious that the range of NG vehicles should be improved, and better engine efficiency is one means of doing so.
Furthermore, on-going research towards higher-density storage methods for NG decreases the margin of energy-density disparity. Liquefied natural gas (LNG) systems are now
Gasoline Ligh tDi esel Hea vyDiesel B100 Bio-Diese l Ethanol LPG † CNG ‡ LNG § CGH 2 †† 0
0.2 0.4 0.6 0.8 1 1.2
1
1.1 1.15 1.08
0.68 0.58
0.26 0.8
0.23
Normalized V olumetric Energy Densit y (kJ/m 3 )
*All standard liquid fuel densities calculated at NTP conditions.
20 bar, 80% liquid 248 bar, 300 K §1.3 bar, 111 K 680 bar, 300 K
Figure 1.1: Energy density comparison of various fuels.
much closer to gasoline, as shown in Figure 1.1. Adsorbed natural gas (ANG)3 is another
promising alternative that allows higher densities to be achieved at a relatively low pressure, without the cryogenic storage complexity of LNG. In either case, the fuel enters the engine
in a vaporized state, thus the combustion and emission characteristics discussed within this work can be considered applicable to all NG engines, regardless of how the fuel is stored.
Of greater consequence is the potential for greenhouse gas (GHG) savings associated with using NG in place of gasoline or diesel. The low carbon-to-hydrogen ratio of methane (the primary constituent in NG) means approximately 20 % less CO2 is produced per unit
energy of fuel when compared with gasoline4. This net reduction in CO2 is not trivial, since regulatory agencies in Canada and the United States have implemented fleet-wide
CO2emission regulations for all on-road, light-duty vehicles beginning with the 2012 model year. By 2016 the fleet-wide average CO2 emissions must be below 155 g/km, and further
reduced to 100 g/km by model year 2025 [49]. To put this into perspective, the global
3 ANG uses a porous carbon medium to store the fuel in its adsorbed state, at a pressure of 35 bar, but
with an energy density similar to CNG [27].
20000 2005 2010 2015 2020 2025 50
100 150 200 250 300
Past Levels
Enacted Regulations
Model Year gCO
2
km
Canada USA China Europe
India Japan
Figure 1.2: Global passenger vehicle CO2emissions: historic levels and enacted
regulations [133]. Data has been normalized to New European Driving Cycle (NEDC).
historical trends of light-duty vehicle CO2 emissions and enacted future regulations5 are shown in Figure 1.2. It can be seen that over the next 10 years the total CO2 emitted by
light-duty vehicle fleets in North America is mandated to reduce by approximately 35 %.
In light of these future regulations, the inherently lower CO2produced from NG combustion
makes it an increasingly attractive alternative fuel. If the deficiencies associated with its use in internal combustion engines can be reduced, the potential for mass-market adoption in North America can be improved. Despite the focus on automotive implications, it is
impor-tant to note that this research also applies to other reciprocating-engine based applications, such as stationary power generation.
1.3
Research Objectives
The primary objectives of this research were as follows:
1) To determine experimentally, if split-cycle engine architecture could help alleviate the
short-comings of natural gas-fuelled, SI engines. Particular emphasis was placed on enhancing the rate of combustion without compromising the exhaust gas emissions.
5 Enacted regulations are sanctioned by federal governing bodies. In Canada, on-road vehicle emissions are
2) To investigate whether a novel location and timing of the fuel injector, afforded by using split-cycle engine architecture, could improve volumetric efficiency and air/fuel
mixing in comparison to conventional NG engines (either port- or direct-injected).
3) To provide some quantifying evidence for the first research objective in regards to the levels of turbulence generated inside the split-cycle engine, and their predicted impacted on combustion.
To accomplish the primary objectives, it was necessary to establish some secondary objec-tives. These were to:
a) Design, manufacture, and assemble a suitable split-cycle engine.
b) Construct an engine dynamometer test platform and instrument for data collection.
c) Program the software necessary for data acquisition and control of the engine.
d) Generate a 1-D computer simulated engine model to determine the initial valve timing
for the engine, and examine how valve timing affects performance.
e) Build a test apparatus that mimics the in-cylinder flow-field conditions of the split-cycle engine’s combustion chamber, including optical access for measuring equipment.
1.4
Organization of Thesis
The organization of the remainder of this document is as follows:
Chapter 2: explains in detail how the split-cycle engine operates, along with some
ad-ditional benefits to its configuration. A review of the performance and emissions characteristics of NG engines is provided in conjunction with the
current research that is being explored to improve them.
Chapter 3: details the design of the split-cycle engine with an emphasis on the devel-opment of a fast-acting valvetrain.
Chapter 4: covers the construction of the engine test platform, including the data ac-quisition and engine control systems.
Chapter 6: presents the experimental results obtained from the split-cycle engine. This chapter is interleaved with discussion to provide clarity and relevance of the
information at hand. General operating characteristics and limitations are also presented in this chapter.
Chapter 7: presents a 1-D gas dynamic simulation model of the split-cycle engine. Re-sults from the model are compared with empirical data obtained in Chap-ter 6. The implications of valve timing and crossover passage sizing are also
investigated.
Chapter 8: addresses item 3) from the primary objectives list in Section 1.3 by
empir-ically investigating the flow field downstream from a reverse poppet valve under conditions similar to that in the split-cycle engine. The measure-ments taken in this chapter are used to predict the turbulence properties
and corresponding combustion regime present in the split-cycle engine.
Chapter 9: summarizes the work as a whole, and concisely outlines the conclusions and
Chapter 2
Background
2.1
The Split-Cycle Engine: An Introduction
2.1.1 Operating Principles
As its name implies, the split-cycle engine separates the standard four-stroke cycle between two interconnected cylinders: one for intake and compression, and the other for combustion
and exhaust. Each process requires one stroke of the piston (180°CA), thus a cycle is complete in one crankshaft revolution. In this manner, the number of power strokes per
revolution in the split-cycle engine is the same as a conventional four-stroke engine, provided it has an identical number of cylinders. An illustration of the split-cycle process is shown in Figure 2.1, along with a basic description of the cycle process given in Table 2.1. The
left-hand side and right-hand side cylinders shown in Figure 2.1 are referred to as the
compression cylinder and the expansion cylinder, respectively, in Table 2.1. Nearing the
end of the compression stroke, the air in the compression cylinder is transferred into a small intermediary volume that connects the two cylinders together; this will hereafter be
referred to as the crossover passage. Note that the configuration of the crossover passage can vary for different split-cycle engines; the information provided in this chapter refers to the type of passage used in this work. Further information on the selection of this particular
configuration can be found in Section 2.1.5.
It can be seen from Figure 2.1 that a slight difference in piston phasing between the two
cylinders is present, with the expansion cylinder leading the compression cylinder. This allows the expansion cylinder to reach top dead centre (TDC) on its exhaust stroke, and
1 2 3 4
Figure 2.1: Illustration of split-cycle engine operating process.
Table 2.1: Description and crank angle duration of processes shown in Figure 2.1.
Process ∆ Crank Angle Compression Cyl. Expansion Cyl.
1–2 ∼150° Compression Exhaust
2–3 ∼30° Transfer to Passage Exhaust
3–4 ∼20° Intake Transfer from Passage
4–1 ∼160° Intake Expansion
*In actuality, processes 2–3 and 3–4 overlap considerably.
**
All crank angle durations are rough approximations.
During this time, both crossover valves are opened, simultaneously allowing air in and out
of the crossover passage. As such, the mass inside the crossover passage remains constant (ideally), and therefore approximately isobaric. This is somewhat analogous to a tube filled
with a single row of marbles; as a marble is inserted in one end, another marble is pushed out the opposite end. The magnitude of the crossover pressure is a function of the geometric compression ratio and the crossover volume itself (see Chapter 7), and can be expected to
fall within the range of a typical post-compression cylinder pressure.
In current practice, fuel is injected in one of two ways: at the backside of the crossover
outlet valve while it is open [115], or directly into the expansion cylinder [103]. In both cases, the injection timing and/or valve timing must be carefully selected to prevent
short-circuiting of raw fuel into the exhaust stream. From the time the exhaust valve closes near TDC, air and fuel must be brought into the expansion cylinder, mixed, and ignited in quick succession before the piston recedes too far on its expansion stroke. The fact that
combustion is initiated after TDC is one of the key differences between a conventional SI engine and the split-cycle engine. Once combustion has been initiated by the spark plug,
The compression piston follows on its intake stroke, after closing of the crossover inlet valve at piston TDC. Once both pistons reach BDC, the subsequent compression and exhaust
strokes indicates the start of the next cycle.
From a thermodynamic approach, the idealized split-cycle engine process can be represented
on a pressure-volume diagram according to Figure 2.2, where the left- and right-hand plots represent the compression and expansion cylinders, respectively. A description of each process path is given below. Note that the actual engine process is given first, with the
idealized, closed-system process given afterwards in parenthesis.
TDC BDC
pi
px
1 2
3
4
Volume
Pressure
TDC BDC
1 2
3
4 5
6
Volume
Pressure
Figure 2.2: Ideal pressure-volume diagrams of a split-cycle engine; compression cylinder
(left), expansion cylinder (right). pi andpx are the intake port and crossover passage
pressures, respectively.
Compression Cylinder
(1-2) Polytropic compression process (isentropic compression) (2-3) Fluid transfer into crossover passage (isobaric heat rejection)
(3-4) Polytropic expansion of residual air (isentropic expansion) (4-1) Intake process (isobaric heat addition)
Expansion Cylinder
(1-2) Exhaust process (isobaric heat rejection)
(2-3) Transfer of pressurized fluid into cylinder (isochoric heat addition)
(3-4) Constant volume portion of combustion (isochoric heat addition) (4-5) Constant pressure portion of combustion (isobaric heat addition)
In reality, the transfer process, (2-3) in both diagrams, will not occur under isobaric or isochoric conditions due to the dynamics of the engine. Also, process (3-4) in the
compres-sion cylinder may or may not fully re-expand to atmospheric conditions before the intake valve is opened, depending on the intake valve timing. Point 3, in actuality, is unlikely to
have the same magnitude for both diagrams, due to heat transfer in the crossover passage. And since cylinder filling requires a finite amount of time, the alignment of points (2-3-4) in the right-hand figure will be impossible to achieve in practice. The same can be said for
points (3-4-5), which will be heavily rounded due to heat transfer and the finite duration of combustion, during which time the piston never stops moving.
2.1.2 Split-Cycle Challenges
The foreseeable challenges associated with split-cycle engine architecture originate from the
additional heat and mass losses associated with transferring the fluid from one cylinder to the other. To the best of the author’s knowledge, no literature that is specific to split-cycle
engines currently exists on the magnitude of these losses. However, it can be expected that the increased surface area of the crossover passage walls, in conjunction with the additional
time between compression and combustion, will lead to higher heat losses from the com-pressed gas. The high flow velocity past the crossover outlet valve may also contribute to higher than normal heat transfer.
Flow losses are expected to primarily depend on the engine’s ability to transfer the entire contents of the compression cylinder into the crossover passage during each cycle. It is
for this reason that the split-cycle developed in this work has adopted the use of reverse poppet valves, which is discussed further in Section 3.5. At engine speeds beyond those
tested in this work, where the flow time required to fill the expansion cylinder approaches the crossover outlet valve opening time, frictional flow losses may also become an issue.
Mechanical friction losses in a well-designed split-cycle engine are not expected to be sig-nificantly more than those of a conventional spark-ignition engine. Between split-cycle and conventional engine architectures, the same number of cylinders exists for an equal number
of combustion cycles per revolution. The total number of valves is also the same; however, the spring pressure required for a fast-acting reverse poppet valve is expected to be higher
than a conventional valve, resulting in some additional valvetrain friction. It is worthwhile to note that the split-cycle developed in this work has not been optimized to reduce me-chanical friction losses. Recommendations for future engine improvements in regards to
2.1.3 Split-Cycle Advantages
There are numerous advantages to using split-cycle engine architecture. Some are inherent in the basic operating premise of the engine, while others must be sought after through
additional means. The latter will be discussed briefly here, but were not utilized in this work, as it will be explicitly stated. The following advantages are in no particular order.
In-Cylinder Turbulence
As mentioned in Chapter 1, in-cylinder turbulence is an effective way of increasing the rate
of combustion in a SI engine. It also promotes extensive fluid mixing, which is beneficial for charge homogeneity. The standard methods for turbulence generation in engines, as well as the interaction between turbulence and combustion, will be addressed in Section 2.4. For
now, it is important that the reader understand three aspects concerning turbulence and engines:
i) The size and intensity of turbulence are both important. Generally speaking, small turbulent eddies combined with high velocity fluctuations (i.e. intensity) is most
ef-fective at increasing the rate of combustion [134].
ii) Turbulence is a naturally decaying phenomenon, and as such requires constant energy
input to be sustained.
iii) The magnitude of turbulent velocity fluctuations (u0) in the combustion chamber of a conventional engine, at the time of ignition, is linearly related to the engine speed in accordance with Equation (2.1) [70], where ¯Sp is the mean piston of the engine.
u0 ≈ 1
2 ·S¯p (2.1)
The split-cycle engine addresses all three aspects in a positive manner. When the crossover
valve is designated to open, the pressure in the crossover passage is considerably higher than the cylinder pressure (e.g.∼20:1). The ensuing flow will therefore be choked, resulting in very high discharge velocities and presumably velocity fluctuations.
Since the flow occurs when the piston is in the vicinity of TDC, the clearance height of the combustion chamber will constrain the size of the turbulent eddies to be very small.
Lastly, because the crossover passage remains at high pressure regardless of engine speed, the resulting discharge flow into the combustion chamber will always be choked for a finite
period of time. Consequently, the turbulence intensity is largely decoupled from the mean piston speed, meaning high intensities can be achieved at low engine speeds.
Polytropic Compression Index
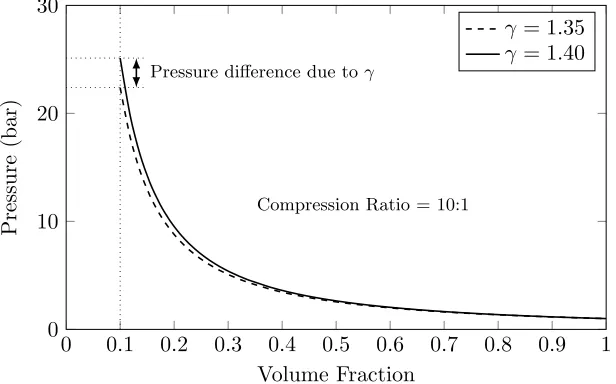
A polytropic process, by definition, abides by the pressure-volume relationship: pVn = constant. For the special case of isentropic compression, the polytropic index, n, is equal
to the ratio of specific heat capacities for constant pressure, cp, and constant volume, cV, processes, denoted asγ:
γ = cp
cV (2.2)
Sinceγ is a property of the fluid, its value differs between pure air and an air-fuel mixture. Take for example, air and a stoichiometric methane-air mixture, which have γ values of 1.40 and 1.35, respectively. If both gases are compressed in the cylinder of an engine that has a compression ratio of 10:1, and assuming the pressure at the start of compression is atmospheric, the final pressure is approximately 3 bar higher for the pure air case, as
shown in Figure 2.3. It is therefore beneficial to introduce the fuel after the compression process has been completed—a characteristic of conventional diesel engines. However, diesel
engines rely on non-premixed combustion, unlike SI engines that generally require mixture homogeneity for combustion stability and low emission of exhaust gas pollutants. Since the
working fluid in a split-cycle engine is transferred to a second cylinder after compression, there is an opportunity to inject the fuel post-compression and still have a premixed charge.
0 0.1 0.2 0.3 0.4 0.5 0.6 0.7 0.8 0.9 1 0
10 20 30
Compression Ratio = 10:1 Pressure difference due toγ
Volume Fraction
Pressure
(bar)
γ = 1.35
γ = 1.40
![Figure 1.2: Global passenger vehicle CO2 emissions: historic levels and enactedregulations [133]](https://thumb-us.123doks.com/thumbv2/123dok_us/1382508.1170921/33.612.151.494.72.309/figure-global-passenger-vehicle-emissions-historic-levels-enactedregulations.webp)
![Figure 2.6: Typical variation in UHC, CO, O2, and NOx emissions as a function ofequivalence ratio for a SI engine, adapted from [131].](https://thumb-us.123doks.com/thumbv2/123dok_us/1382508.1170921/52.612.173.477.74.315/figure-typical-variation-emissions-function-ofequivalence-engine-adapted.webp)