SPLIT-HALF TABLETS: A COMPLETE REVIEW FOR ANALYTICAL TESTING
LAKSHMI NARASIMHA RAO KATAKAM*
Department of Analytical Chemistry, Analytical Research and Development, Saptalis Pharmaceuticals LLC, Hauppauge, New York 11788, USA. Email: [email protected]
Received: 01 July 2019, Revised and Accepted: 30 July 2019 ABSTRACT
A solid oral dosage form (as a tablet) which is an immediate or extended-release dosage form which necessitates the scoring bisect of the tablet. This review discusses the quality attributes and interpretations for the split studies of the various tablet formulations using the analytical techniques. Each method of analysis for the evaluation of split-half tablets in terms of its critical quality attributes discusses in detail explanation of analytical methodology and challenges in formulation development. The results for quantitative analytical evaluation in terms of finished product/stability testing and release of the split-half drug product against the acceptance criterion and also discusses the flowchart guidance for the investigation of out of specification results. The present article provides an insight into the complete analytical evaluation of split-half drug product testing according to the requirements of tablet scoring as per US food and drug administration.
Keywords: Split-half tablet, Analytical testing, Calculation formulae, Acceptance criteria, Investigation of results.
INTRODUCTION
Functional scoring of a tablet enables patients to manage their drug dose and possibly limit the cost savings for healthcare suppliers [1-11]. It also makes it easier to swallow for larger dose tablets. However, the making of a tablet with a score certainly includes complexity to the formulation process. This case brought to the attention on tablet scoring by recent guidance from FDA [12], for making the tablet and specific manufacturing of generics. The essential aspect of the splitting of a tablet has always been on how the active ingredient uniformly distributed in final drug product preparation, and equally important to know how to manufacture tablets with the required flow properties and mechanical integrity. This review article demonstrates the complete evaluation of functional scoring that represents labeled fractions of a whole tablet dose concerning the current analytical testing and release practices.
Advances in spectroscopic techniques, such as near-infrared and laser-induced breakdown spectroscopy mean that it is now possible to analyze content uniformity (CU) over the tablet surface. Furthermore, advances in powder characterization techniques can assist in the development of manufacturing processes, robust. Very often, poor CU attributed to the challenge of delivering a homogeneous blend to work with, because of the active ingredient which is present at quite low levels or is cohesive and prone to agglomeration. On the other hand, if the active pharmaceutical ingredient (API) has a significant difference of particle size or density with involved excipients in the composite blend, subject to segregation in the post blending process.
Dynamic powder characterization can actively support the blending process optimization and also project the possibility of segregation. Furthermore, in combination with bulk and shear properties, help the perception of powder characteristics, through the process of blending or tablet compressor. From these attributes, support companies to deliberate and regulate powder performance during the means of the tablet compression (release from the hopper, flow moves to feed frame, and tablet die filling). Furthermore, they exhibit characteristics for the compressibility of the composite blend and as well quantifying the ability with which air is entrained and released, both of which influence the quality of the achieved tablet at the end. This knowledge is advantageous in ensuring compatibility characteristics between the
process equipment and the blend properties, a match that is vital for ensuring CU in scored tablets.
An increased focus by the FDA [12,13] on scored tablets intensifies the requirement for manufacturers to adopt a rigorous quality by design approach to their tablet development processes. Analytical procedures that can lead to a better understanding of critical-to-quality parameters, such as CU [14,15] and mechanical stability, as outlined above, are therefore likely to become increasingly important. Properties that predict blending performance and how the blend subsequently performs in the tableting press are especially valuable. For example, returning to the issue of air entrainment and release, processing powders with low permeability at high rates can ultimately lead to trapped air building up in the tablet blend at all stages of the press due to fast powder flow rates and recycle. The net result is an eventual degradation in tablet quality. It is just one of many illustrations of how powder property data can help processors make sound decisions about what equipment to use and what production rates to target for efficient scored tablet manufacture. Hence, overall quality attributes for the scored tablet is significant [12,13].
FORMULATION CHALLENGES FOR MAKING OF SCORING TABLET
Powder characterization can play a useful role here in product and process optimization. For instance, one of the factors that influence tablet hardness and friability is the consistency of the die filling, which in turn is affected by the characteristics of the powder blend. Even if the die can be filled uniformly at commercially viable press speed, it is vital that the entrained air be rapidly released during compression and compaction, as retention can lead to capping and lamination. Retention is especially a problem for larger tablets that are more likely to be scored. The ability of the blend to release air can be quantified using parameters such as permeability and through dynamic characterization of aerated powders. Finally, the response of the powder to compression, directly measured through compressibility testing. In summary, comprehensive, multifaceted powder characterization supports the development of optimized formulations and more critical processes, both of which are required to produce well-engineered, mechanically stable scored tablets that are easy for patients to use.
© 2019 The Authors. Published by Innovare Academic Sciences Pvt Ltd. This is an open access article under the CC BY license (http://creativecommons. org/licenses/by/4. 0/) DOI: http://dx.doi.org/10.22159/ajpcr.2019.v12i9.34601
Asian J Pharm Clin Res, Vol 12, Issue 9, 2019, 27-38 Katakam
The design of the scored tablet directs the tooling to employ tablet compression. The tablet split testing (refer flowchart) guide to meet the critical quality attributes as per the current guidance as per US FDA. Operation of the tablet press is usual for a tablet with or without a score. Tablet design eventually, the performance of the dosage form to releases the availability of the API direct the shape and configuration of the tablet scoring. Considerations brought into account for the targeted patient population; for example, the ability of the targeted patient population to break a pill should be circumstanced into the design of the scoring tablet. Patients with elder age or those with limited energy in their hands expect a tablet that is easily split, possibly at the cost of overall tablet power. There exists technology that allows for precise dose control for split tablets by scoring in an area that is devoid of any API, thus enhancing the probability that the dosage delivered is as prescribed.
The quality by design opportunity challenges is to design a tablet that meets the patient 's dosing claims and regulate the formulation process to the marks needed to yield a tablet that gives the patient with the dosage administration that delivers the aspired efficacy. It takes skilled, innovative formulators to serve with the tooling firm to produce the tablet and then use of formulation science to meet the dosage elements for a presentation that can be packaged to assure stability and ease of use by the patient. Pharmaceutical engineers, capable of maintaining and controlling the unit operations necessitate, are significant to lot-to-lot performance and comparability of the final product.
QUALITY ATTRIBUTES TO MANUFACTURE THE SCORING TABLETS
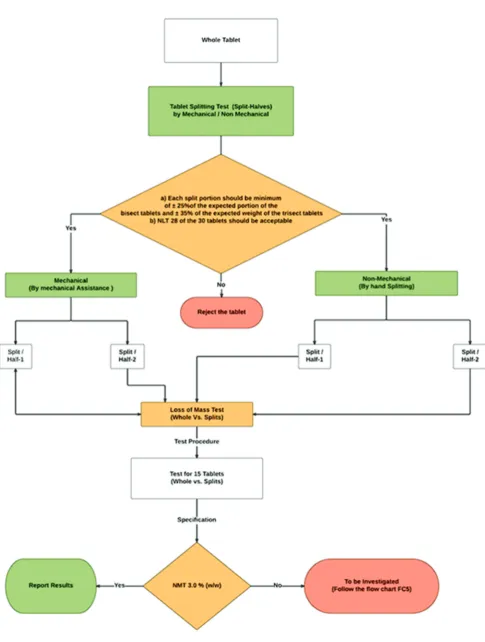
A film-coated tablet coated for a cause to flatter the patient's ability to swallow the pill, to allow the tablet to pass through the stomach before disintegration in the small intestine, to mask the odor, strength, and stability to the tablet covered by the coating. Splitting of a coated tablet disrupt the film coating and thus reduces the coating capacity. The minimum therapeutic dose must be present from each of the split portions of the tablet. Modified release drug products for which split portions can compromise the control of a drug release (e.g., outer film coat) should not have a featured score. Enteric-coated tablets also covered by the same sign and modification of the coating, compromise both drug delivery and function of the dose. The split tablet portions of the drug should be evaluated its stability using the long-term stability (25±2°C/60±5% RH) condition at 90 days interval. The split tablet portions should meet the requirements as same as from the drug product release specifications. Any suggested dissolution test data must produce on a minimum of 12 individual split portions of the tablet. The scored tablets should also be experimented by the designated patient group to ensure patients who can split these pills precisely.
ANALYTICAL INTERPRETATIONS AND FORMULAE
The split study of the individual means-tested as a part of finished product testing specifications and label follows accordingly as half of the dosage claim for analytical interpretations. Tablets shall be a break in half as part of the test procedure, and the storage conditions of the split portions defined in the analytical method. For dissolution or disintegration testing, analysts should use only split portions from the whole tablet, which has a functional score.
Tablet split procedure
Take 30 intact tablets at random, weigh, and record a single tablet accurately. For each intact tablet, determine the targeted weight of the split portions by dividing the whole-tablet weight with the number of functional scores. Split 15 tablets each by hand (without mechanical assistance) and by mechanical aid, respectively, into the assigned number of split divisions and weigh each split portion. Determine the percentage tolerance limit for the respective split portion to its whole tablet measured weight [13] (Fig. 1).
Loss of mass determination
The test shall carry out before and after an exact split of the dosage form (Tablets) into bisect or trisect with minimal reduction as per the tablet splitting procedure [12,13]. For each individual whole tablet measured as (W0) and its designated total split portions measured combinedly as (W1).
The calculation formulae as follows:
Formulae: Loss of mass: (W0–W1)/W0•100
Refer schematic flowchart Fig. 1 for evaluation of results.
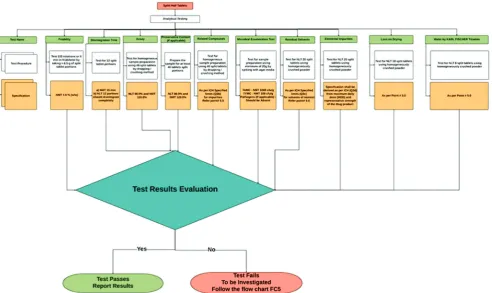
Friability
The test friability is a percentage particulate count that could defragment from the split portion of the dosage form when it is running in friabilator apparatus for 4 min (100 rotations) as per USP [16].
Formulae: % Friability = (W1–W2)/W1•100
The test shall be performed using before (W1) and after (W2) wt of the
split tablet portions, which should have a minimum of 0.0065 kg of the specimen (Fig. 2).
Moisture content by Karl Fischer (KF) titration
Most of the pharmacopeial substances either are hydrates or hold water in adsorbed form. Thus, the estimation of water content plays a key role in demonstrating agreement with the Pharmacopeial standards [17].
Principle and apparatus
The titrimetric determination of moisture depends on the reaction of water quantitatively with an anhydrous form of sulfur dioxide and iodine solutions in the presence of a solvent medium that reacts with hydrogen ions. It is known as KF reagent, the iodine and sulfur dioxide dissolved in imidazole (pyridine derivative) and methanol. The test specimen titrated directly with the reagent, or the analysis may conduct a residual titration method. However, the stoichiometry of the chemical reaction is not accurate, and the reproducibility of a measurement depends on the relative concentrations of the reagent components, the nature of the inert solvent applied to solubilize the test specimen, and the technique employed in the appropriate quantitation. The end-point is determined electrometrically with equipment using a simple electrical circuit that attends to mark about 200 mV of applied potential within a pair of platinum electrodes submerged in the titrant solution. At the titration end-point, a small excess of the KF reagent develops the current flow within 50 and 150 µA for 30 s–30 min, based on the specimen titration. The shortest time applied for substances that dissolve in the reagent (titrant-usually dried methanol) quickly. The air in the system dried by the appropriate desiccant, and the titration bowl may prevent a current state of dry air or dry nitrogen.
Test preparation
Use powder from a minimum of eight split tablets crushed to a powder in an atmosphere of temperature and relative humidity controlled and not to affect the results. For specimens under test is hygroscopic unless otherwise specified, transfer an accurately measured portion of the specimen into the titration vessel which is under test, by avoiding the external atmospheric moisture.
Formulae: % Moisture content = VF•(100/Specimen weight, mg)
where,
V is the volume (mL) of KF reagent consumed for the titration. F is the calibration factor (mg/mL) of the instrument using as a water or
disodium tartrate dihydrate (DST) as a standard (Fig. 2).
Loss on drying (LOD)
Fig. 1: Schematic flowchart for loss of mass determination test
heating maybe not water entirely. Weigh (W2) and transfer a fine powder
crushed from a minimum of 10 split tablets into suitable pre-weighed and dried LOD bottle (W1) and determine LOD in a conventional oven at
105°C for 2 h, unless otherwise described in an individual monograph.
Cool it in a desiccator and weigh (W3).
Formulae: (W2–W3)/(W2–W1)•100
Asian J Pharm Clin Res, Vol 12, Issue 9, 2019, 27-38 Katakam
Dissolution
The most effective means of disease treatment available by taking the tablets or capsules orally. The effectiveness of such dosage forms, how it relies on the dissolving a drug in the gastrointestinal tract before its systemic absorption. Therefore, the crucial step for drug development is the dissolution release rate. Drug release in the human body defined as in-vivo by measuring the urine or plasma concentrations in the material concerned. However, there are certain distinct impracticalities associated with employing such procedures. These difficulties led to the introduction of official in-vitro tests [19], which are now vastly and comprehensively described in the individual pharmacopeia.
Dissolution is a standardized method for determining the rate of drug release from its dosage form.
The principal function of the dissolution:
a. Assessment of therapeutic effectiveness during product development and its stability
b. Routine evaluation of product quality to assure uniformity between production batches
c. Evaluation of “bio-equivalence,” between the discrete batches of reference listed drug versus individual developed dosage form, namely, bioavailability (where applicable).
Use split portions from tablets that are adequate according to the splitting tablets with the practical scoring test.
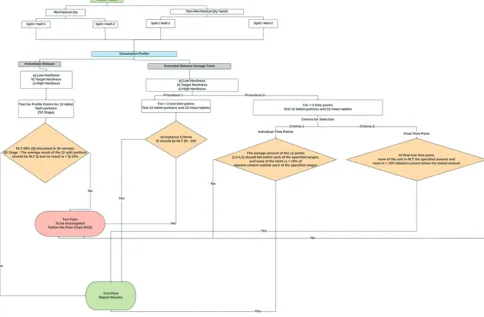
Immediate-release tablets
The dissolution profile is performed at the S2 stage [19], namely, test for 12 split tablet portions with specified dissolution release medium, apparatus type, time points, and analysis.
Where Q, is the percentage of drug released at a specified interval.
Formulae for dissolution profile calculations: % of drug dissolved in “n1” time point = A
A = (Au/As)•CP•Tv•(M1/M2)•100/LC
% of drug dissolved in “n2” time point = A1
A1 = B+F1
F1 = {A×Sv/Tv}
B = Au/As•CP•(Tv–Sv)•(M1/M2)•100/LC
% of drug dissolved in “n3” time point = A2
A2 = C+F2+F1
F2 = {B×Sv/(Sv–Tv)}
C = Au/As•CP•(Tv–Sv)•(M1/M2)•100/LC
Where,
Au/As = Ratio of responses of sample and reference standard preparation. C is the drug concentration in the standard preparation in mg/mL. P is the purity of the reference standard used in the decimal form. A, B,… = % drug dissolved at n1, n2, n3,… time point.
A1, A2,… = % cumulative of the amount of drug after sampling. F1, F2,… = correction factor for the amount of drug sampled. Tv = volume (mL) of the dissolution media.
Sv = sampling volume (mL) at n1, n2, n3,… time point.
M1/M2 = conversion factor of the labeled molecular form of the drug (if applicable).
LC = labeled amount of dosage form.
Extended-release tablets
The dissolution testing of split tablet portions performed by one of the two alternative procedures.
Procedure 1 (for more than 3-time points)
Test 12 tablet split segments and 12 whole tablets individually with specified dissolution conditions. As mentioned in the monograph, stated about the suitable dissolution method mentioned in the drug product label. The test time intervals shall be selectively used from the respective monograph, from the specified time points, with a minimum of 3, no more than a one-time interval where the percentage drug release exceeds 85%.
Determine the similarity factor (f2) for the whole tablet versus split-tablet portion results [12,19]:
Similarity factor formulae: f2 = 50•log{[1+(1/n)n∑t=1 (Rt–Tt)2]−0.5•100}
Where,
Rt = % cumulative average of the labeled drug dissolved at the nth time
point of intact tablets.
Tt = % cumulative average of the labeled drug dissolved at the nth time
point of split tablet portions.
Procedure 2 (for less than 3-time points)
Use each split-tablet portion as the unit dose and individually test for 12 units. The limits encompass each value of Q [12,19], the quantity dissolved at each defined fraction of the unit dose time point, where more significant than one limit defined in the monograph of the specimen, the acceptance criteria apply individually to that each specified range (Fig. 3).
Disintegration time
Disintegration [20] defined as that time in which any residuum of the individual dose, apart from particles of insoluble film coating or capsule shell, enduring on the screen of the system or cling to the below surface of the discs. This test is presented to ascertain whether tablets/capsules dispersed within the designated time when placed in deionized water under the experimental conditions.
For the objectives of this test, disintegration does not signify complete solubility of the unit dose/active ingredient.
For immediate release tablets, put one (1) split tablet portion in each of the six tubes of the basket unless otherwise specified, add a disk. Operate the device, using water or the specified media as the immersion liquid, maintained at 37±2°C. At the end of the time limit defined in the monograph, raise the basket from the liquid, and examine the test for additional six split tablet portions whether all of the tablets have disintegrated completely.
For modified release tablets, disintegration test is not applicable to perform as the drug release prolonged by the polymer excipients (Fig. 2).
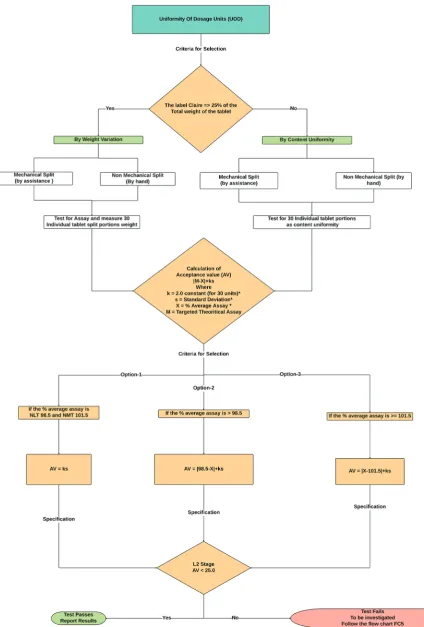
Uniformity of dosage units (UOD)
To establish the UOD, each unit/dosage unit in a lot should have a content of drug substance within a constricted range throughout the label claim. Dosage units described as dosage forms accommodating a single dose or a part of the dose of drug substance in every unit. The UOD [21,22] specification is not deliberate in soliciting for emulsions, suspensions or gels in unit dose receptacle studied for the applications of external and/or cutaneous use.
The term “UOD” is established as the extent of drug substance homogeneity presence over the dosage unit. Therefore, the need for any drug substance being constitutes of unit dose containing one or more drug substances, unless otherwise described elsewhere in the pharmacopeia. The UOD defined through either of two procedures, weight variation or CU (Fig. 4). The analysis for preparations of CU conferred in a unit dose is determined from the assay of individual content of drug substance(s) in multiple aggregates of unit doses to ascertain the percentage drug release should meet the acceptance criteria. The test for CU needed for all dosage forms not meeting the above conditions for the weight variation test.
CU
There are two kinds of determination could be recorded as per the weight of the dosage form. One is CU by instrumentation method, namely, by ultraviolet, high-performance liquid chromatography (HPLC), ultra-performance liquid chromatography, atomic absorption spectrometry, gas chromatography, and inductively coupled plasma (ICP),… Another one is the CU by weight/mass variation (WV) method. The method of evaluation categorized into two parts as per USP/EP/JP.
Select a minimum of 30 tablets, and proceed as follows for the dosage form designated where different procedures can use for the determination of assay and CU test, it is necessary to establish a correction factor to be post applied to the results.
Solid dosage forms
Perform assay on 10 units individually using a validated analytical method. Calculate the acceptance value (AV).
Liquid or semi-solid dosage forms
Perform assay from three drug product containers by splitting into three portions from each container, respectively, using a validated analytical method. Carry out the assay on the amount of well-mixed material from an individual container in conditions of regular use, and present the results as a delivered dose.
CU calculation formulae (as % label claim):
(Au/As)•(CP)•(M1/M2)•(100/LC)
Where,
Au/As = ratio of responses of sample and reference standard preparation. C is the drug concentration in the standard preparation in mg/mL. P is the purity of the reference standard used in the decimal form. M1/M2 = Conversion factor of the labeled molecular form of the drug
(if applicable).
LC = Labeled amount of dosage form.
Weight variation
USP does not accept the JP/EP procedure in case of the products which does not meet the 25 mg/25% of the drug substance in the whole weight of the tablet shall be performed for UODs by WV rather than the CU test. The relative standard deviation (RSD) of the % assay of the labeled amount of drug from 10 individual tablet dosages should be not more than (NMT) 2%. Unless otherwise, a change approved by the regulatory, from the process development and validation data. The test for weight variation is suitable as follows for the below-listed variable dosages.
• (W1) Solutions that are contained in unit dosage packets and/or into
soft gelatin capsules
• (W2) Solids (including powders, granules, and sterile solids) that are
stored in individual unit containers and does not contain the added substance of active or inactive
• (W3) Solids (sterile/non-sterile) solids that stored in individual unit
containers, with or without the added substance of active or inactive that have been prepared from solutions and/or freeze-dried in the
final containers (lyophilized)
• (W4) Uncoated/film-coated tablets and/or hard capsules contained
25 mg or more of a drug substance constituting 25% or higher, by
mass, of the unit dose. In case of hard capsules with the fill contents,
except that the uniformity of other drug substances present in lesser portions is substantiated to meet the CU testing requirements.
Uncoated or film-coated tablets
Asian J Pharm Clin Res, Vol 12, Issue 9, 2019, 27-38 Katakam
The concentration of the drug substance is the amount per each dosage unit (w/w or w/v), where amount per dosage unit equals the assay result per unit dose divided by the individual unit dose weight.
Weight variation calculation formulae (as % label claim): (Wt•At/A)
Where,
Wt = Wt of the individual unit dose. At = Assay of the representative sample.
A = Average unit weight of the representative sample.
Calculation of AV from CU/WV and evaluation of results refer in schematic flowchart Fig. 4.
Stability indicating method for determination of assay/related compounds
HPLC methods designed to determine specific quantification of the drug in the presence of its degradation products by the stability-indicating method. Stability indicating method (SIM) is developed and validated by following the strategies for forced degradation and optimal selectivity of the chromatography to ensure that all relevant degradation products are well resolved and quantified.
According to US FDA requirements (Guidance for industry, analytical procedures, and methods validation, FDA, 2000), a SIM [23-32] is described as a validated analytical procedure that quantifies the drug, free from process impurities, excipients, and degradation products precisely and accurately. The US-FDA supports that all assay methods for stability should be stability-indicating. The purpose of a SIM is to monitor results throughout the stability cycle to assure safety, efficacy, and quality.
The drug product specification should include a list of degradation products (known and specified) expected to transpire while
manufacturing of the commercial drug product and under storage conditions recommended. During the product development stage, the knowledge of degradation pathways, stability studies, and laboratory studies should acknowledge the characterization of impurity profile. Based on degradation products found in proposed commercial process manufacturing, the specification of a drug product should be selected. Together with the attention of the degradation profile of batches manufactured by the proposed production process, the rationale should add a discussion of the degradation profiles, observed in safety and clinical development batches and stability studies.
The limit of quantitation/detection of the analytical procedures should be equivalent to the level of which the degradation products known to be unusually potent or toxic or unexpected pharmacological effects should establish. Impurities that are not degradation products, namely, process-related impurities from the drug substance are frequently not restrained in the drug product, which is specific controls in the drug substance, and these impurities are not anticipated to rise over a period. Additional documents set forth for the impurities from the ICH and FDA Guidance and specific USP monograph submission guidelines.
Degradation product
An impurity formation from a chemical alteration in the drug substance produced by the production and during the storage of the drug product packaged by the result of, namely, temperature, light, water, pH, or by reaction with a primary container-closure system or an excipient interaction.
Unidentified impurities and unidentified degradation products: These products for which structural elucidations have not established and that are identified solely by qualitative analytical techniques. Unspecified impurities and unspecified degradation products: General
Fig. 4: Schematic flowchart for uniformity of dosage units test
permissible acceptance restrains these impurities/degradants but not individually listed with their specific acceptance criteria in individual monographs. Identified degradation products and impurities: The structural elucidations establish these impurities.
Impurity
Asian J Pharm Clin Res, Vol 12, Issue 9, 2019, 27-38 Katakam
Inorganic impurities
The impurities generated from the process of tablet manufacturing viz. inorganic salts, residual metals, filter aids. Inorganic impurities established by tests such as data found in Plasma Spectrochemistry.
Related substances
These are structurally relative to drug substance. This matter may be (a) identified or unidentified impurities developing from the synthesis of the manufacturing process, namely, starting materials, intermediates, or by-products, and do not rise on storage and (b) identified or unidentified degradation products that originate from drug substance or drug product manufacturing methods or appears through the material storage.
Specified impurities or degradation products
Earlier indicated as signal impurities, specified impurities or specified degradation products are impurities or degradation products that are exclusively listed and defined with distinct permissible amounts as per applicable monographs, as it identified or unidentified.
Relative response factor (RRF) evaluation
Impurities that are more precious and non-abundant materials and difficult to produce as a purified isolated impurity compound as standard for determining the % level of that respective impurity in the sample. This factor establishment was often encouraged by the industry for determining the contents of the specified or identified impurities in the sample in each time of analysis. This factor determination is economical and helps to determine the impurity levels without using the known concentration of the individual impurity standards relative to the drug substance. It is obtained by preparing the known concentrations of the active drug standard and specified or identified impurity standards at five or more allowable ranges of impurity specification levels. The factor determined from the ratio of the slope of the single impurity versus reference drug.
Documented evidence should establish the analytical test method used to quantify the impurities or degradation products, in which they validated and suitable for the detection and quantitation.
Assay calculation formulae for assay (as % label claim):
(Au/As)•(CP)•(Tv/W)•(A/LC)•100
Calculate the peak responses of the individual impurity from the sample preparations and calculate the each known/unknown impurity found in percentage (%).
(Au/As)•(CP)•(Tv/W)•(1/RRF)•(A/LC)•100
Where,
Au/As = Ratio of the response of known impurity in sample versus average response of reference standard preparations.
C = Concentration of reference standard in mg/mL. P = Purity of reference standard in the decimal form. Tv = Volume (mL) of diluent used for sample preparation. W = Weight of sample taken in mg.
RRF = Relative response factor of known impurity. A = Average weight of the tablet in mg.
LC = Unit dose label claim.
Note: For unknown impurity, RRF as 1 (w.r.t drug).
Residual solvents
An organic liquid preferably used as a vehicle for the preparation of suspensions or solutions in the synthesis of a drug substance and the manufacturing of drug product. These solvents which are not eliminated by adequate manufacturing processes. Hence, this test recommends to determine toxic solvents and describes the concentration levels considered to be toxicologically permissible for involved residual solvents. Suitable selection of the solvent for the drug substance synthesis may improve the yield, or determine characteristics, namely, as a crystal form, solubility, and Purity.
Drug products should carry levels of residual solvents lower than established ICH concentration limits [33,34].
• Class 1 solvents: Solvents to avoid as known human carcinogens,
strongly suspected human carcinogens, and environmental hazards
• Class 2 solvents: Solvents to limit, namely, non-genotoxic animal
carcinogens or possible causative agents of other irreversible toxicity such as neurotoxicity or teratogenicity. Solvents suspected of other
• Class 3 solvents: Solvents with low toxic potential, namely, solvents
with a low toxic potential to man; no health-based exposure limit is needed. Class 3 solvents have permitted daily exposure (PDEs) of 50 mg or more per day.
Calculation formulae
Calculate the peak responses of the individual components from the sample preparations and calculate the content of residual solvents in ppm or µg/mL.
(Au/As)•(CP)•(Tv/W)•106
Where,
Au/As = Ratio of area of solvent in the sample and standard preparations. C = Concentration of solvent in µg/mL.
P = Purity of solvent standard in the decimal form. Tv = Volume (mL) of diluent used for sample preparation. W = Weight of sample taken in mg.
106 = Conversion factor for converting g into µg.
Microbiological examination of non-sterile products
Microbial enumeration test
The tests detailed hereafter provide a quantitative enumeration of mesophilic bacteria and fungi that may grow under aerobic conditions. The tests are intended primarily to perform whether a substance or preparation complies with an established specification for a microbiological character. When employed for such purposes, follow the instructions as stated in general monograph, including the number of samples to be taken, and evaluate the results. Alternative microbiological methods, including automated methods, may be used, provided that their equivalence to the pharmacopeial method has established [35].
The ability of the test method to identify micro-organisms in the concurrence of the product to be examined must prove. Suitability must set if a variation in testing performance or a variation in the product that may pretend the outcome of the method, is introduced.
Use standardized, stable suspensions of sample strains or make as stated in general monograph recommendations. Seed-lot culture maintenance techniques are applied so that the viable micro-organisms used for inoculation are NMT five passages removed from the primary master seed-lot. Develop each of the bacterial and fungal test strains growth individually as mentioned in information table provided in the respective USP general chapter in the monograph.
Negative control
To setup experiment conditions, a negative control is tested using the selected diluent in place of the test preparation. There must not be micro-organisms growth. A negative control additionally experimented when testing the products as described under the testing of products. A failed negative control requires an investigation.
Preparation of the sample
Sample preparation depends on the physical property of the product. If none of the procedures described in general monograph can be evaluated to be adequate, a proper alternative method must develop.
Water-soluble products
The drug product is to dissolve or dilute (1 in 10) in buffered sodium Chloride–Peptone solution pH 7.0, Soybean–Casein digest broth or phosphate buffer solution pH 7.2, if required, adjust a pH of 6–8. Additional dilutions, whenever necessary, are made with respective diluent.
Non-fatty products insoluble in water
Disperse the product to be tested (1 to 10) in buffered sodium Chloride– Peptone solution pH 7.0, Soybean–Casein digest broth or phosphate buffer solution pH 7.2. A surface-active vehicle such as 0.001 kg per L of polysorbate 80 may be added to support the suspension of poorly
soluble substances. If specified, adjust to a pH of 6–8. Additional dilutions, where ever required, are prepared with the corresponding diluent.
Tests for specified micro-organisms
The tests specified hereafter provide a determination of the absence of, or limited existence of, specified micro-organisms that may identify under the described conditions. The tests are intended primarily to perform whether a substance or preparation complies with a demonstrated specification for microbiological quality. When used for such determinations, follow the instructions as per general monograph, including the number of samples to be taken for testing, and evaluate the results. Alternative microbiological methods, including automated procedures, may be employed, implemented that their equivalence to the demonstrated pharmacopeial method [36].
For every new product tested shall perform sample preparation as defined in the appropriate paragraph under testing of products in general monograph. At the point of mixing time, add each test strain in the designated growth means. Inoculate the test strains independently. Use some micro-organisms similar to NMT 100 colony-forming units in the inoculated test preparation. Perform the test as specified in the relevant paragraph under testing of products using the shortest incubation period prescribed and identified. The specified any antimicrobial activity of the product necessitates a modification of the test procedure (see neutralization/removal of antimicrobial activity under microbiological examination of non-sterile drug products): Microbial enumeration tests [36]. For a given drug product, if the antimicrobial activity concerning a micro-organism for which testing directed cannot compensate and also assumed that the inhibited micro-organism would not be present in the product (Fig. 2).
Elemental impurities determination by ICP mass spectrometry (MS)
These are to be present in drug substances, excipients (catalyst), or drug products and/or process contaminants. These impurities may occur in nature, intentional addition and/or inadvertent introduction, namely, with the manufacturing equipment surface interactions and/ or with the container closure system. The assurance of adherence of those elements expected as mandated to be safe and specified levels present. Due to the omnipresence nature of minimal elements, namely, lead (Pb), arsenic (As), mercury (Hg), and cadmium (Cd) must assess in the risk assessment due to its Class 1 category.
Class 2A elements are Ni, Co, and V presence in the drug product which has relatively high abundance and thus requires risk assessment across all input raw material sources and routes of administration (as indicated).
Class 2A elements are Ni, Co, and V, which is a relatively high probability of occurrence in the drug product. Class 2B elements are Ag, Au, Ir, Os, Pd, Pt, Rh, Ru, Se, and Tl which have a lessened probability of occurrence in the drug product. As a result, they may be omitted from the risk evaluation unless they deliberately added during the synthesis of drug substances, excipients, or other components of the drug product.
Class 3 elements are Ba, Cr, Cu, Li, Mo, Sb, and Sn. For oral routes of intake, unless these elements deliberately added, they do not need to be considered during the risk assessment. The specification limits mentioned in this USP [37-39] chapter <232> do not cover excipients and drug substances unless otherwise stated in an individual monograph. Based on the input materials of excipients and drug used in drug product preparations, the presence of contents of elemental impurities shall be assessed using the manufacturer certificate of analysis and information table provided in USP chapter [37]. The elements that are intrinsic in the essence of the material (naturally sourced) must study for the risk evaluation.
Asian J Pharm Clin Res, Vol 12, Issue 9, 2019, 27-38 Katakam
distinct concern owe to the differing toxicities of their complexed organic and inorganic forms.
The arsenic limits originated from the inorganic (most toxic) form and determined as a total-arsenic method under the presumption that all arsenic contained in the inorganic form of material under test, where the limit is surpassed using a total-arsenic method, it can be adequate to quantify through inorganic form, which also meets the specification.
The Hg limits determined as inorganic oxidation form (2+) state. The
methylmercury form (most toxic) is an exception in determining the pharmaceuticals and the acceptance limit presumed to be an inorganic form.
Calculation formulae of demonstrating compliance
Maximum daily dose×Avg. wt/label claim.
Drug product analysis option
The results observed from the study of a typical dosage unit, compared to the highest daily dose, are compared with respect to the daily dose of PDE.
Daily dose PDE ≥ measured value (µg/g)×daily dose maximum (g/day).
The evaluated amount of each impurity is NMT the daily dose of permitted daily exposure unless otherwise stated in the individual monograph.
Summation option
Individually, sum the amounts of each elemental impurity (in µg/g) present in each of the components of the drug product:
Daily dose PDE ≥ [ΣM1(CM×WM)]×DD
The result of the addition of each impurity is NMT the daily dose PDE unless otherwise defined in the individual monograph. Before product evaluation applying this option, the manufacturer must assure that further elemental contaminants inadvertently added through the process or the container/closure system over the shelf life of the product. While elemental impurities obtained from the manufacturing process or the container closure system not specially provided for the individual component option, it expects that the drug product manufacturer ensures that these sources do not add vital to the whole content of elemental impurities.
This chapter explains two analytical procedures (procedures 1 and 2) for the determination of the levels of the elemental impurities by lCP-OES and ICP-MS techniques. The acceptance limits shall derive from a maximum daily dose of the drug products (Fig. 2).
Stability evaluation and justification of specifications
The split tablets, when stored in pharmacy dispensing containers with neither seal and nor desiccant/cotton/rayon, should demonstrate adequate stability for 90 days in long-term stability condition, namely, 25±2°C/60±5% RH. The stability evaluation shall be carried out as per the procedure and acceptance criteria outlined in this article except for loss of mass (not applicable for split tablets stored in the stability) test and residual solvents test, as non-routine stability-indicating. The stability evaluation shall be carried out for friability, disintegration time (for immediate release dosage), dissolution profile, assay, preservative contents, and related compounds tests. Unless otherwise described in the individual monograph, the analytical test specifications evaluated using whole tablets from initial to the accelerated stability condition of 40±2°C/75±5% RH at 0, 3, and 6 months intervals. The percentage known and unknown degradation products evaluated based on the total daily intake of the drug product as per the ICH Q3B (R2).
Investigation of failure results
The results obtained in any of the described tests are not meeting the acceptance criteria. The investigation of the results shall accompany as out of specification (OOS), and the test investigates through the checklists discussed as mentioned about instrumental and human errors. Analytical data should be assessed promptly to ascertain if the results might attribute to laboratory error (Type-I and Type-II) or whether the results could indicate troubles faced during the manufacturing process (Type-III).
Type-I Laboratory investigation (identified problem)
The analyst and the investigator shall conduct a formal laboratory inspection to discuss further the executed analytical test procedures, and raw data obtained using the quality of the standards and reagents shall be verified and confirm the performance of instruments and its calibration status as well to address/identify the anomalies.
The failing test results could be as the result of one or more of the following causes.
Sample preparation errors
Error in weighing, sample transfer, in dilution (incorrect volume, diluents or cross-contamination), improper filtration and/or centrifugation, improper solubilization of standard/sample before subsequent dilutions (if any), pipetting, variability due to temperature changes (e.g., volume change or degradation), contamination from the solvent, diluents or solubilization, improper intended treatment of standard substance prior to solubilization, contamination, and improper storage/exposure of the sample/standard to the environment. Any other factor established by the scientific judgment of the investigator.
Instrumental errors
Column contamination/leakage/column tubing leakage, air bubbles in the HPLC system (tubing, sample loop, detector cell, etc.), error in data processing, detector noise or baseline drift or use of the non-calibrated instrument, electronic/electrical malfunction of the instrument(s), auto-injector related error (missed injection, an incorrect volume of injection, lack of rinsing solvent, and inappropriate rinse solvent), any other factor which is established on the basis of a scientific judgment of the investigator.
Human errors
Errors during use of data transcription, incorrect formula, incorrect entry for calculation purpose, error in spreadsheet formula (if applicable), etc., programming error (injection volume, attenuation, incorrect vial identification, incorrect chromatogram labeling, etc.), any other factor which is established on the basis of the scientific judgment of the investigator.
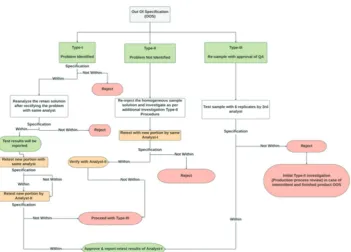
Investigation; When the problem identified during the formal investigation, follow the Type-I procedure, as shown in the flowchart (Fig. 4). In the case of an identified laboratory error, the retest results would substitute the original test results.
Type-II Un-identified problem
If the problem is un-identified, carry out the additional investigation and further proceed as per the Type-II procedure detailed in flowchart Fig. 4.
a. Re-inject homogenous sample solution and standard solutions to identify the instrument malfunction or erroneous sample preparation or contamination of glassware. If the results repeat, the same, instrument malfunction can be ruled out and may expect the human error in sample/standard preparation or cross-contamination due to glassware/apparatus used
b. To confirm further the cross-contamination issue, shall be analyzed
solution (or) sample from centrifuge tube (or) by taking original, portion (crushed powder) of the sample in case of mortar and pestle used for sample preparation, etc.)
c. To confirm other possible errors follow Type-II flowchart Fig. 4 d. If the investigation results to identify the source problem, including
human error, inconsistent to make a decision, follow Type-III. The additional investigation is not limited to the mentioned examples, can be extended as appropriate, and shall be documented the details of any investigation and conclusions.
Type-III Re-sampling and additional testing with QA approval
Carry out the Type-III procedure detailed in flowchart Fig. 4, in a situation of the requirement for Type-I and Type-II OOS investigations. Re-sampling should be as per the initial sample sampling procedure. If any different methodology is to consider, it should be carried out with a pre-approved protocol. Any result should not be discarded or omitted stating that it is an outlier, as outliers shall not expect in chemical analysis. Whenever a 3rd analyst involved, he should perform
the test with six sample preparations and report the average result. If the percentage RSD of the six replicate standard, injections shall have NMT 2% for assay and preservative contents, NMT 10% for related compounds, and NMT 15% for residual solvents. If the percentage RSD of the six individual samples, preparations shall have NMT 2% for assay and preservative content, NMT 10% for related compounds, and NMT 15% for residual solvents. The variation between higher and lower results shall have ±0.05 for individual impurities and ±0.10 (numerically) for total impurities, respectively. For any test other than the above, the number of trials (6 times) and the allowed variation designed as per the pre-approved protocol of the OOS investigation.
Phase-II investigation (full-scale investigation) Production process review
Carried by the quality control unit and should involve all other functions that could be associated, including production, process development, engineering and shall have the following format.
Reason for the examination, the summation of the process continuities that might have originated the problem, corrective actions are essential to save the lots and prevent likely reoccurrence, the study of other lots possibly pretended, the conclusions of an examination of these lots and any corrective action taken thereof. The review should address the following specific issues, evaluate other lots of products manufactured by the erring individual or equipment, evaluate other lots by the erring manufacturing process/operator; the documentation records of the production process should be evaluated entirely to ascertain the probable cause of the OOS result(s).
If the investigation endorses the OOS result and is successful in distinguishing its cause, the investigation might conclude by rejecting the product lot. However, a failure investigation that extends to other lots of the products that might correlate with the specific failure also documented. If any material reprocessed after additional testing, the investigation should incorporate observations and the signatures of suitable production and quality control personnel (Fig. 5).
CONCLUSION
The weight of the split tablet halves appears to be straight correlated with the content of the drug. Thus, it is necessary to aware that pharmacists who split tablets into two halves assure the weight uniformity of the resultant since this may associate with CU for these tablet halves. Manufacturers should investigate the physical factors such as tablet size, shape, friability, and hardness that may play a key role in achieving the uniform distribution throughout the tablet preparation.
Furthermore, manufacturers should develop a robust formulation process that ensure a high degree of uniformity between weight and content not only in the whole tablet but also from the respective individual split portions. This review article outlined the overview of the quality attributes through its analytical interpretation of
functionally scored tablets that represent the labeled dosage form of the split-half unit.
ACKNOWLEDGMENTS
The author expresses his gratitude to Saptalis Pharmaceuticals LLC., New York, for providing laboratory facility for this research work.
AUTHORS’ CONTRIBUTION
The author has solely contributed to the design, development, review, and finalization of the contents of the manuscript.
CONFLICTS OF INTEREST
The author confirms that this article content has no conflicts of interest.
REFERENCES
1. Ekedahl AB. Patients’ experiences of splitting tablets. Clin Med Res 2013;2:58-62.
2. van Santen E, Barends DM, Frijlink HW. Breaking of scored tablets: A review. Eur J Pharm Biopharm 2002;53:139-45.
3. Dormuth CR, Schneeweiss S, Brookhart AM, Carney G, Bassett K, Adams S, et al. Frequency and predictors of tablet splitting in statin prescriptions: A population-based analysis. Open Med 2008;2:e74-82. 4. Directive 2001/83/EC of the European Parliament and of the Council
of 6 November 2001 on the Community Code Relating to Medicinal Products for Human Use. Document European Union; 2001. p. 1-129. 5. Quinzler R, Gasse C, Schneider A, Kaufmann-Kolle P, Szecsenyi J,
Haefeli WE, et al. The frequency of inappropriate tablet splitting in primary care. Eur J Clin Pharmacol 2006;62:1065-73.
6. van der Steen KC, Frijlink HW, Schipper CM, Barends DM. Prediction of the ease of subdivision of scored tablets from their physical parameters. AAPS PharmSciTech 2010;11:126-32.
7. Shah RB, Collier JS, Sayeed VA, Bryant A, Habib MJ, Khan MA,
et al. Tablet splitting of a narrow therapeutic index drug: A case with levothyroxine sodium. AAPS PharmSciTech 2010;11:1359-67. 8. Mehuys E, Dupond L, Petrovic M, Christiaens T, Van Bortel L,
Adriaens E, et al. Medication management among home-dwelling older patients with chronic diseases: Possible roles for community pharmacists. J Nutr Health Aging 2012;16:721-6.
9. Freeman MK, White W, Iranikhah M. Tablet splitting: A review of the clinical and economic outcomes and patient acceptance. Second of a 2-part series. Part 1 was published in may 2012 (Consult pharm 2012;27:239-53). Consult Pharm 2012;27:421-30.
10. Quinzler R, Schmitt SP, Pritsch M, Kaltschmidt J, Haefeli WE. Substantial reduction of inappropriate tablet splitting with computerised decision support: A prospective intervention study assessing potential benefit and harm. BMC Med Inform Decis Mak 2009;9:1-5.
11. Rodenhuis N, De Smet PA, Barends DM. The rationale of scored tablets as dosage form. Eur J Pharm Sci 2004;21:305-8.
12. Guidance for Industry Tablet Scoring: Nomenclature, Labeling, and Data for Evaluation, US Department of Health and Human Services, FDA, Center for Drug Evaluation and Research; 2011. Available from: http://www. fda.gov/downloads/Drugs/GuidanceComplianceRegulatoryInformation/ Guidances/UCM269921.pdf. [Last assessed on 2013 Oct 10; Last accessed on 2018 Aug 08].
13. Brown WE. Quality Attributes of Tablets Labeled as Having a Functional Score. Vol. 4., Ch. 705. USP 41-NF 36; 2018. p. 586-8. 14. Freeman MK, White W, Iranikhah M. Tablet splitting: A review of
weight and content uniformity. Consult Pharm 2012;27:341-52. 15. Tahaineh LM, Gharaibeh SF. Tablet splitting and weight uniformity
of half-tablets of 4 medications in pharmacy practice. J Pharm Pract 2012;25:471-6.
16. Brown WE. Tablet Friability. Vol. 5., Ch. 1216. USP41-NF36; 2018. p. 7634-5.
17. Botros LL. Physical Tests-Water Determination. Vol. 4., Ch. 921. USP41-NF36; 2018. p. 6687-92.
18. Hernandez-Cardoso A. Loss on Drying. Vol. 4., Ch. 731. USP41-NF36; 2018. p. 6485-6.
19. Margareth RC. Marques. Physical Tests-Dissolution. Vol. 4., Ch. 711. USP41-NF36; 2018. p. 6455-7.
20. Brown WE. Disintegration. Vol. 4., Ch. 701. USP41-NF36; 2018. p. 6455-7.
USP41-Asian J Pharm Clin Res, Vol 12, Issue 9, 2019, 27-38 Katakam
NF36; 2018. p. 6673-7.
22. Ciavarella AB, Khan MA, Gupta A, Faustino PJ. Dose uniformity of scored and unscored tablets: Application of the FDA tablet scoring guidance for industry. PDA J Pharm Sci Technol 2016;70:523-32. 23. Rao KL, Reddy KP. Simultaneous estimation of fluticasone propionate,
azelastine hydrochloride, phenylethyl alcohol and benzalkonium chloride by RP-HPLC method in nasal spray preparations. Int J Res Pharm Sci 2010;1:473-80.
24. Rao KL, Reddy KP. Development and validation of a stability-indicating LC method for simultaneous determination of related compounds of guaifenesin, terbutaline sulfate and ambroxol HCl in cough syrup formulation. J Saudi Chem Soc 2014;18:593-600.
25. Dongala T, Katari NK, Palakurthi AK, Jonnalagadda SB. Stability indicating HPLC method for simultaneous quantification of 14 impurities in excedrin tablet formulations and identification of new impurity by LC-MS in accelerated stability studies. Biomed Chromatogr 2019. Doi.org/10.1002/bmc.4608.
26. Thirupathi D, Palakurthi AK, Vytla Y, Katari NK. A novel UPLC-PDA isocratic method for the quantification fulvestrant in oil-based pre-filled syringe injection matrix formulations. J Anal Sci Technol 2019;10:12. 27. Rao KL, Reddy KP. Stability-indicating liquid chromatographic
method for the simultaneous determination of ascorbic acid, citric acid, butylated hydroxyanisole, simvastatin and related compounds in pharmaceutical solid dosage form. Int J Anal Pharm Biomed Sci 2014;3:1-10.
28. Rao KL, Reddy KP. Stability-Indicating method for simultaneous determination of polar and non-polar related compounds of zidovudine in drug substance and drug product tablet form. Int J Res Pharm Sci 2015;6:5-14.
29. Rao KL, Rao KP. Development and validation of a stability-indicating LC method for determination of bexarotene in softgel dosage
formulation. Chromatographia 2017;80:1211-24.
30. Basha SS, Manikanta S, Jahnavi T. UV spectrophotometric determination of rupatadine fumarate in bulk and tablet dosage form by using single point standardization method. Int J Pharm Pharm Sci 2019;11:120-4.
31. Thota B, Adepu GS, Galla R. Method development, validation and stability studies for the determination of lurasidone hydrochloride in bulk and tablet dosage form by rp-hplc. Int J Pharm Pharm Sci 2018;10:58-63.
32. Sharma D, Singh G, Kumar D, Singh M. Development and validation of spectroscopic method for simultaneous estimation of salbutamol sulphate, ambroxol hydrochloride and cetirizine hydrochloride in combined pharmaceutical tablet formulation: A novel technique for
In vitro dissolution studies. Int J Pharm Pharm Sci 2014;6:446-52. 33. Biba E. Residual Solvents. Vol. 4. Ch. 467. USP41-NF36; 2018.
p. 6222-37.
34. Impurities Guideline for Residual Solvents, International Conference on Harmonization; 2016. p. 1-34.
35. Tirumalai RS. Microbiological Examination of Non-sterile Products: Microbial Enumeration Tests. Vol. 4., Ch. 61. USP41-NF36; 2018. p. 5965-71.
36. Tirumalai RS. Microbiological Examination Of Non-sterile Products: Tests for Specified Microorganisms. Vol. 4., Ch. 62. USP41-NF36; 2018. p. 5971-8.
37. Zaidi K. Elemental Impurities-Limits. Vol. 4., Ch. 232. USP41-NF36; 2018. p. 6147-51.
38. Zaidi K. Elemental Impurities-Procedure. Vol. 4., Ch. 233. USP41-NF36; 2018. p. 6151-5.