695
ANALYSIS OF STRATEGIC EMERGING INDUSTRIAL
TECHNOLOGY INNOVATION INFLUENCE FROM R&D,
MARKET SYSTEM AND GOVERNMENT POLICY
LIPING FU, XIAOJING LI*, YONGJUN HE
Public Resource Management Research Center, Management and Economic Department,
Tianjin University, Tianjin 300072, China
*E-mail: l[email protected] , corresponding author
ABSTRACT
Technology innovation is the key motivation to push strategic emerging industry development. Research on key factors to influence industrial technological innovation is essential to enhance strategic emerging industrial technology innovation. This paper analyzes the various factors that influence industrial technology innovation by the fixed effects variable coefficient model. Through the expanding knowledge production function, considering the endogenous variables (R&D, market system) and exogenous variables (government policies) on the technology innovation of comprehensive effect, the model operates panel data in 10 industries from China's three great strategic emerging industries from 1996 to 2010. The results show that R&D input has a positive effect on various industries, the market system and the government policy has complementary effect on various industries influence, and various factors contribution on the biological industry and high-end equipment manufacturing technology innovation is superior in the information technology industry.
Keywords: Strategic Emerging Industry, Technology Innovation, Fixed Effect Variable Coefficient Model
1. INTRODUCTION
A Strategic emerging industry, based on the important technical breakthroughs and development needs, is an industry with deeper integration and emerging technology, which are the new measures of the national economic growth mode change and the core of strategic emerging industries. Its outstanding characteristic is knowledge intensive, material resources consumption. Science and technology innovation is the core of strategic emerging industry development. Therefore, the study of the key factors which affect technological innovation, to enhance strategic emerging industrial technology innovation and to promote strategic emerging industry development is very important.
Since Schumpeter put forward his innovation theory in 1912, the influencing factors of technological innovation have achieved fruitful results. These results were more focused on the regional and corporate levels with relatively less research on the influencing factors of technological innovation from the industrial point of view. R&D investment was considered important as it played a positive role in technological innovation [1-3], through a seed effect, and a production effect, and self-reinforcing effect [4]. However, the study
proved R&D investment is subject to a "threshold effect", only when the flow rate, pressure and energy were able to reach a certain "critical value", could the desired market effects be obtained [5]. Human capital, intellectual capital [6,7], and knowledge spillovers [8] were also considered to be supporting factors of technological innovation; there is a very strong positive effect on the
efficiency of technological innovation, and
knowledge spillovers [9] in the industries open to foreign investment. The industries open to foreign investment, due to less economic linkages with foreign and domestic enterprises or technology gaps, less and did not generate significant knowledge spillovers.
In addition to analyzing the influencing factors of technological innovation from R&D investment, Helpman [10] thought that, compared to the R&D
investment, physical or human capital
696 consider that FDI institutions generate positive spillover effects to the host country [16,17] through demonstration effect [18], competition effects [19], the linkage effect [20] and human capital flow effects [21] and in other ways. Analysis of these factors was, basically, the analysis of a factor or several factors, the influence of the pharmaceutical industry, manufacturing a certain type of industrial technology innovation. Due to the homogeneity of these industries, the studies were limited to analysis of the various factors influence on the whole industry. Many studies used a variable intercept model with random effects or fixed effects. A variable intercept model was used to measure different variables effect on the whole industry, in specific industries, the development differences cannot be reflected. There was less research about what factors Influence Chinese technological innovation of strategic emerging industries.
With the development of empirical methods, research and R&D capital, human capital, foreign investment, market structure and ownership structure, firm size, financing structure and other factors’ impact on technological innovation is also increasing [22, 23]. In addition to these factors, some scholars believe that industry agglomeration [24-25], technology innovation diffusion speed [26], the level of industrialization [27], and government investment [28] all have significant
positive relationships with technological
innovation. In addition to analysis of the industrial technology innovation and impact factors, more and more attention to the analysis of soft influencing factors; Hongming Xie integrate organizational culture, knowledge integration, and internal social capital in a theoretical model, using structural equation model [29]. However, as soft factors are difficult to quantify, they did not measure the impact of government policies and the system of industrial technology innovation.
The foundation of above research model is the
Cobb-Douglas production function and the
knowledge production function, from which a double logarithmic model is constructed for empirical analysis. Variables in the production function are endogenous, as exogenous variables can not reflect government policies. In addition, commonly used model include TOBIT model (Luo Yan, 2010), dynamic econometric model such as SVAR model [30] and VAR model [31]. The TOBIT model is often used to analyze the impact of various factors on the efficiency of technological innovation; dynamic econometric models are often based on time series data used for research on the
dynamics of an industry. In recent years, the application of the panel data model has greatly enriched empirical studies, mostly using a random effects models for panel data (fixed effects model) (Aijun Fan, Yunying Liu, 2006; Liu, 2010; Bibo Dai, 2012 [32]). However, these models were limited to the use of a variable intercept model, didn’t measure heterogeneity industry gaps and the different degree of their change.
In summary, the seven strategic emerging industries are different, and the impacts of various factors on technological innovation are distinct, so taking into account the characteristics of emerging industries, such as technical, intellectual, strategic and political, this paper is based on an extended knowledge production function, using R&D inputs and institutional factors as endogenous variables,
government support policies as exogenous
variables, and considers the variable lag effect, and the select panel fixed effect variable coefficients model to analyze the effects of the influencing factors of technological innovation, in order to provide a reference for the development of strategic emerging industries industry.
2. THEORETICALMODELS
2.1 Knowledge Production Function
The knowledge production function (KPF) is a common model to study knowledge production and technical innovation. It was proposed by Griliches (1979) [33], and its essence is a Cobb-Douglas production function with two elements and is used to measure the effects of R&D and knowledge overflow on productivity growth. Subsequently, Jaffe (1989) [34] improved the KPF, by considering that new economic knowledge is the important goals of enterprises, and is the result of investment. He extended the range of input factors, regarded R&D investment and human capital as input factors; the basic form of the model is:
i i
a i
t AK L
Y = βε (1)
In this model, Y denotes the intensity of R&D activities; K denotes R&D funds investment; L denotes for a series of variables of economic and social factors for impacting the output of technological innovation, including human capital
and other variables. α,βare elasticity coefficients
697 Researches proved, not only R&D funds
investments have a significant effect on
technological innovation, but also capital was one of the most important factors affecting technical efficiency [35]. With institutional economics development, the institutional factor was viewed as an endogenous variable that affected economic growth.
Institutional economists as represented by North (1994) attach great importance to the role of the institutional evolution in economic and social development, and that system innovation can significantly improve the flow of technology efficiency, and is associated with advanced
technology production activities to normal
operation[36]. Steven, Catherine(2003) also pointed out that the national system has a huge influence on innovation processes, innovation capability, and the value of innovation [37]. Thus this paper regards institutional factors as endogenous variables in the model, which are denoted by Z.
Based on the above understanding, this paper used the Griliches-Jaffe knowledge production function, improved by adding market factors to analyze the effect factors of technological innovation of strategic emerging industries. The knowledge production function can be written as:
i i i
a i
t AK L Z
Y = β ν
ε
(2)
Taking logarithms on both sides, the form of the model becomes:
lnY =lnA+αlnK+βlnL+νlnZ+lnεi
(3)
Emerging industry technological innovation capability is not only based on internal driving factors, such as human capital and R&D funds investment, the degree of market-oriented and so on, but also depends on external factors, such as industry, environment, policy environment and so on. In 2010, strategic emerging industries have a strong policy-orientation with strong industrial development and technological innovation. Thus government policy variables (S) as the impact of industrial technological innovative exogenous
variables, affect the economic mechanism.
Exogenous variables in the model, cannot exist in the form of a logarithmic function, and thus are added to the model as a separate independent variable.
In summary, this paper constructed the theoretical model:
i i i i i
i K L Z S
A
Y ln αln βln νln lnε
ln = + + + + + (4)
2.2 Panel Data Model
A Panel data allows researchers to distinguish the information that cross-section data or time series data alone cannot get. Panel data can overcome the problem of the lack of observations or variables with missing data; the measurement is estimated to bring a greater degree of freedom. Any simply using time series data can only reflect the dynamic
changes and cannot examine the specific
differences between various industries. Shorter time series, estimated by the least squares method to make the parameters estimated failure. STET cross-section data to examine the difference of the technical features between industries cannot be used to analyze the dynamic changes of the technological level of industries. Therefore, this paper uses a panel data model for analysis in various industries.
There are three types’ panel data models: pooled model, random effects model and fixed effects model. [38]
Type 1: Pooled Model
If any individual and cross-section do not exhibit
significant differences, that is, α,β are the same,
then the pooled model is applicable, which was expressed as:
yit =α+Xit′β+uit (5)
In the formula, y is the dependent variable; it
it
X′ is k×1 order column vector of dependent
variables; α is intercept;β is k×1order column
vector of regression coefficients; u is random it
error(scalar); i=1,2,L,N,Ndenotes the number of
cross-sections; t=1,2,L,T,T denotes the length of time.
Type 2: Fixed Effects Model
Fixed effects model includes an entity fixed effects model, a time fixed effects model, and a time and entity fixed effects model.
An entity fixed effects model, that is, for different individuals of different intercept model, but for a different cross-section, the intercept of the model have not change significantly. The formula is:
yit =αi+Xit′β+uit (6)
In the formula,αi is a random variable which
indicates that there are i different intercepts for i
individuals, and it change relevant withX ; it β is
1 ×
698 coefficients, that is, regression coefficients are same for different individuals. The remaining symbols are the same meaning as in the above formula.
A time fixed effects model, that is, for different cross-sections of different intercept model. The formula is:
it it t
it v X u
y = + ′β+ (7)
In the formula,v is the intercept, and it is a t
random variable, which denotes that there are T different intercepts for T different cross-sections,
and it changes relevant withX . it
A time and entity fixed effects model, it is a model that, for different cross-sections (point in time) and different time series (individuals) has different intercepts. The form of the model is:
yit =αi+vt +Xit′β+uit (8)
Symbols in the model are the same meaning in the above formula.
Type 3: Random Effects Model
yit =αi+Xit′β+uit (9)
In the formula,αi is a random variable, whose
distribution has no relevance toX ; it u is random it
error (scalar); ~ ( , 2); ~ ( , 2)
u it
a
i iid
α
σ
u iidα
σ
α
areassumed to be independent and identically distributed, but not limited to what distribution.
Similarly, the random effects model also includes the time random effects and the individual time double random effects model.
3. VARIABLES SELECTION AND DATA
SOURCES
3.1 Variables Selection
Selection of dependent variable (Y). Because the quality and quantity of technical innovation cannot be measured, it’s measured commonly by alternative indicators. Internationally, the number of
patent license (or the number of patent
applications), total factor productivity of
technological innovation, and new product sales revenue are used to measure the output of technological innovation. The measurement of total factor productivity often includes human capital and R&D capitals, which are used to analyze the influence factors, multicollinearity may appear, therefore, such research in measuring the efficiency
of technological innovation often is based on the TOBIT model. The number of patents was widely used internationally as a technological innovation indicator, however, in recent years, some scholars to prove [14, 15], that the number of patents is the typical count variable, thus it is suitable for the binomial model, and does not apply to the linear model. New product sales revenue, represents the final result of the interaction of almost all technological innovation elements or relevant elements, so the new product sales revenue as an alternative indicator for measuring technological innovation, not only reflects the level of commercialization of innovations, but also includes the content of innovation processes.
Selection of independent variables. Based on the above theoretical model, R&D funds investment (RDK), human capital of R&D staff (RDL), institutional factors (Z) and government policy (S) were selected as independent variables. This paper used R&D expenditure Instead of R & D investment, R&D personnel full-time equivalent instead of investment in human capital, and government funding for science and technology activities in the proportion of government funding instead of government support policies. As the institution variables are difficult to quantify, the
market system could be choose, whose
quantification can refer to DU Ting, Pang East (2006) [39]: the level of development of the market can be defined as the degree of market-oriented, non-nationalization level and trade openness. The degree of market is represented by the investment market index, that is, the state-owned, non-collective investment proportion of the total fixed asset investment; the denationalization level is denoted by added value accounted for by non-state-owned economy gross domestic product; trade openness is expressed as a ratio of total imports and exports to GDP. Due to the data indicators’ consistency and data availability, this paper only uses denationalization level instead of the market system.
3.2 Data Sources
699 reference national industry classification 4-digit codes. This paper selects strategic emerging industries quasi pillar industries of bio-industry (chemicals manufacturing HX ,Chinese medicine manufacture ZY, biological and biochemical products manufacturing SH), a new generation of information technology industry (communications equipment manufacturers TX, electronic device
manufacturing DQ, electronic component
manufacturers DY, computer machine
manufacturing ZJ, computer external equipment manufacturing WS), and high-end equipment manufacturing industry (aircraft manufacturing and repair FJ, spacecraft manufacturing HT) ,which include 10 industries for empirical analysis.
Variables are selected using the "China Statistics Yearbook on high technology industry” from 1996 to 2011 and “China Statistics Yearbook" in 2011. In order to eliminate the impact of the price factor, this paper selected industrial product price index to deflate new product sales revenue to 1978 as the base period level. According to R&D price index [42] to deflate R&D expenditures and technological activity expenditures, the specific methods are as follows:
& 0.75 0.25
R D price index= ×PPIindex+ ×CPIindex (10)
4. MODELS ECONOMETRIC TEST
4.1 Stationarity Test Of Data
In order to avoid the model appearing spurious or with false regression, a stationarity test of the data is necessary. The standard method to test series stationarity is the unit root test. The unit root test is
usually executed through three models:
Dyt =µ+at+ρyt−1+ut (11)
Dyt=µ+ρyt−1+ut (12)
Dyt =ρyt−1+ut (13) The test should start from model (11). When the test formula excludes the trend item, then tests the model (12); when confirming t the test formula excluding intercept, then test the model (13).
If three model test results can not reject the null hypothesis, it can be believed that the time series data are not stationary, as long as one model test results reject the null hypothesis, it can be believed that the time series data are stationary. The panel data unit root test is divided into common unit root process and individual unit root process. This paper
uses the LLC(Levin, Lin & Chu t*)test (assumes
common unit root process) and the Fisher-ADF test (assumes individual unit root process).
[image:5.612.112.508.459.526.2]Unit root test results of each series are as follows:
TABLE I: Unit Root Test Results Of Original Series
Method Statistic (P-value) Y RDL RDK Z S
LLC t* Statistic
(Prob.**)
10.9232 (1.0000)
4.81203 (1.0000)
3.91893 (1.0000)
-1.76116 (0.0391)
-6.70185 (0.0000)
ADF-Fisher Chi-square Statistic (Prob.**)
7.94872 (0.9997)
3.45700 (1.0000)
11.1119 (0.9952)
18.8883 (0.8411)
60.3460 (0.0002)
** Probabilities for Fisher tests are computed using an asymptotic Chi.
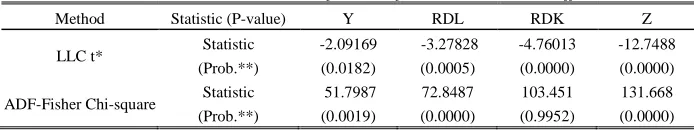
TABLE II: Unit Root Test Results Of Series After The First-Order Differential
Method Statistic (P-value) Y RDL RDK Z
LLC t* Statistic
(Prob.**)
-2.09169 (0.0182)
-3.27828 (0.0005)
-4.76013 (0.0000)
-12.7488 (0.0000)
ADF-Fisher Chi-square Statistic (Prob.**)
51.7987 (0.0019)
72.8487 (0.0000)
103.451 (0.9952)
131.668 (0.0000)
It can be seen from table I, except variable S, that each original series is non-stationary. So the series after the first-order differential should be tested.
It can be seen from table II, the P-value are all smaller than the significant level 0.05, it indicates that the four series become stationary after the first-order differential and all series are integer variables with order one that is denoted by I(1).
[image:5.612.135.482.551.616.2]700
4.2 Cointegration Test
Cointegration test means that there is a long term equilibrium relationship between some variables. The test premise is that the series have the same order integration. Two or more non-stationary series make cointegration test with different single integration order could make low-level single integration order be included in the cointegration test, when the number of independent variables is
[image:6.612.102.518.221.316.2]more than one, and the single integration order of any dependent variable not higher than that of any independent variable; that is, there are some low-level single integration series that have little effect on the results of cointegration, therefore, it is not important to include the variables. In this paper, government policy variables are stationary I (0), while the dependent variable is I(1) , thus it can be included in the model for cointegration test.
TABLE III : Cointegration Test Results
It can be seen from table III,that the statistic of
the Kao & Pedroni test is significant, that is, the null hypothesis can be rejected and series are cointegration. Through test, lnY, lnRDL, lnRDK(-1), lnZ and S cointegration exist, and RDK selected lag 1 period (determined by SIC criterion).
4.3 Model Specification
An appropriate model specification is the premise of the regression analysis. Which panel model can be used, is determined by the F-test (choose pooled model or fixed effects model), LM test (choose pooled model or random effects model) and the Hausman test (choose random effects model or fixed effects model).
Compared with the pooled model, whether it is necessary to establish an entity fixed effects model can be accomplished by the F-test.
Null hypothesis H0: ai=a0: Different individuals model have the same intercept (true model is pooled model)
Alternative hypothesis H1: Different individuals
model don’t have the same intercept (true model is entity fixed effects model)
F test statistic is defined as:
) ,
1 ( ~ ) /(
) 1 /( ) (
k N NT N F k N NT SSE
N SSE SSE F
u u
r − − −
− −
− −
=
(14)
In the formula, SSEr, SSEu denote the residual sum of squares of the constrained model (pooled
[image:6.612.321.519.354.396.2]model) and the unconstrained model (entity fixed effects model) respectively.
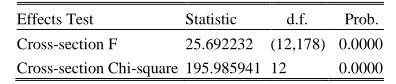
TABLE IV : Ftest Result For Cross-Section Fixed Effects
Effects Test Statistic d.f. Prob.
Cross-section F 25.692232 (12,178) 0.0000 Cross-section Chi-square 195.985941 12 0.0000
It can be seen from table IV, F=25.6922, p=0.0000<0.05, the results of the F test show that
the entity fixed effects model is better than the pooled model.
Choice of the random Effects Model or Entity Fixed Effects Model can be accomplished by the Hausman test. The hypothesis is:
H0: Individual effect isn’t related to regression variables (entity random effects model)
H1: Individual effect is related to regression
variables (entity fixed effects model)
Table V: Correlated Random Effects-Hausman Test
Test Summary Chi-Sq.Statistic d.f Pro.
Cross-section random 33.6867 4 0.0000
It can be seen from table V, H=33.686656, P-value<0.05, which indicates that the entity fixed effects model should be chosen.
4.4 Specific Form Of Fixed Effects Model
Fixed effects models include two forms: variable coefficient models and variable intercept models, which form to be selected usually is determined by the F test.
Form 1: variable coefficient model
i i i i
i xβ u
y =α + +
Test method Test hypothesis statistic(P-value)
Kao test H0:ρ = 1 -6.606222(0.0000)*
Pedroni test
H0: No cointegration(ρ = 1)
H1: common AR coefs. (within-dimension) (ρi = ρ)< 1
Statistic no weighted weighted
Panel PP -2.955753(0.0016)* -3.28730 ( 0.0005)* Panel ADF -3.038841 (0.0012)* -3.44657 (0.0003)*
H0: No cointegration(ρ = 1)
H1: individual AR coefs. (between-dimension)
Group PP -4.865665(0.0000)*
[image:6.612.316.530.554.589.2]701 Form 2: variable intercept model
i i i
i m xβ u
y = + +
α
*+Form 3: Constant parameter model
i i
i xβ u
y =α+ +
The hypothesis of F test: H1:β1=β2=L=βN
H2: α1=α2=L=αN,β1=β2=L=βN
Criterion rule: If don’t reject H2, that means constant parameter model should be selected, then the test is finished. If reject H2, test H1. If don’t
reject H1,that means variable intercept model
should be selected; If reject H1, that means
variable coefficient model should be selected. Test statistic F:
(15) )] 1 ( ), 1 )( 1 [( ~ )) 1 ( ( )] 1 )( 1 /[( ) ( 1 1 3
2 − + − + − −
+ − −
= F N k NT k
k N NT S k N S S F )] 1 ( , ) 1 [( ~ )) 1 ( ( ] ) 1 /[( ) ( 1 1 2
1 − − −
+ −
− −
= F N k NT k k N NT S k N S S F (16)
In this formula, S1 is the residual sum of squares
of the variable coefficient model; S2 is the residual
sum of the squares of variable intercept model; S3 is
the residual sum of the squares of constant parameter model.
Using Eviews7.0 software, it can be calculated
that S1=15.48395,S2=32.79251,S3=89.59113,
and it has been known that T=15, N=10, K=4,
df1=T-k-1=10, then use command @qfdist(d,k1,k2)
by Eviews and get F critical value under the significant level 5% (d=0.95):
Fα2(45, 100) =1.494394 Fα1(36, 100) =1.535138
Then using formulae (15) and (16), F2=8.397548
> Fα2, so reject H2; F1=3.907294> Fα1, so reject
H1.then it can be determined that the variable
coefficient model should be used.
5. EMPIRICAL ANALYSIS RESULTS
Based on the entity fixed effects variable coefficient model, in order to eliminate the
cross-section heteroscedasticity and series
autocorrelation, this paper uses Seemingly
Unrelated Regression to estimate the equation. Using Eviews7.0 software, results are shown in table VI.
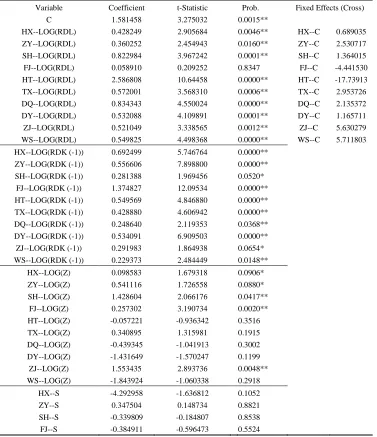
It can be seen from table VI, R2=0.97061,
F=478.6857, which P-value is smaller than 0.05, which means that the whole model fitting effect is better. DW=2.067966, which is close to 2, means that there is no one order autocorrelation.
From the various inputs, R&D input (including funding and personnel) has played a positive role for all industrial technological innovation. Though R&D staff of aircraft manufacturing did not pass the test of significance for technological innovation, but it still can be seen that its role in promoting technological innovation is positive. R&D funds lag a level and have a positive impact on technological innovation, which showed that R&D funding affects technological innovation at least after one year, and would not immediately create new product output. Complementary roles exist between government support and market-oriented degree of the various sectors. In almost all industries, government support for technological innovation has no significant impact. The industry affected from the degree of market orientation is not significant, but may be influenced significantly by government policies.
702 integration or advanced foreign enterprises to cooperate. Thus, the opening up of the market has a significant role in promoting cooperation for innovation, which can be seen from the contribution coefficient (0.257302) to technological innovation from the market variables Z. Besides, one period lag of R&D funding for investment in technological innovation has a significantly positive role and the highest contribution in all industries, which is 1.374827--which shows that if the aircraft
manufacturing industry wants to promote
technological innovation, it needs to continue to improve the level of R&D investment.
Aerospace manufacturing is a pioneer in the
manufacturing of high-end equipment, its
technological level and production capacity can reflect the strength of the country's manufacturing sector better. With China's rapid economic development, the aerospace industry has been growing steadily. As can be seen from Table 6, R&D staff gave the highest contribution rate to the spacecraft manufacturing technological innovation in all industries, which is 2.586808; the contribution of R&D funds input and government support for
aerospace manufacturing are also higher,
[image:8.612.124.501.289.726.2]respectively 0.549569 and 1.467886, which played a positive role. The degree of market influence has no significant effect, because t test did not pass the aerospace industry, which indicates that the aerospace industry should make state holding strategy highly developed.
Table VI: Estimate Results Of Entity Fixed Effects Variable Coefficient Model
Variable Coefficient t-Statistic Prob. Fixed Effects (Cross)
C 1.581458 3.275032 0.0015**
HX--LOG(RDL) 0.428249 2.905684 0.0046** HX--C 0.689035
ZY--LOG(RDL) 0.360252 2.454943 0.0160** ZY--C 2.530717
SH--LOG(RDL) 0.822984 3.967242 0.0001** SH--C 1.364015
FJ--LOG(RDL) 0.058910 0.209252 0.8347 FJ--C -4.441530
HT--LOG(RDL) 2.586808 10.64458 0.0000** HT--C -17.73913
TX--LOG(RDL) 0.572001 3.568310 0.0006** TX--C 2.953726
DQ--LOG(RDL) 0.834343 4.550024 0.0000** DQ--C 2.135372
DY--LOG(RDL) 0.532088 4.109891 0.0001** DY--C 1.165711
ZJ--LOG(RDL) 0.521049 3.338565 0.0012** ZJ--C 5.630279
WS--LOG(RDL) 0.549825 4.498368 0.0000** WS--C 5.711803
HX--LOG(RDK (-1)) 0.692499 5.746764 0.0000**
ZY--LOG(RDK (-1)) 0.556606 7.898800 0.0000**
SH--LOG(RDK (-1)) 0.281388 1.969456 0.0520*
FJ--LOG(RDK (-1)) 1.374827 12.09534 0.0000**
HT--LOG(RDK (-1)) 0.549569 4.846880 0.0000**
TX--LOG(RDK (-1)) 0.428880 4.606942 0.0000**
DQ--LOG(RDK (-1)) 0.248640 2.119353 0.0368**
DY--LOG(RDK (-1)) 0.534091 6.909503 0.0000**
ZJ--LOG(RDK (-1)) 0.291983 1.864938 0.0654*
WS--LOG(RDK (-1)) 0.229373 2.484449 0.0148**
HX--LOG(Z) 0.098583 1.679318 0.0906*
ZY--LOG(Z) 0.541116 1.726558 0.0880*
SH--LOG(Z) 1.428604 2.066176 0.0417**
FJ--LOG(Z) 0.257302 3.190734 0.0020**
HT--LOG(Z) -0.057221 -0.936342 0.3516
TX--LOG(Z) 0.340895 1.315981 0.1915
DQ--LOG(Z) -0.439345 -1.041913 0.3002
DY--LOG(Z) -1.431649 -1.570247 0.1199
ZJ--LOG(Z) 1.553435 2.893736 0.0048**
WS--LOG(Z) -1.843924 -1.060338 0.2918
HX--S -4.292958 -1.636812 0.1052
ZY--S 0.347504 0.148734 0.8821
SH--S -0.339809 -0.184807 0.8538
703
HT--S 1.467886 3.969727 0.0001**
TX--S -17.28294 -5.805320 0.0000**
DQ--S -4.373260 -2.775756 0.0067**
DY--S 3.580766 2.843407 0.0055**
ZJ--S -14.29557 -1.751897 0.0832*
WS--S -14.30530 -3.119575 0.0024**
R-squared 0.970612 F-statistic(P-value) 478.6857(0.00000)
Sum squared resid 12.62619 Durbin-Watson stat 2.067966
**denote the estimator is significant at the 0.05 significance level. *denote the estimator is significant at the 0.1 significance level.
Biological manufacturing industry: R & D funds and staff input of chemicals, Chinese medicine manufacturing, biological and biochemical products manufacturing gave positive role in promoting
technological innovation. Human input of
biological and biochemical products industry has the highest contribution rate of technological innovation, and the contribution rate is 0.822984; while its R&D expenditure in the three industries is
the smallest contribution to technological
innovation(0.281388), which showed that the contribution of R&D personnel were greater than R&D expenditure. Chinese medicines Manufacture are gradually developing in the international and shared markets. The R&D personnel, funding, market-oriented system all played positive roles in
promoting technological innovation; though
government support had no significant effect on technical innovation, from the sign of the coefficient if can be seen to have positive effects. The impact of government support of three industries for technical innovation was not significant, but the market system has a significant positive effect, especially in the biological and biochemical products industry; the contribution rate was 1.428604, at higher levels than all other industries. That showed Open market contributes to the bio-industry technological innovation, and market demand orientation, is the main direction of
the national strategic emerging industry
development of the bio-industry.
Information technology industry: R&D funding and human capital investments generate a positive promotion effect on technological innovation of all industries and the contribution rates of the various industries are not very different. Government support has significantly affected on all industries, however, it only had a positive effect on the electronic components manufacturing industry, while it had negative effects on the other four industries. The market system only affects technological innovation on computer machine manufacturing significantly. This is due to poor
international competitiveness of China's IT
industry, the five industries analyzed in this paper are the basis of the information technology industry, its ability to innovate is weak, and therefore completely open to market and government policy support, it is difficult to solve the innovation of new
products problems. Enhancement of the
competitiveness of the new generation of IT industry should not be limited to the increase in R & D investment and policy to support the basic industries, but also the development of a positive development of the Internet of things, cloud computing, three networks combined with emerging technology industries and so on, to improve the level of innovation.
6. CONCLUSIONS
R&D investment (including funding and human capital) plays a positive role in all industrial technological innovation. R&D human capital input gives the most obvious contribution to spacecraft
manufacturing, more obvious to electronic
components manufacturing, biological and
biochemical products industry; R&D funds input often have a lag effect, it has the highest contribution rate in the technological innovation of aircraft manufacturing and repair industry in high-end equipment manufacturing, where the positive effect is most obvious, followed by chemicals manufacturing, the Chinese patent medicine manufacturing and aerospace equipment manu-facturing.
Complementary roles of government support and market-oriented system of the various industries, basically in all industries, government support have no significant impact for technological innovation, instead by the market system; the industries that affected by the degree of market is not significant, contrary affected significantly by the government policies.
Comparing the three strategic emerging
704 have obvious effects on technological innovation of bio-industry and high-end equipment manufacturing industry, and weaker effect on information technological industry. Improving the level of the market-oriented helps to promote the technological innovation of the bio-industry and high-end equipment manufacturing industry. While the degree of market openness of the IT industry has reached a certain level, and the development of the market is relatively mature, it is difficult for the market to plays a higher facilitating role. Government support play a greater role in
promoting the technological innovation of
aerospace equipment manufacturing and electronic components manufacturing industry, but has a negative effect on equipment manufacturing, electronic device manufacturing, computer machine manufacturing, computer peripheral equipment manufacturing industry. The IT industry’s ability to innovate is weak, and international competitiveness is poor, therefore result the promote role of government policy is not obvious. Lacking of some data of strategic emerging industries, such as internet of Things, cloud computing, three networks joint industry, make incomprehensive analysis of the information technology industry, which need to further study.
REFRENCES:
[1] Scherer Frederic M, “Firm sizes, market
structure, opportunity and the output of patented innovations”, American Economic Review, Vol. 55, No. 3, 1965, pp. 1097-1125.
[2] Hausman, J., Hall, B.H.,Griliehes, Z.,
“Econometric models for count data with and application to the Patents-R&D relationship”,
Econometrica, Vol.52, No. 4,1984,pp.354-383.
[3] Licht.G., Zoz K., “Patents and R&D: an
econometric investigation using applications for German, European and US patents by German companies”, The Eeonomics and Eeonometrics of
Innovation. Kluwer Academic Publishers,2000,
pp. 307-338.
[4] Zhiguo Lu, “The Transmission Mechanism for
the Effect of Investment in R&D on Tech-nological Innovation”, Journal of Shenzhen
University, Vol. 22, No.5, 2005, pp.25-28.
[5] Shixian Zhang, “Efficacy of Threshold: An
Analysis of Low Industrialization of Technical Innovation”, China Industrial Economy, Vol.4, No.4, 2005, pp.45-52.
[6] Bontis, N., “National intellectual capital index: a United Nations initiative for the Arab region”,
Journal of Intellectual Capital, Vol.5, No.1,
2004, pp. 13-39.
[7] John P. Meyer, “Effects of Exploration on the
Relationship Between intellectual Capital and the Retained Technical Value of Innovation”, International Journal of Innovation Management. Vol.15, No.2, 2011, pp. 249-277.
[8] Michael Fritsch, Viktor Slavtchev, “How Does
Industry Specialization Affect the Efficiency of Regional Innovation Systems”, The Annals of
Regional Science,Vol.45, No.1,2010,pp.87-108.
[9] Wenbing Sha, Guixiang Li, “Knowledge
Spillovers of FDI, Independent R&D Inputs and Innovation Abilities of the Domestic High-tech Enterprises”, World Economy Study, January, 2011, pp.51-56.
[10] Elhanan Helpman, Shihua Wang & Xiao Wu
translation, “The mystery of economic growth”,
China Renmin University Press, 2007.
[11] Philip J. Vergragt, Halina S Zejnwald Brown,
“Sustainable mobility: from technological
innovation to societal learning”, Journal of
Cleaner Production, No.15, 2007, pp.1104.
[12] Jon-Arild Johansson, “Organizational inno-vation
as part of knowledge management” International Journal of Information Management, No. 28, 2008, pp.403-412.
[13] Heinz D. Kurtz, “Innovations and profits
Schumpeter and the classical heritage”, Journal
of Economic Behavior & Organization, No. 67,
2008, pp.263-278.
[14] Hai-bin DENG, Jin-zhong LIAO, “Institution
arrangement and technology innovation:a study based on negative binomial model”, Studies in
Science of Science, Vol.27, No.7, 2009,
pp.1101-1109.
[15] Cui ZHANG, “Industrial Agglomeration and
Innovation: An Application of the Negative Binomial Model”, Journal of Applied Statistics
and Management, Vol.31, No.1, 2012, pp.
105-111.
[16] Dianchun Jiang, Liangke Xia, “The Empirical
Study of the Function of FDI on Innovation in China’s High-Tech Industries”, World Economy, No.8, 2005, pp.3-10.
[17] Kui Yin Cheung, “Spillover Effects of FDI via
Exports on Innovation Performance of China’s
High-Technology Industries”, Journal of
Contemporary China, June, Vol. 19, No. 65, 2010,
705
[18] Findlay, R, “Relative backwardness, direct
foreign investment, and the transfer of
technology: a simple dynamic model”, The
Quarterly Journal of Economics, Vol. 92, No.1,
1978, pp. 1-16.
[19] Kokko, A. “Technology, market characteristics,
and spillovers”, Journal of Development
Economics, No.2, 1994, pp.279-293.
[20] Wang, J. Y., Blomstm, M. “Foreign investment
and technology transfer: a simple model”,
European Economic Review, Vol. 36, No.1, 1992,
pp.137-155.
[21] Pack, H., Saggi K., “Inflows of foreign
technology and indigenous technological
development”, Review of Development
Economics, No.1, 1997, pp.81-98.
[22] Aijun Fan, yunying Liu, “Quantitative analysis of
technical innovation effect factors of High technology industries in China”, Research on
Economics and Management, No.10, 2006, pp.
58-62.
[23] Wei Liu, “The Influencing Factors of
Technological Innovation of China’s High-Tech Industries: An Empirical Test Based on Panel Data Model”, Mathematics in Practice and
Theory, No.22, 2010, pp. 62-70.
[24] Catherine Beaudry, Peter Swann .Growth in
Industrial Agglomeration: A Birds Eye View of the United Kingdom, SIEPR Discussion Paper, 2001, 00238
[25] Chia-Lin Chang, Les Oxley .Industrial
Agglomeration, R&D and Total Factor
Productivity: The Case of Taiwan, Mathematics
and Computers in Simulation, Vol. 79, No. 9,
2009, pp.2787.
[26] Hu Pengwei, “The Differences and Influencing
Factors Study on Technology Innovation
Performance among Industries”, Dalian
university of technology master thesis, 2007.
[27] Luo Yan, “Evaluation on China’s Technological
Innovations of High-tech Industries and Analysis of Its Influence Factors”, Tianjin University of Finance and Economics master thesis, 2010.
[28] Wang Xianghua, Fu Liping, He Yongjun, “Our
country Regional Innovation System Government science and technology input benefit empirical analysis”, Scientific Management Research, 2011, 29(1):1-5.
[29] Xie Hongming, Wang Cheng, Li Xinchun, OU
Yi-yong. An empirical research of influencing technical innovation’s factor, Studies in Science
of Science, 2007, 25(5):963-970.
[30] Xiujiang Yu, Dongsheng Hu, HE Xin-wen,Wang
Xuanyu, “Dynamic Analysis of the Factors Influencing Technological Innovation in China—
—Empirical Research Based on SVAR Model”,
Soft Science, 2010(8):11-16, 20.
[31] Fan Qunlin, Shao Yunfei, Tang Xiaowo,
“Influencing Factors of Environmental
Technology Innovation on Chinese Auto
Industry”, Chinese Journal of Management, 2012, 9(9):1323-1329.
[32] Dai Bibo, Sun Dongsheng, Yao Fengge,
“Technological Innovation Efficiency Change and Influence Factors of Chinese Manuf acturing Industries——Based on Panel Data (2001-2008) of 29 Manufacturing Industries”, Journal of
Intelligence, 2012,(03):185-191, 123.
[33] Griliches Z. Productivity, R& D, and basic
research at the firm level in the 1970s [J]. American Economic Review, 1986, 76: 141- 154.
[34] Jaffe. A., “Real effects of academic research”,
American Economic Review, 1989, 79(5): 957-
970.
[35] Lucas, R.E., “On the Mechanics of Economic
Development”, Journal of Monetary Economics, 1988, Vol. 22: 3-42.
[36] Douglass C. North, “Institutions, Institutional
Change and Economic Performance”, China Times Press, 1994.
[37] Steven Casper, Catherine Matraves, “Institutional
frameworks and innovation in the German and UK Pharmaceutical industry”, Research Policy, 2003, 32:1865-1879.
[38] Zhang Xiaotong, “Applied Quantitative
Economics”, China Machine Press, 2006.
[39] Du Ting, Pang Dong, “The Institutional Shocks
and China’s Business Cycle”, The Journal of
Quantitative & Technical Economics, 2006(6):
34-43.
[40] Qi Yuqing, “The prediction and analysis of our
country strategic emerging industrial investment”,
China Economic & Trade Herald, 2012(4):
24-26, 46.
[41] Hu Zhiwei, “Research on Competition of
Strategic Emerging Industries in Developed
Provinces”, Finance and Trade Research,
2011(4): 40-50.
[42] Hedong Liu and Cheng Chen, “Chinese Original
High—tech Industry Technical Efficiency
Measure: Based on the Two Stage Analysis of the Innovation Chain Perspective”, Science and
Technology Progress and Policy, Vol. 28, No. 12,