Effect of direct reciprocity and network
structure on continuing prosperity of social
networking services
Kengo Osaka
1, Fujio Toriumi
2and Toshihauru Sugawara
1*Background
Social networking services (SNSs), such as Twitter, Facebook, and Google+, are fre-quently used by many users around the world not only to share and exchange local infor-mation among limited specialized and close-friend groups but also to publish/obtain
Abstract
Background: Social networking services (SNSs) are widely used as communicative tools for a variety of purposes. SNSs rely on the users’ individual activities associated with some cost and effort, and thus it is not known why users voluntarily continue to participate in SNSs. Because the structures of SNSs are similar to that of the public goods (PG) game, some studies have focused on why voluntary activities emerge as an optimal strategy by modifying the PG game. However, their models do not include direct reciprocity between users, even though reciprocity is a key mechanism that evolves and sustains cooperation in human society.
Proposed methods: We developed an abstract SNS model called the reciprocity rewards and meta-rewards games that include direct reciprocity by extending the existing models. Then, we investigated how direct reciprocity in an SNS facilitates cooperation that corresponds to participation in SNS by posting articles and com-ments and how the structure of the networks of users exerts an influence on the strate-gies of users using the reciprocity rewards game.
Experimental results: We run reciprocity rewards games on various complex net-works and an instance network of Facebook and found that two types of stable coop-eration emerged. First, reciprocity slightly improves the rate of coopcoop-eration in complete graphs but the improvement is insignificant because of the instability of cooperation. However, this instability can be avoided by making two assumptions: high degree of fun, i.e. articles are read with high probability, and different attitudes to reciprocal and non-reciprocal agents. We then propose the concept of half free riders to explain what strategy sustains cooperation-dominant situations. Second, we indicate that a certain WS network structure affects users’ optimal strategy and facilitates stable cooperation without any extra assumptions. We give a detailed analysis of the different characteris-tics of the two types of cooperation-dominant situations and the effect of the memory of reciprocal agents on cooperation.
Keywords: Social networking services, Meta-norms game, Reciprocity, Evolutionary game, Complex networks
Open Access
© The Author(s) 2017. This article is distributed under the terms of the Creative Commons Attribution 4.0 International License (http://creativecommons.org/licenses/by/4.0/), which permits unrestricted use, distribution, and reproduction in any medium, provided you give appropriate credit to the original author(s) and the source, provide a link to the Creative Commons license, and indicate if changes were made.
RESEARCH
*Correspondence: [email protected]
1 Department
of Computer Science and Communications Engineering, Waseda University, 3-4-1 Okubo, Shinjuku, Tokyo 169-8555, Japan
public information for the purposes of exchanging opinion, advertising, marketing, and politics [1, 2]. SNSs are usually run by companies and non-profit organizations but can-not persist without huge amounts of up-to-date content being continually posted by individual users. Such user activities incur various costs in terms of creating and sub-mitting the content, and why users continue to post articles and comments is not well understood. In addition, free riders (or lurkers) exist, that is, users who just read the con-tent and never post articles. To provide incentives to individual users to keep submitting content, many SNSs have introduced specific mechanisms, such as providing comments on articles, comments on comments, indication of the number of followers, signs show-ing articles have been read, and “Like” buttons. These mechanisms can provide quantita-tive rewards (e.g. showing the numbers of readers of articles and users who clicked on the “Like” buttons) as well as psychological rewards that provide feelings of connection to people and a sense of belonging [3]. However, these incentive mechanisms also rely on users’ voluntary behavior and, thus, incur some cost and time.
As the variety of social media on the Internet continues to grow, it is becoming impor-tant to identify the conditions, mechanisms, and/or design methodologies inherent to maintaining an active and thriving SNS. Thus, a number of approaches, such as network analysis [4, 5], social psychology [6], analysis of exchange patterns [7], and evolutionary game theory [8], have been used to tackle this issue. Here, we focus on the evolutionary game theoretic approach since the mechanisms maintaining for thriving of SNSs have not been fully investigated from this viewpoint.
In this approach, SNSs are assumed to have the characteristics of a public goods game, because SNS are shared resources sustained by many users. For example, Toriumi et al. [8] and Hirahara et al. [9] modeled an SNS as a rewards game (RG) and a meta-rewards game (MRG), which are dual parts of Axelrod’s meta-norms game, and their own extension, called an SNS-norms game, to identify evolved behaviors of agents that
model SNS users. They then analyzed the conditions under which a
cooperation-dom-inant situation arises, where cooperation in this game corresponds to posting an arti-cle and a comment and a cooperation-dominant situation corresponds to a situation in which most users post them, so SNSs are active. They found that meta-rewards such as comments on article comments [8] and a simple (so, low-cost) response mechanism for rewards such as “Like” buttons for articles [10] play an important role in SNSs. However, these studies did not consider social and personal relationships between peers. Further-more, some SNSs have no mechanism to provide meta-rewards, so another mechanism and/or interactive structure also seems to affect SNS activities.
Cooperation is a key activity to maintain public goods games. Nowak [11] pointed out that at least one of five mechanisms—kin selection, direct and indirect reciprocity, net-work reciprocity, and group selection—is necessary for cooperation to evolve in human
society. Rand and Nowak [12] subsequently showed empirical evidence of human
Thus, our study was aimed at investigating the effect on direct reciprocity between users on cooperation-dominant situations and how network structures affect the users’ interaction strategy. For this purpose, we extended an existing abstract model of an SNS [8] to include direct reciprocity. The extended model is called a reciprocity (meta-) rewards game whose structure is similar to the (M)RG, but agents tag peer agents and decide their behaviors on the basis of recent reciprocal behaviors of these peers. We then tried to determine the circumstances in which the rates of cooperation increase and when the established cooperation collapses in this game. Note that we particularly focused on the reciprocity rewards game that has no mechanism for giving a meta-reward because a number of thriving SNSs do not have meta-meta-rewards as mentioned above; thereby, we wanted to find another mechanism or interaction structure that pro-motes a thriving SNS.
We experimentally show that in complete graphs, the Watts–Strogatz (WS) model [15], the connecting nearest neighbor CNN model [16], and Barabasi–Albert (BA) model [17] networks, users do not cooperate with all neighbor agents but rather with a few close friends established on the basis of past reciprocal behavior. To explain this phenomenon, we propose the concept of half free riders (or partial lurkers) and dis-cuss the interaction structure needed to maintain a cooperation-dominant situation in which the SNS continues to prosper. This is one main difference from the previous stud-ies [8, 10]. Our experimental results suggest that user behavior like a half free rider sus-tains cooperative activity in all types of network. However, this phenomenon raises in complete graphs under the additional conditions that (1) agents seldom miss the posted articles and (2) they do not comment on articles posted by non-reciprocal agents. We also conducted experiments using WS, BA, and CNN networks and tried to understand how the network structure affected reciprocity, and thus the prosperity of the SNS. We found that the network structure strongly affects continuation of a cooperation-domi-nant situation without any additional conditions. We also examined the (non-)reciprocal relationships and the effect of varying the term of memory of the reciprocal agents.
Related work
A number of studies have paid attention to reciprocity between users by conducting empirical analyses. For example, Surma [18] focused on reciprocity because it is crucial in social exchanges. He analyzed reciprocity on Facebook and showed strong empirical evidence that reciprocity messages sent from a user on online social networks increase reciprocity reactions from her/his audience. Faraj and Johnson [7] found that network exchange patterns in an online community are characterized by reciprocity patterns and are different from those characterized by preferential attachment [17]. Takano et al. [14] analyzed player action logs and found that cooperation based on reciprocity could be observed in a network game. These papers suggest that reciprocity is a key factor in keeping social media thriving.
A number of studies proposed abstract models of social media and investigated their
properties. Anderson [19] proposed a game theoretic approach aimed at
understand-ing how social media emerge as a drivunderstand-ing force in contemporary marketunderstand-ing and how this would affect future marketing. Toriumi et al. [8] revealed that SNSs have similar properties to public goods games, but they correspond to the dual part of the
meta-norms game [20] because SNSs seem to lack a means of punishing non-cooperators and
only give (psychological) rewards to cooperators. Their model includes two games, the rewards game (RG) and the rewards game (MRG), and they indicated that meta-rewards facilitate cooperation, resulting in active use of an SNS. Hirahara et al. [9, 10] subsequently extended this model to the SNS-norms game that includes the character-istics of the interaction patterns in SNSs. They ran this game in a variety of complex networks and found that users at network hubs facilitate posting articles to some degree even if no meta-reward is provided. However, their study did not take into account reciprocal relationships between peer agents.
We have already presented a model including reciprocity in an SNS [21], but described only a few experimental results on it. This paper is an extended version of our previous workshop paper [21], and it details more thorough experiments using a variety of com-plex networks and discusses the characteristics of our model through a detailed analysis.
Proposed model for social networking services
Reciprocity rewards and meta‑rewards games
the reciprocity meta-rewards game (RMRG) by incorporating reciprocal relationships among agents into the RG and MRG (see Fig. 2).
Let A= {1,. . .,n} be the set of agents. Agents are connected with a graph G=(A,E),
where E is the set of links between agents. The set of neighbor agents of i∈A is denoted by Ai (⊂A). Agents in an R(M)RG game select the strategy of either cooperation or defec-tion. Cooperation indicates posting articles and comments, and defection indicates just reading them. A user who almost always selects defection is defined as a free rider. Agent i∈A has three learning parameters: the probability of cooperation (i.e. posting a new article) Bi, the probability of giving rewards (e.g. posting a comment on the article) to reciprocal agents LCi, and the probability of giving rewards to other (normal) agents LNi.
We call Bi, LCi, and LNi the article posting rate, the reciprocal comment rate, and the
nor-mal comment rate, respectively. We also call LCi and LNi the comment rates hereafter. To
apply the genetic algorithm (GA), we express each of these parameters as three bits, so they take on a discrete, i.e. value 0/7, 1/7,…, or 7/7. This expression is identical to the one used in the meta-norms game [20]. Agent i has a memory for reciprocal agentsWi (⊂Ai),
which is the set of reciprocal agents that are defined as neighbor agents that posted com-ments on i’s articles in the most recent TW(>0) rounds. Positive integer TW is called the
does not reward rewards
cooperates gets gets
gets gets
does not see does not reward gets
gets
does not see
defects
sees
sees rewards
Rewards Game
Meta-Rewards Game
Fig. 1 Meta-rewards and rewards games
Reciprocity Meta Reciprocity Rewards Game
does not reward cooperates gets gets
gets gets rewards
defects
does not see
sees does not reward
gets
gets rewards
does not see sees
Rewards Game
memory term. We define a round as the period in which all agents perform R(M)RG or (M)RG once with the neighbor agents.
An RRG or RMRG proceeds as follows. For ∀i∈A, the parameter Sit (0≤Sit≤1) is
defined randomly or with a certain method in the t-th round (t is a positive integer) when i is going to post an article. Intuitively, Sit expresses the degree of fun of (or the
degree of attention to) the contents of the article that i is going to post and the associ-ated comments after that. Thus, if Sit≥1−Bi, i posts a new article with cost F and agent ∀j∈Ai reads the article posted by i and gains reward M by reading it. Then, j proceeds
to the next phase with probability Sti. Then, agent j comments on the article with
prob-ability Lji, where Lji =LCj if i∈Wj; otherwise Lji=LNj. Then, j pays a cost C, and i gains a reward R through j’s comment. The game chain so far is referred to as the RRG.
Subsequent to the RRG, k∈Ai reads j’s comment and proceeds to the next phase with
probability Sit. If this happens, k posts a response to the comment with probability Lkj, where Lkj=LCk if j∈Wk and Lkj =LNk if j�∈Wk. When k posts it, k pays a cost C
′′ and j
gains a reward R′′. The RMRG ends here. Note that, because reciprocity is not taken into account in RG or MRG, agent i has only two parameters, Bi and LNi (LNi is denoted by
Li in RG) and Wk = ∅. Li in (M)RG is called the comment rate after this. The glossary of
variables used in the RRG and RMRG is shown in Table 1.
From the definition of reciprocal agents, a reciprocal relationship is mutual or one sided, and expresses the internal cognitive state of each agent. We think that the two types of reciprocity exist in the human relationships and thus in SNSs. This will be dis-cussed using the experimental results in the "Analysis of reciprocal relationship" section.
Evolution by genetic algorithm
Reciprocity rewards game and RMRG are evolutionary games, as are the (meta-)norms game and (M)RG, and we define the evolutionary parameter setting in accordance with their experiments [8, 20]. One generation of the game is defined as a period in which all agents have four chances to post articles and write/receive comments related to them.1 At the end of one generation, each agent selects two agents as parents from its neighbors on the basis of fitness values, which are defined as the cumulative rewards received minus the cumulative costs incurred during the current generation. This process is con-tinued up to a certain generation.
Each of three learning parameters, Bi, LCi, and LNi, is represented as a three-bit gene,
and each agent has a nine-bit gene.2 The initial values of the nine-bit genes are set ran-domly. The evolution consists of three phases: (1) parent selection, (2) crossover, and (3) mutation. A child agent of i for the next generation is generated as follows. First, in the parent selection phase, i selects two parent agents from i and i’s neighbor agents on the basis of a probability distribution {j|j∈Ai∪ {i}} defined as
1 The length of one generation is determined according to the previous studies [8, 20]. We also conducted our experi-ments in which the length of generation was set to six, eight, or ten as well as four, but we could not see a clear differ-ence.
2 Likewise, two learning parameters in RG and MRG are encoded into a six-bit gene.
(1) �j =(vj−vmin)2/
k∈Ai∪{i}
where vk is the fitness value of agent k∈A, and vmin=mini∈Ai∪{i}vi. Then, two new genes are generated using uniform crossover from the genes in the selected parent agents and one of them is randomly selected in the crossover phase. In the mutation phase, each bit of the gene of the child agent is inverted with a probability of 0.005. This means that if there are 20 agents in the network, 0.9 bits will mutate on average. After that, the derived gene is used for the child agent of i.
Experiments and discussion
Experimental setting
We focused on the reciprocity rewards game (RRG) in the experiments because the reward had by commenting on a comment seems small and thereby insignificant in an SNS. Furthermore, simple response mechanisms (rewarding mechanisms), such as “Like” buttons and “read” icons, cannot be used to give meta-rewards for these simple responses. In the first experiment (Exp. 1), we compared the results of the RRG with those of the RG [8] and investigated the features of the RRG. The agent network (A,E) was a complete graph; we chose it because it was used in Toriumi [8] and also seems to be a basis of comparison with those when (A,E) are other types of network. The pur-pose of Exp. 1 was to investigate how reciprocity affected user behavior in an SNS by comparing the transitions of the average rates of cooperation, that is, posting an article or a comment, in the RG or RRG. Then, we also tried to ascertain the causes of sustain-ability and collapse of cooperation in the RG and RRG, as well as the reciprocal interac-tion structure in the RRG. The second experiment (Exp. 2) investigated how network structures affect cooperation and the reciprocal structure in RRG. For this purpose, we ran RRGs on the WS, CNN, and BA networks and compared their results with those of complete graphs. In the third experiment (Exp. 3), we clarified the effect of the memory term, TW, on the evolution of cooperation in various networks. Note that the
experi-mental data described below are the average values of 100 independent experiexperi-mental runs based on the different random seeds.
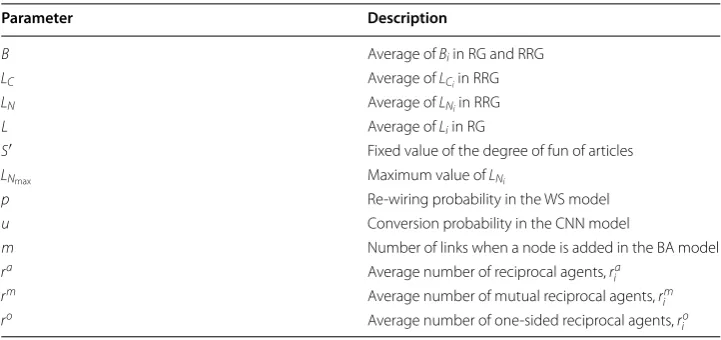
Table 1 Parameters/variables, descriptions in RRG and RMRG, and values in the experi-ments below
Parameter Description Value
A Set of agents |A| =20 or 1000
Bi i’s probability of posting an article Variable
LCi i’s probability of posting a comment to a reciprocal agent Variable
LNi i’s probability of posting a comment to a normal agent Variable
Sit Degree of fun of i’ article 0<Sti<1 (random)
F Cost of posting article −3.0
M Reward for reading article 1.0
C Cost of comment −2.0
R Reward for receiving comment 9.0
Wi i’ memory of reciprocal agents Variable
Role of reciprocity on cooperation—complete graphs
The parameter values in Exp. 1 are listed in Table 1. These values were determined on the basis of the experiments of Axelrod [20] and Toriumi et al. [8]. With this setting, Toriumi et al. [8] found that if the reward of comments was larger than the cost of post-ing articles and comments, cooperation emerged, but only in the MRG, and cooperation
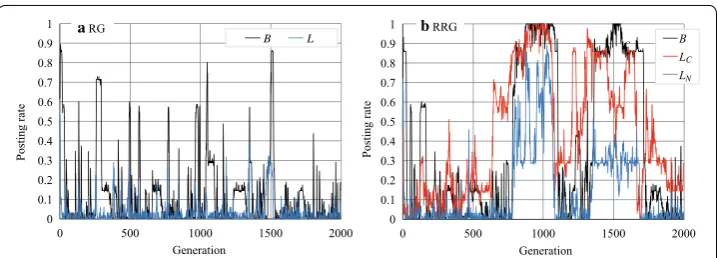
did not emerge if there was no meta-reward mechanism. Figure 3 indicates the
prob-abilities of posting articles and comments over the generations. Note that we defined the average posting article rate as B=i∈ABi/|A|, the average reciprocal comment rate as
LC =i∈ALCi/|A|, and the average normal comment rate as LN =
i∈ALNi/|A| in the
RRG. We also investigated B and the average comment rate L=i∈ALi/|A| in the RG.
Note that the parameters that are and will be defined in this section are summarized in Table 2.
In RG on the complete graph (Fig. 3a), B and L undergo transitions at approximately 0.11 and 0.05, respectively; this result is consistent with that of Toriumi et al. [8] as men-tioned above. On the other hand, in the RRG B and LC make transitions at approximately
0.33 and 0.40, respectively, and LN transitions at approximately 0.11 in RRG (Fig. 3b).
These results indicate that the values of B, LC, and LN are larger in the RRG than in
the RG. These figures suggest that by taking into account reciprocity when deciding the
Table 2 Glossary of parameters defined in the "Experiment and discussion" section
Parameter Description
B Average of Bi in RG and RRG
LC Average of LCi in RRG
LN Average of LNi in RRG
L Average of Li in RG
S′ Fixed value of the degree of fun of articles
LNmax Maximum value of LNi
p Re-wiring probability in the WS model
u Conversion probability in the CNN model
m Number of links when a node is added in the BA model
ra Average number of reciprocal agents, ra
i
rm Average number of mutual reciprocal agents, rm
i
ro Average number of one-sided reciprocal agents, rio
0 0.1 0.2 0.3 0.4 0.5 0.6 0.7 0.8 0.9 1
0 500 1000 1500 2000
B L L
0 0.1 0.2 0.3 0.4 0.5 0.6 0.7 0.8 0.9 1
0 500 1000 1500 2000
B L
Generation
Posting rate Posting rate
Generation
a Reward game (RG) b Reciprocity reward game (RRG)
N C
behavior, the activity in the SNS improves, although the amount of improvement is quite limited. Another observation is that the dispersion of B and LC were large (Fig. 3b).
To see more clearly why B, LC, and LN increased to a limited extent, we investigated
one experimental run of RG and RRG (Fig. 4). Figure 4a indicates that the article post-ing and comment rates, B and L, in the RG, rose intermittently (but never reached 1.0) but then quickly dropped off. Such temporary cooperation was caused by mutation. However, the RG cannot maintain a cooperative situation; for example, when B and L
increased in some agents, these agents temporarily gained rewards. However, because the free riders were benefited more in such a situation, cooperation soon disappeared.
On the other hand, in the RRG (Fig. 4b), B or LC sometimes reached (near) 1.0 and
lasted much longer than in the RG (although they also dropped rapidly afterward). This means that almost all agents cooperate (by posting articles) and post comments on coop-erators’ articles during this period. Furthermore, we can see that LC rarely fell to zero.
The difference between the RG and RRG is that agents in the RRG distinguish reciprocal agents from other agents and so behave differently towards them. That is, agent i with a large LC comments only on articles posted by reciprocal agents who commented on past
articles posted by agent i. Such selective comments prevent the collapse of cooperation by reducing the cumulative cost of making comments. However, they prevent collapse only when LC >LN; otherwise, when many agents begin to comment on arbitrary arti-cles without enough rewards and free riders gain high total rewards, cooperation col-lapses like in the RG.
Now let us explain what the above phenomena correspond to in an actual SNS. When SNS users do not consider direct reciprocity (that is, they are in an RG), users who would otherwise often comment must stop commenting because the RG has no incen-tive for it and it is more beneficial for agents to behave as free riders. On the other hand, if individual users consider direct reciprocity when making comments, they preferen-tially comment on posts by reciprocal users preferenpreferen-tially by referring to their memory,
Wi. Thus, when LC >LN, such selective comment behavior for receiving comments in the subsequent rounds sustains the norm for cooperation. We also believe that LC >LN is a reasonable assumption in an actual SNS. We discuss this in the "Discussion" section.
Sustainment or collapse of cooperation
We attempted to identify why the average rates of B, LC, and LNdeclined. The first factor
that affects sustainability of cooperation is the relative values of LC and LN, as mentioned Generation
Posting rate
0 0.1 0.2 0.3 0.4 0.5 0.6 0.7 0.8 0.9 1
0 500 1000 1500 2000
B L
Generation
a RG
Posting rate
0 0.1 0.2 0.3 0.4 0.5 0.6 0.7 0.8 0.9 1
0 500 1000 1500 2000
B L L b RRG
N C
C
above. Thus, we limited the maximum value of the normal comment rate, LNi, to LNmax
(0≤LNmax≤1). Note that LNi is expressed by three bits (it is a value ranging from 0 to
7), so the probability of the normal comment rate is (LNi×LNmax)/7. Another factor that affects the rewards of agents is the degree of fun of the posted articles and the associated comments, Sit. Thus, we set Sit to a certain positive constant value 0≤S′≤1, and
investi-gated how the evolution of cooperation changed as a result of varying S′.
Figure 5 plots the changes in B, LC, and LN over generations in the RRG when LNmax
was 0.1 (Fig. 5a) and when S′ was 1.0 (Fig. 5b). By comparing these figures with Fig. 3b, we can see that B and LC slightly increased in both cases, and no significant differences
existed between them. However, when we set LNmax =0.1 and S′=1.0, we observed the
emergence of cooperation, as shown in Fig. 6. To investigate the influence of LNmax and
S′ , we conducted a more detailed experiment. The results, plotted in Fig. 7, indicate how the posting rates varied in accordance with S′ (LNmax =0.1, Fig. 7a) and LNmax (S
′=1.0 ,
Fig. 7b). Figure 7b shows that when S′=1.0, if L
Nmax≤0.55, B was nearly 1.0, but it
gradually decreased to around 0.5 as LNmax increased from 0.5 to 1.0. Conversely, Fig. 7a indicates that when LNmax =0.1, if S
′≥0.8, B remained almost 1.0, but as S′ decreased
from 0.8 to 0, B gradually reached zero. Note that we will denote the RRG manipulated with parameters S′ and LNmax by RRG(S
′, L
Nmax), respectively, e.g. RRG (0.8, 0.1).
0 0.1 0.2 0.3 0.4 0.5 0.6 0.7 0.8 0.9 1
0 500 1000 1500
B L L
0 0.1 0.2 0.3 0.4 0.5 0.6 0.7 0.8 0.9 1
0 500 1000 1500
B L L
Generation
Posting rate Posting rate
Generation
a L = 0.1 (RRG) b S’ = 1 (RRG)
N C Nmax
N C
Fig. 5 Article posting and comment rates in RRG (LNmax=0.1 or S′=1.0)
0 0.1 0.2 0.3 0.4 0.5 0.6 0.7 0.8 0.9 1
0 500 1000 1500
B L L
Generation
Posting rate
N C
These results indicate that LNmax and S
′ strongly affect the emergence of cooperation
in the RRG: a smaller LN corresponds to the situation where agents may read articles
from non-reciprocal agents but do not comment on them that much. A larger S′
cor-responds to the situation where agents rarely miss articles posted by agents. Thus, while agents received more rewards from non-reciprocal agents by behaving like free riders, they commented on the articles posted by reciprocal agents. Both conditions must be satisfied in order to remove the causes of collapse from the RRG.
Effect of network structure
To investigate the effect of network structure on the emergence of cooperation in RRG, we ran the RRGs on WS networks [15] whose average degree was 20 (since the complete
graph in Exp. 1 was 20), on CNN networks [16] and BA networks. We set the number
of nodes (agents) to 1000 in each network. Note that we did not use S′ and LNmax in the
RRG, and so did not fix the degree of fun of posts, S, or limit the comment rates to the usual neighbors, LNi, in Exp. 2.
We observed quite different phenomena in the WS networks. As shown in Fig. 8,
the rates of B, LC, and LN remained relatively high and the dispersion of B was small
when 0≤p≤0.1, where p is the re-wiring probability in the WS model. However, when
p=0.3 and 0.5, B decreased and fluctuated more. Figure 9 shows how the average rates
of B, LC, and LN varied with p with which we can investigate the relationship between
the re-wiring probability and the agent’s activity. Note that the WS model generates a regular graph when p=0, whereas it generates a random network when p=1 [22].
The cluster coefficients are small when p>0.1, so the small-world property with a large
cluster coefficient only appears when p≤0.1. Figure 9 indicates that B was around 0.94
when p≤0.1, but as the re-wiring probability increased (p>0.1), cooperation became
weak, and eventually B reached around 0.3, which was smaller than the B of the com-plete graphs (Fig. 3b). This result suggests that cooperation is dominant in WS networks with the small-world property and large-cluster coefficients. Note that B was small in the RG on the WS networks [23].
Figure 10 shows how B, LC , and LD varied with the conversion probability, u, i.e. the probability for converting a potential link to a link [16] in the CNN model, and Fig. 11
shows the same in the BA networks in which we varied m, which is the number of links when a new node is added. These figures indicate that B ranged between 0.6 and 0.8,
0 0.2 0.4 0.6 0.8 1
0 0.2 0.4 0.6 0.8 1
B L L
0 0.2 0.4 0.6 0.8 1
0 0.2 0.4 0.6 0.8 1
B L L
Awareness of articles, S’
Posting rate Posting rate
Upperlimit of normal comment rate, L aL = 0.1 (fixed, RRG) bS’= 1 (fixed, RRG)
N C Nmax
N C
Nmax
and gradually increased with u and m, although LC and LN decreased. The increase in B was due to the existence of hub agents with extremely high degrees: Even if LN is low,
such hub agents receive comments from non-reciprocal agents. Thus, a strategy that
0 0.1 0.2 0.3 0.4 0.5 0.6 0.7 0.8 0.9 1
0 300 600 900 1200 1500
B L L
0 0.1 0.2 0.3 0.4 0.5 0.6 0.7 0.8 0.9 1
0 300 600 900 1200 1500
B L L
ap = 0
C N Posting rate Generation 0 0.1 0.2 0.3 0.4 0.5 0.6 0.7 0.8 0.9 1
0 300 600 900 1200 1500
B L L
Posting rate
Generation
bp = 0.01
C N C N 0 0.1 0.2 0.3 0.4 0.5 0.6 0.7 0.8 0.9 1
0 300 600 900 1200 1500
B L L
Posting rate
Generation
C N
cp = 0.05
0 0.1 0.2 0.3 0.4 0.5 0.6 0.7 0.8 0.9 1
0 300 600 900 1200 1500
B L L
Posting rate
Generation
dp = 0.1
0 0.1 0.2 0.3 0.4 0.5 0.6 0.7 0.8 0.9 1
0 300 600 900 1200 1500
B L L
Posting rate
Generation
ep = 0.3 fp = 0.5
Posting rate
Generation
C N
C N
Fig. 8 Article posting and comment rates in RRG (WS networks)
0 0.2 0.4 0.6 0.8 1
0 0.2 0.4 0.6 0.8 1
B L L
Re-wiring probability, p
Posting rate
N C
makes LC and LN as small as possible is more optimal. However, such cooperation of
hub agents was sustained by the neighbor agents in a non-cooperative strategy. We will discuss this phenomenon in the "Discussion" section.
Stability/instability of agents’ strategies
The most different phenomenon observed in Exps. 1 and 2 was the dispersion of B. For example, B in Figs. 3b and 8e, f were fluctuated although they were the average values of 100 experimental runs. However, B was stable in Fig. 8a–d. The similar dispersion
in B could be seen in CNN and BA networks whereas we do not show the graphs. To
see the changes in the agents’ strategies, we randomly selected one experimental run and plotted the changes in posting rate (Fig. 12). In the RRG on the WS network with p=0.01 , B was almost always larger than 0.9 and seemed stabler than in the other
net-works (Fig. 12a). However, on the WS network with p=0.5, B fluctuated with many
sudden rises and falls (Fig. 12b). These sudden rises and falls appeared when p was around 0.2, and they gradually increased in height and numbers with p. Similar fluctua-tions appeared in the RRG on the CNN and BA networks (Fig. 12c, d) and in the RRG on the complete graph in Exp. 1 (Fig. 4b).
These data indicate that although the average values of B were comparatively a bit higher (around 0.7 and sometimes around 0.8) on the CNN and BA networks, as shown in Figs. 10 and 11, they were unstable; B was stable observed only on the WS networks
0 0.2 0.4 0.6 0.8 1
0 0.2 0.4 0.6 0.8 1
B L L
Conversion probability, u
Posting rate
N C
Fig. 10 Article posting rates in CNN networks together with approximate polynomial curves
0 0.2 0.4 0.6 0.8 1
0 5 10 15 20
B L L
Number of initial links, m
Posting rate
N C
with low p (≤0.1) values. Although the similar stability was observed in the RRG (1.0,
0.1) in the complete graphs (Fig. 6), it had different characteristics; we will discuss this more in the "Discussion" section.
Analysis of reciprocal relationship
To express how many reciprocal neighbor agents and what types of reciprocal structure sustain cooperative behavior in agent networks, we should first intro-duce some notation. For agent i∈A and for the set of i’s reciprocal neighbors Wi ,
we define the number of reciprocal neighbors as ria= |Wi|. There are two types of
reciprocity: Wim= {j∈Wi|i∈Wj} is the set of mutual reciprocal agents of i, and
Wio= {j∈Wi|i�∈Wj} is the set of one-sided reciprocal agents of i. If we express
rmi = |Wim| and rio= |Wio|, ria=rim+rio obviously holds. Furthermore, we will express the average values of these parameters by eliminating the subscript i, e.g. ra=i∈Aria .
Table 3 lists the relationship between the number of reciprocal agents and the network type. Note that the networks in this table have their average degrees equal or close to 20.
The average number of reciprocal agents, ra, in the RRG was small on complete graphs,
CNN networks, BA networks, and WS networks with high p values [marked with an
asterisk (*) in Table 3]. Because LN was small, agents rarely received comments, and they
eventually stopped posting. In this situation, a free rider was the optimal strategy. Nev-ertheless, B remained slightly higher than that on complete graphs (see the "Discussion" section).
On the other hand, the values of ra were around 4 in RRG (0.8, 0.1) on the complete
graphs and in the RRG on the WS networks with a low re-wiring probability, p. These values were not large but large enough to maintain cooperation, i.e. posting articles by
0 0.1 0.2 0.3 0.4 0.5 0.6 0.7 0.8 0.9 1
0 300 600 900 1200 1500
B L L
0 0.1 0.2 0.3 0.4 0.5 0.6 0.7 0.8 0.9 1
0 300 600 900 1200 1500
B L L
0 0.1 0.2 0.3 0.4 0.5 0.6 0.7 0.8 0.9 1
0 300 600 900 1200 1500
B L L
0 0.1 0.2 0.3 0.4 0.5 0.6 0.7 0.8 0.9 1
0 300 600 900 1200 1500
B L L
a WS, p = 0.01
C N
Posting rate
Generation
Posting rate
Generation
b WS, p = 0.5
C N
Posting rate
Generation
C N
c CNN, u = 0.9
Posting rate
Generation
d BA, m = 20
C N
receiving comments. Of course, posting comments also incurred costs, but the agents behaved as free riders on the other non-reciprocal neighbor agents, and in so doing received sufficient rewards. We call such a strategy the half free rider, i.e. be coopera-tive with reciprocal agents, but otherwise behave as a free rider. Half free riders with appropriate numbers of reciprocal agents strike a balance between rewards and costs, and thus are optimal in these environments. A larger ra facilitates comments on articles,
and, thus, it seems to sustain cooperation. However, we also have to consider the cost of commenting; we will discuss this aspect in the next subsection.
The characteristic that distinguishes the WS networks from the complete graphs is the ratio of rm–ra: Table 3 indicates that cooperation was sustained by mostly mutual
reciprocal relationships in RRG (0.8, 0.1) and RRG (1.0, 0.1) on the complete graphs,
but in the RRG on the WS network with p=0.01, it was sustained by both types of
reciprocal relationship. Introduction of S′ and LNmax generated mutual reciprocity, and
RRG (1.0, 0.1) on the BA and CNN networks showed cooperative behaviors and many mutual reciprocal links (the graphs of this experiment are not shown). We will examine the meaning of S′ and L
Nmax in an SNS in the "Discussion" section.
Effect of memory term on cooperation
In the third experiment (Exp. 3), we investigated how the memory term, TW, affected the
agents’ behavior. Figure 13 plots the average posting rates, B, LC, and LN, when TW was
varied from 1 to 20. Here, we could intuitively say that cooperation should be facilitated because agents with a longer memory do not forget past reciprocal behavior. However, Fig. 13 indicates that in RRG (1.0, 0.1) on complete graphs (Fig. 13a) and in the RRG on the WS networks (Fig. 13b), a longer memory negatively affected the evolution of cooperation.
We can think of two reasons for this phenomenon. First, when TW is larger, agents
do not forget the reciprocal behavior of neighbors, so they continue to comment on posted articles for a longer time. However, the opposite phenomenon also occurs. When TW =1, if agent i commented on an article of another agent j but j did not comment
back on an article posted by i, i would eliminate j from Wi. However, when i has a longer
memory, i would continue to consider j to be a reciprocal agent. Then, if j did not com-ment on i’s articles in a few rounds, i would still assume that j is a reciprocal agent. Sec-ond, agent i with a higher ria must engage in costly activity, because LCi>LNi and i has Table 3 Number of reciprocal agents
Network type ra rm ro
Complete graph (RRG)* 1.46 0.61 0.85
Complete graph RRG (0.8, 0.1) 4.65 3.66 0.99
Complete graph RRG (1, 0.1) 17.53 17.48 0.05
WS network (p=0.01, RRG) 3.70 1.41 2.29
WS network (p=0.5, RRG)* 0.34 0.07 0.27
CNN (u=0.9, RRG)* 0.72 0.23 0.49
BA (m=10, RRG)* 0.92 0.35 0.57
to comment on more articles. Agents that did not comment on the posts of others but received comments would have an advantage. This situation continues for longer when TW is large and, thus, is likely to lead to collapse of cooperation. Actually, Fig. 14a, b,
which plots the average number of reciprocal agents versus TW, shows that the number
of reciprocal agents decreased as TW increased because of the increase in cost, although
the larger TW enabled agents to memorize more reciprocal actions by their neighbors.
If we compare Fig. 13a, b, we can see that the WS networks were somewhat robust
to longer memory terms. The same phenomenon is apparent in Fig. 14a, b, which indi-cates that in RRG (1.0, 0.1) on the complete graphs, the number of reciprocal agents, ra, quickly decreased as TW increased. On the other hand, in the RRG on the WS networks
with p=0.01, ra increased when TW=2, 3, and 4 and cooperation was sustained by
both mutual and one-sided reciprocal agents (Fig. 14b). However, the characteristics that were responsible for the robustness to memory in the WS networks are still unknown.
Games on a Facebook network
Finally, we conducted the same experiments using an instance of the Facebook net-work [24] whose features are listed in Table 4. Figure 15 plots the experimental results, while Table 3 lists the number of reciprocal agents in the RRG. Figure 15 indicates that the article posting rate B was around 0.88, which is close to that of the WS networks
0 0.2 0.4 0.6 0.8 1
0 5 10 15 20
B L L
0 0.2 0.4 0.6 0.8 1
0 5 10 15 20
B L L
Posting rate Posting rate
Memory length, T a Complete graph (RRG(1.0, 0.1)) b WS network (p = 0.01, RRG)
N C N
C
W
Memory length, T W
Fig. 13 Relationship between memory term and article posting rates
0 3 6 9 12 15 18
0 5 10 15 20
Reciprocal (r ) Mutual (r ) One-side (r )
0 1 2 3 4 5 6 7
0 5 10 15 20
Reciprocal (r ) Mutual (r ) One-side (r )
Number of reciprocal agents
Memory length, T a Complete graph (RRG(1.0, 0.1)) b WS network (p = 0.01, RRG)
o
W
Memory length, T W a
m
Number of reciprocal agents
o a
m
with p between 0.1 and 0.2, and that it was stable. In addition, the number of recipro-cal agents, ra, in Table 3 was around four and cooperation evolved and was sustained by
both one-sided and mutual reciprocal agents, although ro was slightly larger than rm, as
in the WS networks. This instance of the Facebook network is more complicated than the networks used in Exp. 2, as is shown in Fig. 16, which visualizes it; it seems to con-sist of clusters of communities that have their own sub-structures and a few hub agents. However, our results suggest that the RRG on the Facebook network had characteris-tics similar to those of the RRG on the WS networks with p = 0.1–0.2, and cooperative
behavior was sustained without introducing the parameters for manipulation, S′ and/or
LNmax.
Discussion
Here, let us discuss the experimental results from the viewpoint of an SNS. First, we can say that cooperation did not seem to emerge in the normal RRG on the complete graph, but if we manipulated RRG by introducing the parameters S′ and LNmax, coopera-tion (posting articles) emerged as shown in Figs. 6 and 7. If we look at these figures care-fully, we see that B and LC had similar values, and this indicates that cooperation arose
from LC, i.e. high comment rates by reciprocal agents, mostly mutual reciprocal friends.
For example, cooperation emerged when S′≥0.8 and L
Nmax=0.1, i.e. RRG (0.8, 0.1). LNmax =0.1 means that users did not often comment on the articles if they were posted by non-reciprocal friends, while S′=0.8 means that users had attention to more
than 80% of the posted articles by (reciprocal) users. We believe that this behavior is
Table 4 Network characteristics of Facebook network
Network characteristics Value
Number of users (agents) 4039
Average number of friends (degree) 43.691
Clustering coefficient 0.606
Characteristic path length 3.693
Power-law exponent −1.180
0 0.1 0.2 0.3 0.4 0.5 0.6 0.7 0.8 0.9 1
0 300 600 900 1200 1500
B L L
Generation
Posting rate
N C
reasonable and frequently occurs in actual SNSs. Users behave as half free riders; they receive information (rewards) from non-reciprocal friends, but respond only to informa-tion from reciprocal close friends to sustain SNS (because the articles posted by close friends are likely to be interested). This activity balances rewards and costs in the SNS. Note that the phenomenon described above also occurred in the RRGs on the CNN and BA networks, that is, B and LC became about 1.0 when S′≥0.8 and LNmax=0.1.
On the other hand, even in a normal RRG, cooperation, i.e. posting articles and
com-ments, became the optimal strategy on the WS networks with p≤0.1 and the SNS
seemed thriving. In this condition, WS networks have the properties of small-world and high cluster coefficient. Our experimental results also suggest that the instance of Facebook network that was generated in a bottom-up manner via interaction is likely to maintain cooperation. In addition, its average number of reciprocal agents was higher than those in other networks in the normal RRG. Although this network consists of a few communities, it has also the same properties (Table 4). Therefore, it is possible that these properties foster cooperation, but we need more study to clarify it.
Another implication from our experiments is that the number of reciprocal agents is important because the balance between rewards and costs because of reciprocal rela-tionships strongly affects the agents’ strategies in a normal RRG. Now let us focus on the mutual and one-sided reciprocity in these networks. When TW=1, agents remembered the reciprocal behavior only in the next round, and the number of mutual reciprocal agents, rm, was likely to be small, so ro>rm in the normal RRG (Fig. 14b). However,
when TW≥2, rm and ro had the similar values and they always coexist. This
phenom-enon was also true in the Facebook network. We believe that such a reciprocal structure is common in human society and, thus, observed in the SNSs in the real world. On the other hand, rm≫ro in RRG (1.0, 0.1) on the complete graph; thus, manipulation by S′ and LNmax fostered cooperation by enhancing the effect of mutual reciprocity. This situ-ation corresponds to a dense cluster that becomes active if all users are communicated closely each other.
On the other hand, Figs. 10 and 11 indicate that B in the normal RRG on the CNN and BA networks was larger than that on the complete graphs. This result reflects the
existence of hub agents, i.e. agents that have extremely high degrees. Even on these net-works, just reading articles (acting as a free rider) is optimal. However, a few agents com-ment on articles because of the mutation that corresponds to the vagaries of users. Thus, hub agents receive sufficient comments, have some reciprocal agents, and, thereby, con-tinue posting articles. Because the hub agents earn rewards, their neighbor agents are likely to copy the hub’s gene for the next generation, and consequently B increases to some degree. However, this behavior is, of course, not optimal for non-hub agents; they cannot earn sufficient rewards. Hence, B, LC , and LN stopped increasing in the experi-ments. By contract, the WS networks have no hub agents. Thus, the essential cause of prosperity of the RRG resides in the network structure of the WS networks; this finding is not so obvious and its explanation remains an open problem.
Conclusion
Social networking services are used by users around the world for purposes such as chatting with close friends, exchanging opinions, advertising, marketing, and poli-tics. Although SNSs are usually run by companies and (non-)profit organizations, they depend on their users’ voluntary behaviors such as posting articles and comments. Since such voluntary behavior must incur some cost and effort on the part of the user, it is not obvious what makes them continue to participate in an SNS. Because SNSs have the features of the public goods game, a number of evolutionary game theoretic studies have attempted to understand the mechanism behind cooperation, which corresponds to posting articles in an SNS, by using extending the public goods game in various ways. However, conventional game theoretic models of SNSs ignore reciprocity, even though it plays an important role in evolving cooperation in human society. Thus, in this study, we devised a model, called the reciprocity rewards game (RRG), of an SNS that is based on the public goods game by incorporating direct reciprocity between users into the conventional model. After that, we ran the RRG on a variety of networks to see how reciprocity between users and the network structure affect cooperation. Our experi-mental results indicate that reciprocity in complete networks slightly raises the rate of cooperation, but the rise is not significant. However, if we manipulate the RRG so that users hardly miss any articles posted by their neighbors but at the same time hardly comment on articles posted by non-reciprocal agents, cooperation emerges. Second, in RRGs on WS networks with a low re-wiring probability p, cooperation emerges without any manipulation like in the RRG on the complete graph. We also analyzed the evolved reciprocal structures and the effect of the memory term on cooperation. Finally, using an instance network of Facebook, we conducted the same experiment, and its results indi-cate characteristics similar to those of WS networks with p between 0.1 and 0.2.
We found that a certain network structure facilitates cooperation in an RRG and makes cooperation robust to the memory term, but its essential cause is still unknown: this will be our future work. We also plan to add indirect reciprocity to our model and analyze the relationship between costs and rewards in continuous use of an SNS.
Authors’ contributions
Author details
1 Department of Computer Science and Communications Engineering, Waseda University, 3-4-1 Okubo, Shinjuku,
Tokyo 169-8555, Japan. 2 Graduate School of Engineering, The University of Tokyo, 7-3-1 Hongo, Bunkyo, Tokyo 113-8656,
Japan.
Acknowledgements
This work was in part supported by KAKENHI (25280087). Competing interests
The authors declare that they have no competing interests.
Publisher’s Note
Springer Nature remains neutral with regard to jurisdictional claims in published maps and institutional affiliations.
Received: 5 February 2017 Accepted: 17 May 2017
References
1. Stieglitz S, Dang-Xuan L. Social media and political communication: a social media analytics framework. Soc Netw Anal Min. 2013;3(4):1277–91. doi:10.1007/s13278-012-0079-3.
2. Qasem Z, Jansen M, Hecking T, Hoppe HU. Influential actors detection using attractiveness model in social media networks. In: Cherifi H, Gaito S, Quattrociocchi W, Sala A, editors. Complex networks & their applications V. Proceed-ings of the 5th international workshop on complex networks and their applications (COMPLEX NETWORKS 2016). Cham: Springer; 2017. p. 123–134. doi:10.1007/978-3-319-50901-3_10.
3. Lin H, Fan W, Chau PYK. Determinants of users’ continuance of social networking sites: a self-regulation perspective. Inf Manag. 2014;51(5):595–603. doi:10.1016/j.im.2014.03.010.
4. Karamon J, Matsuo Y, Ishizuka M. Generating useful network-based features for analyzing social networks. In: Pro-ceedings AAAI 2008. 2008; 1162–1168.
5. Saito K, Masuda N. Two types of Twitter users with equally many followers. In: Proceedings of the 2013 IEEE/ACM international conference on advances in social networks analysis and mining. New York: ACM; 2013. p. 1425–1426. 6. Lin K-Y, Lu H-P. Why people use social networking sites: an empirical study integrating network externalities and
motivation theory. Comput Human Behav. 2011;27(3):1152–61. doi:10.1016/j.chb.2010.12.009.
7. Faraj S, Johnson SL. Network exchange patterns in online communities. Organ Sci. 2011;22(6):1464–80. doi:10.1287/ orsc.1100.0600.
8. Toriumi F, Yamamoto H, Okada I. Why do people use social media? Agent-based simulation and population dynam-ics analysis of the evolution of cooperation in social media. In: Proceedings of the 2012 IEEE/WIC/ACM international conferences on web intelligence and intelligent agent technology (WI-IAT), vol. 2. Washington: IEEE Computer Society; 2012. p. 43–50. doi:10.1109/WI-IAT.2012.191.
9. Hirahara Y, Toriumi F, Sugawara T. Evolution of cooperation in SNS-norms game on complex networks and real social networks. In: Aiello LM, McFarland D, editors. Social informatics. SocInfo 2014. Lecture notes in computer science, vol 8851. Cham: Springer; 2014. p. 112–120. doi:10.1007/978-3-319-13734-6_8.
10. Hirahara Y, Toriumi F, Sugawara T. Cooperation-dominant situations in SNS-norms game on complex and Facebook networks. New Gener Comput. 2016;34(3):273–90. doi:10.1007/s00354-016-0305-z.
11. Nowak MA. Five rules for the evolution of cooperation. Science. 2006;314(5805):1560–3.
12. Rand DG, Nowak MA. Human cooperation. Trends Cognit Sci. 2013;17(8):413–25. doi:10.1016/j.tics.2013.06.003. 13. Leider S, Möbius MM, Rosenblat T, Do Q-A. Directed altruism and enforced reciprocity in social networks. Quart J
Econ. 2009;124(4):1815–51.
14. Takano M, Wada K, Fukuda I. Reciprocal altruism-based cooperation in a social network game. CoRR abs/1510.06197; 2015.
15. Watts D, Strogatz S. Collective dynamics of ’small-world’ networks. Nature. 1998;393:440–2.
16. Vázquez A. Growing network with local rules: preferential attachment, clustering hierarchy, and degree correlations. Phys Rev E. 2003;67(5):056194.
17. Barabasi AL, Albert R. Emergence of scaling in random networks. Science. 1999;286:509–12.
18. Surma J. Social exchange in online social networks. The reciprocity phenomenon on Facebook. Comput Commun. 2016;73:342–6. doi:10.1016/j.comcom.2015.06.017.
19. Anderson E. Social media marketing: game theory and the emergence of collaboration. Berlin: Springer; 2010. 20. Axelrod R. An evolutionary approach to norms. Am Polit Sci Rev. 1986;80(4):1095–111.
21. Osaka K, Toriumi F, Sugawara T. Effect of direct reciprocity on continuing prosperity of social networking services. In: Cherifi H, Gaito S, Quattrociocchi W, Sala A, editors. Complex networks & their applications V. Proceedings of the 5th international workshop on complex networks and their applications (COMPLEX NETWORKS 2016). Cham: Springer; 2017. p. 411–22. doi:10.1007/978-3-319-50901-3_33.
22. Newman MEJ. The structure and function of complex networks. SIAM Rev. 2003;45:167–256.
23. Hirahara Y, Toriumi F, Sugawara T. Evolution of cooperation in meta-rewards games on networks of WS and BA mod-els. In: Proceedings of the IEEE/WIC/ACM international joint conference on web intelligence (WI) and intelligent agent technologies (IAT), vol. 3. New York: IEEE; 2013. p. 126–130.