ARTIGO ORIGINAL
Health Inequalities in Diabetes Mellitus and Hypertension:
A Parish Level Study in the Northern Region of Portugal
Desigualdades na Diabetes Mellitus e Hipertensão Arterial:
Um Estudo ao Nível de Freguesia da Região Norte de
Portugal
1. Departament of Social Sciences. Escola Nacional de Saúde Pública. Universidade Nova de Lisboa. Lisboa. Portugal. 2. Health Department. Northern Region Health Administration. Porto. Portugal.
3. Local Health Unit of Matosinhos. Matosinhos. Portugal. Autor correspondente: Teresa Leão. [email protected]
Recebido: 17 de setembro de 2015 - Aceite: 07 de março de 2016 | Copyright © Ordem dos Médicos 2016
Teresa LEÃO1,2,3, Julian PERELMAN1, Manuela FELÍCIO2, Vasco MACHADO2, Graça LIMA2,3
Acta Med Port 2016 Oct;29(10):605-612 ▪ http://dx.doi.org/10.20344/amp.7016
RESUMO
Introdução: A diabetes mellitus e a hipertensão arterial são problemas de saúde de elevada prevalência em Portugal. A sua distri-buição geográfica e social é pouco conhecida, comprometendo o desenho e implementação de políticas de saúde. Assim, este estudo teve como objetivo avaliar a existência das desigualdades socioeconómicas na prevalência de diabetes mellitus tipo 2 e hipertensão arterial, na população residente na região Norte de Portugal, no ano de 2013.
Material e Métodos: Foi realizado um estudo ecológico que analisou as 2 028 freguesias da região Norte. Os dados foram obtidos através do Sistema de Informação das Administrações Regionais de Saúde e do Censos 2011. A associação entre indicadores socio-económicos e prevalência destas doenças foi medida pela diferença de prevalências, risco atribuível populacional, índice relativo de desigualdades e coeficiente de regressão.
Resultados: A prevalência de diabetes mellitus tipo 2 e hipertensão arterial foi de 6,16% e de 19,35%, respetivamente, e variou entre freguesias. A prevalência de ambas as doenças associou-se significativamente com o baixo nível educacional, baixa atividade no sector terciário, desemprego e baixo rendimento (diferença de prevalências entre decis opostos até 1,3% e 5,3%). Os determinantes socioeconómicos foram responsáveis até 20% da prevalência na população.
Discussão: Este tipo de estudo não permitiu a análise de causalidade e poderá ter subestimado as desigualdades socioeconómicas. Contudo, os resultados obtidos alinham-se com a evidência científica internacional.
Conclusão: Estes resultados demonstram a existência de uma distribuição socioeconómica e geográfica heterogénea e a necessi-dade de criação de políticas de saúde que atuem nas freguesias menos favorecidas.
Palavras-chave: Comportamentos Saudáveis; Diabetes Mellitus Tipo 2; Disparidades em Assistência à Saúde; Factores Socio-económicos; Hipertensão Arterial; Portugal.
ABSTRACT
Introduction: Diabetes and hypertension are highly prevalent conditions in Portugal. Little is known about the geographical and social patterning of these diseases, which precludes the design of targeted health policies. This study aimed to measure the geographical and socioeconomic distribution of type 2 diabetes and hypertension prevalence in the population resident in the Northern region of Portugal, for the year 2013.
Material and Methods: An ecological correlation study analyzed the 2,028 parishes of the region. Prevalence data were obtained from the Regional Health Administration information system. Socioeconomic data were also obtained from this administrative database and from the 2011 national census. The association between each socioeconomic indicator and age-standardized prevalence was measured using the difference in prevalence, population attributable risk, relative inequality index, and regression coefficient.
Results: The prevalence of type 2 diabetes and hypertension was 6.16% and 19.35%, respectively, and varied across parishes. These prevalences were significantly associated with low educational level, low tertiary sector weight, unemployment, and low-income rate (with prevalence differences between the most and least advantaged deciles up to 1.3% and 5.3%, respectively). Socioeconomic factors accounted for up to 20% of prevalence.
Discussion: This study design did not allow us to evaluate causality and it may underestimate these diseases prevalence or its association with socioeconomic factors, but its results are in line with the evidence from other countries.
Conclusion: These results emphasize the socioeconomic and geographical patterning of major diseases associated with a high mortality, and the need of health policies targeting the most deprived parishes.
Keywords: Diabetes Mellitus, Type 2; Health Behavior; Healthcare Disparities; Hypertension; Portugal; Socioeconomic Factors.
INTRODUCTION
Socioeconomic (SE) circumstances are major health determinants, influencing populations’ health status across countries, diseases and mortality indicators.1-4 Income, education, living and working conditions, social position and prestige, gender and access to healthcare have been shown to be strongly associated with specific mortality, such as cardiovascular and cerebrovascular mortality, neoplasms,
and even external causes as accidents.1-6 It has been also linked with chronic diseases’ prevalence, such as chronic obstructive pulmonary disease, depression, cardiovascular and cerebrovascular conditions.7
ARTIGO ORIGINAL about inequalities is limited to cardiovascular disease, 13-15 while little is known about T2DM and HBP inequalities and its prevalence distribution at the local level. This lack of knowledge is particularly worrisome, given that DM HBP are two major risk factors for cerebrovascular and cardiovascular disease.16,17 In Portugal, and specifically in the northern region (3.5 million inhabitants), DM and HBP are highly prevalent, being considered critical causes of morbidity and mortality.18-22 At the national and regional level, these diseases are considered health priorities,20-22 reinforcing the relevance of understanding its determinants, distribution and how to draw and implement effective and locally targeted policies and health programs. This study aimed at measuring the geographic and SE patterning of T2DM and HBP prevalence at the smallest area level in the northern region of Portugal, in 2013.
MATERIAL AND METHODS Study sample
An observational transversal ecological study was carried out in order to analyze health and SE data from the smallest administrative area in Portugal (the parish). All the 2,028 parishes of the northern region of Portugal, with an average of 4,000 inhabitants, were studied.
Data sources
Health data was obtained from the health information system of the Regional Administrations of Health (SIARS), for the year of 2013. This system collects information on T2DM and HBP cases (T90 and K86, from the International Classification of Primary Care) and SE data, and it is supplied by general practitioners, nurses and administrative workers’ registries, from the Portuguese Primary Health Care services. The coding for these diseases is compulsory, since it is necessary to include these patients in specific consultations and treatment programs in Primary Care units.23
SE data about low-income rate and health care access were extracted from the SIARS. The low-income rates referred to the rate of patients with income-related exemption of co-payments at the National Health Service (NHS) institutions. Health care access rates were proxied by the rate of patients without an attributed family doctor, which is fundamental to continuity of care and to referral to specialized care. Superior education rates, tertiary sector rates, unemployment rates and bad housing conditions rates were obtained from the 2011 National Census, which is at the moment the most updated and complete population database in Portugal.
Variables
The dependent variables were the DM 2 and HBP prevalence rates. Crude and age-adjusted T2DM and HBP prevalences were calculated per parish and per sex. Age-adjusted prevalences were calculated per SE quintile and decile, for each SE variable.
The independent variables were the SE factors. Several
SE factors were selected accordingly to the literature1,4-15 and to its availability in these data sources. We included variables related to education (analphabetism and superior education), income (low income), employment (unemployment), professional activity (tertiary sector activity), living conditions (bad housing conditions), and health care access (absence of family doctor).
For each SE variable, the parishes were re-coded by quintile (with about 750,000 inhabitants each) and decile (about 350,000 inhabitants each), from the least advantaged parish to the most advantaged.
Data analysis
First, SE and health data variables were mapped per parish of this region, identifying the highest prevalence and least deprived areas in this region.1
Second, we calculated the prevalence differences between the least (1st) and the most advantaged decile (10th), for each SE variable, per sex. This measure allowed to evaluate the width of the differences between the two opposed deciles.
Third, the attributable population risk indicated which proportion of the population with T2DM and HBP might have been caused by SE determinants.
Fourth, the Relative Inequality Index provided information about the ratio of prevalence between the least and the most advantaged deciles, considering population size and relative position of each decile.1,6
Finally, linear regressions were used to calculate the correlation coefficient. It provided the association value and its statistical significance, and it was measured using SE deciles’ age-standardized prevalence.
Confounding was avoided using age-adjusted prevalence, and analyses were performed separately by sex.
Data were analyzed using Microsoft Excel® and STATA®. The mapping of T2DM and HBP prevalence and SE status was done using QGis®.
RESULTS
The mapping of SE variables showed that analphabetism and low income rates were higher in the interior of the region; superior education and tertiary activity rates were higher in district capitals; unemployment, living conditions, and health care access did not follow any rural-urban nor interior-littoral pattern.
ARTIGO ORIGINAL
Figure 1 - Geographical distribution of age-adjusted type 2 diabetes mellitus prevalence in the northern region of Portugal: the prevalence was lower in the parishes filled in lighter colour and higher in those filled in dark orange.
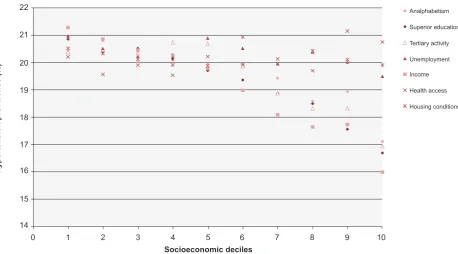
ARTIGO ORIGINAL A negative linear association was observed between SE factors and T2DM and HBP prevalence (Fig.s 3, 4). The T2DM prevalence differences amongst the most and least advantaged deciles were of 1.31% (income), 1.17% (superior education), 0.79% (unemployment), 0.71% (tertiary sector activity), 0.62% (analphabetism), 0.55% (housing conditions), and 0.39% (health care access). The HBP prevalence differences were of 5.31% (income), 4.17% (superior education), 3.45% (tertiary sector activity), 3.32%
(analphabetism), 1.47% (unemployment), 0.6% (housing conditions), and -0.55% (health care access) (Tables 1, 2). The population attributable risk was higher for the income, superior education, analphabetism and tertiary sector activity factors, being respectively responsible for 19.16%, 17.9%, 14.4% and 10.6% of type 2 diabetics in this region. In other terms, these SE factors account for more than 10% of the prevalence of type 2 diabetes. For HBP, the population attributable risk was higher for income (20.91%),
Figure 3 - Age-adjusted type 2 diabetes mellitus prevalence, distributed by socioeconomic decile, composed populational agglomeration of parishes, organized from the least advantaged (1) to the most advantaged socioeconomic determinants (10).
Socioeconomic deciles
Type 2 diabetes mellitus prevalence (%)
0 1 2 3 4 5 6 7 8 9 10
6.5 7.0
6.0
5.5
5.0
4.5
4.0
Analphabetism Superior education Tertiary activity Unemployment Income Health access Housing conditions
Figure 4 - Age-adjusted hypertension prevalence, distributed by socioeconomic decile, composed populational agglomeration of parishes, organized from the least advantaged (1) to the most advantaged socioeconomic determinants (10).
Socioeconomic deciles
Hypertension prevalence (%)
0 1 2 3 4 5 6 7 8 9 10
21 22
20
19
18
16 17
15
14
ARTIGO ORIGINAL superior education (17.4%), tertiary sector activity (16.18%),
and analphabetism (15.35%). Again, these SE factors account for more than 10% of the prevalence of HBP. Except for health care access in HBP, all other SE factors showed a positive attributable risk but of lower importance (Tables 1, 2).
The regression coefficient was negative for all SE variables for T2DM, which confirmed that the higher the SE status, the lower the T2DM prevalence. The regression coefficients were -1.48 (income), -1.18 (superior education), -0.87 (tertiary sector activity), -0.75 (analphabetism), -0.6 (unemployment), -0.2 (health care access), and -0.077 (housing conditions). For HBP the regression coefficients were -5.54 (income), -4.35 (superior education), -3.82 (tertiary sector), -3.16 (analphabetism), -1.05 (unemployment), -0.26 (housing conditions) and 1.01 (health care access). These regression coefficients were statistically significant (p < 0.05) for all SE variables, except
for housing conditions and health care access for both diseases, and for analphabetism for T2DM, for both sexes (Tables 1, 2).
Therefore, income, superior education and tertiary sector activity were the SE variables with the strongest association with T2DM and HBP prevalence. We observed that the least advantaged deciles had a 1.15 – 1.28 percentage point greater T2DM prevalence than advantaged SE groups. HBP prevalence was 1.21 - 1.33 percentage point higher in the least advantaged deciles (Table 1).
Finally, regression coefficients demonstrated that, in both diseases, prevalence differences and relative inequality indexes were greater in women than in men (Tables 1, 2).
DISCUSSION Main results
T2DM and HBP were highly prevalent in the Northern region of Portugal, with 6.16% and 19.35%, and increased
Table 1 - Association between type 2 diabetes mellitus prevalence and socioeconomic status, per sex
Prevalence difference
(%) attributable risk (%)Populational Regression coefficient (CI 95%) Relative Inequality Index
M F MF M F MF M F MF M F MF
Type 2 Diabetes mellitus
Analphabetism -0.25 1.04 0.62 3.51 20.37 14.4 [-1; 0.9]-0.06 [-1.9; -0.3]-1.09* [-1.6; 0.1]-0.749 - 1.21
-Superior education 0.24 1.77 1.17 7.32 25.57 17.9 [-1; 0.4]-0.36 [-2.3; -1]-1.68*** [-1.8; -0.5]-1.18** - 1.36 1.22
Tertiary sector activity 0.57 0.95 0.71 10.04 13.99 10.6 -0.46
[-1; 0.1] [-1.7; -0.6]-1.21** [-1.3; -0.4]-0.87** - 1.24 1.15
Unemployment 0.61 0.94 0.79 8.6 8.6 8.2 -0.38
[-1.1; 0.4] [-1.1; -0.3]-0.74** [-1.1; -0.1]-0.6* - 1.32 1.11
Housing condition 0.46 0.57 0.55 4.99 5.2 5.2 0.005
[-0.76; 0.77] -0.74 [-0.7; 0.55]
-0.077
[-0.72; 0.57] - -
-Income 0.42 1.92 1.31 9.41 27.61 19.16 -0.59
[-1.3; -0.09]
-2.05*** [-2.6 ;-1.5]
-1.48***
[-2; -0.9] - 1.45 1.28
Health care access 0.39 0.53 0.39 5.63 4.41 3.8 [-0.7; 0.8]0.03 [-1; 0.1]-0.44 [-0.8; 0.4]-0.2 - -
-Statistically significant: *p < 0.05, **p < 0.01, ***p < 0.001; CI: Confidence interval; F: Female; M: Male; MF: Both sexes Table 2 - Association between hypertension prevalence and socioeconomic status, per sex
Prevalence difference
(%) attributable risk (%)Populational Regression coefficient (CI 95%) Relative Inequality Index
M F MF M F MF M F MF M F MF
Hypertension
Analphabetism 1.76 4.44 3.32 10.1 18.9 15.35 -1.98**
[-3.2; -0.8] [-5.6; -2.5]-4.08*** [-4.5; -1.8]-3.16** 1.11 1.22 1.18
Superior education 2.18 5.32 4.17 10.44 21.47 17.4 -2.56***
[-3.4; -1.7] [-6.6; -4.3]-5.44*** [-5.3; -3.4]-4.35*** 1.15 1.31 1.25
Tertiary sector activity 2.21 4.56 3.45 12.54 19.58 16.18 -2.5**
[-4.2; -0.8]
-4.94***
[-6.8; -3.05] [-5.5; -2.2]-3.82** 1.14 1.27 1.21
Unemployment 0.83 2.01 1.47 3.7 3.64 3.46 [-1.6; 0.6]-0.5 [-2.3; -0.8]-1.55** [-1.9; -0.2]-1.05* - 1.08 1.05
Housing condition 0.26 0.82 0.60 1.3 1.83 1.4 [-1.14; 1.12]-0.01 [-1.3; 0.4]-0.42 [-1.2; 0.6]-0.26 - -
-Income 3.43 6.63 5.31 15.5 24.65 20.91 [-5.14; -2.98]-4.06*** [-7.8; -5.5]-6.61*** [-6.5; -4.6]-5.54*** 1.25 1.39 1.33
Health care access -0.18 -0.61 -0.55 -0.8 -3.1 -2.75 [-0.3; 2.3]1.01 [-0.2; 1.9]0.88 [-0.1; 2.14]1.01 - -
ARTIGO ORIGINAL with age. These values were lower than the ones stated by the World Health Organization16,17 for the European region, 12% and 36% respectively, but were coincident with the acknowledged prevalence values from Portuguese population studies, such as the numbers presented by the Portuguese Diabetes Society (12.7% of the population had diabetes, only 7.2% diagnosed)18 and by the PAP Study (which admitted that 42.1% of the adults had HBP, but only 19.4% diagnosed).19 To our best knowledge, this study was the first in Portugal to use data from primary care units to measure prevalence. Our findings emphasize that these data, although they do not have the robustness of population studies, constitute reliable epidemiological information to orient policies and establish priorities, with the advantage of being systematically collected at low cost.
The geographical distribution of both diseases prevalence was very heterogeneous. The crude prevalence of T2DM varied more than 20% and the crude prevalence of HBP varied more than 60% among the parishes of the Northern region of Portugal. This discrepancy was in part conditioned by its mean age and was partially attenuated by age-standardization of both prevalences, as expected.16-17 The age-standardized prevalence showed being importantly associated with the SE status of each parish group. Among all SE variables, only the health access and housing conditions variables did not show any statistically significant association with these diseases’ prevalence. Association between health access rates and DM and HBP prevalence might have been limited by the characteristics of the data source: as diagnosis and registration on the information system depends on the health care access, the parishes with lower access would possibly register a lower diagnosed prevalence. Although the literature indicates an association between housing conditions and T2DM and HBP prevalence, this determinant tends to be more significant for mental and respiratory pathologies.1
The other SE variables (education, income, tertiary sector activity, unemployment) showed a strong, statistically significant association with the prevalence of both diseases. This association was consistent across SE indicators and inequality measures, in line with the theory of fundamental causes, since it evidences that SE status influences not only mortality by cardiovascular disease but also multiple disease outcomes and risk factors for disease and death, such as T2DM and HBP.5,24 Many explanations justify this social patterning: the SE status influences the access to resources that can be used to avoid risks, it minimizes the consequences of disease once it occurs, it also influences the population capacity to understand and use health information, and it shapes the attitudes and behaviors towards health. So, SE status is considered an upstream factor, influencing the consumption of tobacco, alcohol and sedentary lifestyle.1 In Portugal, cardiovascular disease, tobacco consumption, obesity and physical inactivity are associated with lower SE status.14,25
Importantly, there was a greater association of SE status and DM and HBP prevalence in females than in males, which
was coincident with the results for cardiovascular diseases’ and diabetes mortality.5,26 So, the health status seems to be more discrepant between opposed SE groups in females than in males, which can have several explanations. First, women from all SE status are more frequent users of health care services,13,26,27 thus being more able to be diagnosed on DM and HBP, and more capable to point out the more realistic health inequalities values in this region. Secondly, women from a higher SE status are usually reported as being more conscious of their health status and engage more in preventive efforts,24 causing educational inequalities in overweight/obesity larger in women than in men, specially in Mediterranean women.26-28
Also, a greater association was measured in HBP than in T2DM, which can be explained by the differences on psychosocial status between opposite SE groups. In fact, HBP is highly vulnerable to psychosocial factors,16,29-31 being a more direct and earlier consequence than T2DM (which pathway seems to be longer, passing through inflammation, oxidative stress and insulin resistance).29
Limitations
We used cross-sectional data so that we were not able to examine causalities, which were however far beyond the scope of this study. Also, its ecological design, using the parish as a study-unit (including around 4,000 inhabitants), does not take into account smaller geographical divisions within geographical areas, possibly biasing our findings (this is a well-known problem of studies using aggregate values). However, it is important to notice that we used areas that are relatively small in size, so that the risk of large heterogeneities is limited; also, the use of aggregate data captures the effect of contextual effects that are also a relevant dimension of inequalities.
An underestimation of diseases’ prevalence could also have been caused by the under-registration on the information system, but DM and HBP are the diseases with best registration practices in this region, due to specific DM and HBP control programs from the Portuguese NHS.23 Also, as most of the population is registered, treated and monitored by the NHS, most diagnosed cases of DM and HBP may be present in these database records. Thus, this health data is considered a valuable proxy of the real prevalence of DM and HBP in this region, since the global number of users and its ages do not present significant differences from the population structure of the 2011 Census, and its health information do not differ much from other population-level based studies.18,19
CONCLUSION
ARTIGO ORIGINAL to 20% of T2DM and HBP prevalence.
This knowledge, and the identification of the least advantaged and highest prevalent areas are fundamental to policy making and to the creation of future interventions, locally, regionally and at the national level, in Portugal. Also, this study alerts policy makers that effective health interventions must take into account SE inequalities. Those interventions that strengthen individuals (empowering them and increasing their health literacy), strengthen communities (building social cohesion, inclusiveness and participation), improve the housing and working conditions, improve access to health and social care, and promote healthy macro-policies, have outcomes not only in the health status of the general population but also in the most deprived groups.1,32-34
Several examples are described in the literature of equity-oriented health policies that can be useful in the Portuguese context. Health projects such as the Project Mura (Slovenia), the Healthy Start (United Kingdom) or the Romsås in Motion (Norway), which address individual factors (nutritional and physical activity education) in low income groups and upstream factors (promoting the local production of healthy food and improving catering in public institutions and the availability and safety of walking trails) may decrease the incidence and prevalence of T2DM and HBP while also tackling health inequalities.34 Also,
the progressive distribution of income and wealth and the investment in services focused in deprived communities are examples of fair policies that act in a macro level, reducing SE and health inequalities.
OBSERVATIONS
Part of the results of this study was presented in the 7th European Public Health Conference, in Glasgow, 19-22th November 2014.
PROTECTION OF HUMANS AND ANIMALS
The authors declare that the procedures were followed according to the regulations established by the Clinical Research and Ethics Committee and to the Helsinki Declaration of the World Medical Association.
DATA CONFIDENTIALITY
The authors declare having followed the protocols in use at their working center regarding patient’s data publication.
CONFLICTS OF INTEREST
The authors declare that there are no conflicts of interest.
FUNDING SOURCES
No subsidies or grants contributed to this work.
REFERENCES
1. Marmot M, Atkinson M, Bell J, Black C, Broadfoot P, Cumberlege J, et al. Fair society, healthy lives: the Marmot review. strategic review of health inequalities in England post-2010. London: Institute of Health Equity; 2010.
2. Leclerc A, Lert F, Goldberg M. Les inégalités sociales devant la mort en Grande-Bretagne et en France. Soc Sci Med. 1984;19:479-87. 3. Smith GD, Bartley M, Blane D. The Black report on socioeconomic
inequalities in health 10 years on. BMJ. 1990;301:373-7.
4. Mackenbach J, Kunst A, Stirbu I, Roskam A, Schaap M, Borrell C, et al. Tackling health inequalities in Europe: an integrated approach. Eurothine. Rotterdam: University Medical Center Rotterdam; 2007. 5. Huisman M, Kunst AE, Bopp M, Borgan JK, Borrell C, Costa G, et al.
Educational inequalities in cause-specific mortality in middle-aged and older men and women in eight western European populations. Lancet. 2005;365:493-500.
6. Mackenbach JP, Stirbu I, Roskam AJ, Schaap MM, Menvielle G, Leinsalu M, et al. Socioeconomic Inequalities in health in 22 European countries. N Engl J Med. 2008;358:2468-81.
7. Dalstra JA, Kunst AE, Borrell C, Breeze E, Cambois E, Costa G, et al. Socioeconomic differences in the prevalence of common chronic diseases: an overview of eight European countries. Int J Epidemiol. 2005;34:316-26.
8. Vargas CM, Ingram DD, Gillum RF. Incidence of hypertension and educational attainment. Am J Epidemiol. 2000;152:272-8.
9. Tyroler HA. SE status in the epidemiology and treatment of hypertension. Hypertension. 1989;13:I-94-9.
10. Gaudemaris R, Lang T, Chatellier G, Larabi L, Maitre A, Diene E, et al. Socioeconomic Inequalities in hypertension prevalence and care. Hypertension. 2002;39:1119-25.
11. Rabi DM, Edwards AL, Southern DA, Svenson LW, Sargious PM, Norton P, et al. Association of socio-economic status with diabetes prevalence and utilization of diabetes care services. BMC Health Serv Res. 2006;6:1-7.
12. Connolly V, Unwin N, Sherriff P, Bilous R, Kelly W. Diabetes prevalence and SE status: a population based study showing increased prevalence of type 2 diabetes mellitus in deprived areas. J Epidemiol Community Health. 2000;54:173-7.
13. Perelman J, Fernandes A, Mateus C. Gender disparities in health and healthcare: results from the Portuguese National Interview Survey. Cadernos Saúde Pública. 2012;28:2339-448.
14. Ribeiro S, Furtado C, Pereira J. Associação das doenças cardiovasculares e o nível socioeconómico em Portugal. Rev Port Cardiol. 2013;32:847-54.
15. Fernandes AP, Perelman J. Desigualdades socioeconómicas em saúde 1987-2006. Dissertação de Mestrado. Lisboa: Universidade Nova de Lisboa; 2013.
16. World Health Organization. A global brief on hypertension. Geneva: WHO; 2013.
17. World Health Organization. Global health risks: mortality and burden of disease attributable to selected major risks. Geneva: WHO; 2009. 18. Correia LG, Boavida JM, Fragoso de Almeida JP, Cardoso SM, Dores
J, Sequeira Duarte J, et al. Diabetes: factos e números 2012 - Relatório Anual do Observatório Nacional de Diabetes. Lisboa: Sociedade Portuguesa de Diabetologia; 2013.
19. Macedo ME, Lima MJ, Silva AO, Alcântara P, Ramalhinho V, Carmona J. Prevalência, conhecimento, tratamento e controlo de hipertensão arterial em Portugal. Estudo PAP. Rev Port Cardiol. 2007;26:21-39. 20. Administração Regional de Saúde do Norte. Plano Regional de Saúde
do Norte 2014-2016: Necessidades Técnicas de Saúde. Porto: ARS; 2013.
21. Administração Regional de Saúde do Norte. Plano Regional de Saúde do Norte 2014-2016: Necessidades Técnicas de Saúde. Porto: ARS; 2013.
22. Machado V, Lima G, Felício M, Teixeira C. Carga Global de Doença na Região Norte de Portugal 2004. Porto: Administração Regional de Saúde do Norte; 2011.
23. Departamentos de Contratualização das Administrações Regionais de Saúde. Bilhete de Identidade dos Indicadores de Monitorização dos Cuidados de Saúde Primários. Lisboa: Ministério da Saúde; 2013. 24. Phelan JC, Link BG, Tehranifar P. Social conditions as fundamental
causes of health inequalities: theory, evidence and policy implications. J Health Soc Behav. 2010;51:S28-40.
ARTIGO ORIGINAL
surveys. BMC Public Health. 2015;15:311.
26. Vandenheede H, Deboosere P, Espelt A, Bopp M, Borrell C, Costa G, et al. Educational inequalities in diabetes mortality across Europe in the 2000s: the interaction with gender. Int J Public Health. 2015;60:401-10. 27. Annandale E. Part II: contemporary health inequalities. The sociology of
health and illness: a critical introduction. Oxford: Blackwell Publishers; 1998. p. 87-192.
28. Roskam AJ, Kunst AE, Van Oyen H, Demarest S, Klumbiene J, Regidor E, et al. Comparative appraisal of educational inequalities in overweight and obesity among adults in 19 European countries. Int J Epidemiol. 2010;39:392-404.
29. Cheung B, Li C. Diabetes and hypertension: Is there a common metabolic pathway? Curr Atheroscler Rep. 2012;14:160-6.
30. Morimoto K, Morikawa M, Kimura H, Ishii N, Takamata A, Hara Y, et al. Mental stress induces sustained elevation of blood pressure and lipid peroxidation in postmenopausal women. Life Sc. 2008;82:99-107. 31. Player MS, King DE, Mainous AG, Geesey ME. Psychosocial factors
and progression from prehypertension to hypertension or coronary heart disease. Ann Fam Med. 2007;5:403-11.
32. Whitehead M. A typology of actions to tackle social inequalities in health. J Epidemiol Community Health. 2007;61:473–8.
33. Commission on Social Determinants of Health. Closing the gap in a generation. Final Report of the Commission on Social Determinants of Health. Geneva: WHO; 2008.