Exploring Fine-Grained Emotion Detection in Tweets
Jasy Liew Suet Yan, Howard R. Turtle
School of Information Studies, Syracuse University
Syracuse, New York, USA
[email protected], [email protected]
Abstract
We examine if common machine learning techniques known to perform well in coarse-grained emotion and sentiment classification can also be applied successfully on a set of fi-ne-grained emotion categories. We first de-scribe the grounded theory approach used to develop a corpus of 5,553 tweets manually annotated with 28 emotion categories. From our preliminary experiments, we have identi-fied two machine learning algorithms that per-form well in this emotion classification task and demonstrated that it is feasible to train classifiers to detect 28 emotion categories without a huge drop in performance compared to coarser-grained classification schemes.
1
Introduction
In sentiment analysis, emotion provides a promis-ing direction for fine-grained analysis of subjective content (Aman & Szpakowicz, 2008; Chaumartin, 2007). Sentiment analysis is mainly focused on de-tecting the subjectivity (objective or subjective) (Wiebe et al., 2004) or semantic orientation (posi-tive or nega(posi-tive) (Agarwal et al., 2011; Kou-loumpis et al., 2011; Pak & Paroubek, 2010; Pang et al., 2002) of a unit of text (i.e., coarse-grained classification schemes) rather than a specific emo-tion. Often times, knowing exactly how one reacts emotionally towards a particular entity, topic or event does matter (Mohammad et al., 2014). For example, while anger and sadness are both nega-tive emotions, distinguishing between them can be important so businesses can filter out angry cus-tomers and respond to them effectively.
Automatic emotion detection on Twitter pre-sents a different set of challenges because tweets exhibit a unique set of characteristics that are not shared by other types of text. Unlike traditional text, tweets consist of short messages expressed within the limit of 140 characters. Due to the length limitation, language used to express emo-tions in tweets differs significantly from that found in longer documents (e.g., blogs, news, and sto-ries). Language use on Twitter is also typically in-formal (Eisenstein, 2013; Baldwin et al., 2013). It is common for abbreviations, acronyms, emoti-cons, unusual orthographic elements, slang, and misspellings to occur in these short messages. On top of that, retweets (i.e., propagating messages of other users), referring to @username when re-sponding to another user’s tweet, and using #hashtags to represent topics are prevalent in tweets. Even though users are restricted to post on-ly 140 characters per tweet, it is not uncommon to find a tweet containing more than one emotion.
Emotion cues are not limited to only emotion words such as happy, amused, sad, miserable, scared, etc. People use a variety of ways to express a wide range of emotions. For instance, a person expressing happiness may use the emotion word “happy” (Example 1), the interjection “woop” (Ex-ample 2), the emoticon “:)” (Ex(Ex-ample 3) or the emoji “😁” (Example 4).
Example 1: “I can now finally say I am at a place in my life where I am happy with who am and the stuff I have coming for me in the future #blessed” [Happiness]
Example 2: “its midnight and i am eating a lion bar woop” [Happiness]
Example 3: “Enjoying a night of #Dexter with @DomoniqueP07 :)” [Happiness]
Example 4: “The wait is almost over LA, will be out in just a little! 😁😁😁😁” [Happiness]
In addition to explicit expressions of emotion, users on Twitter also express their emotions in fig-urative forms through the use of idiomatic expres-sions (Example 5), similes (Example 6), metaphors (Example 7) or other descriptors (Example 8). In these figurative expressions of emotion, each word if treated individually does not directly convey any emotion. When combined together and, depending on the context of use, they act as implicit indicators of emotion. Automatic emotion detectors that rely solely on the recognition of emotion words will likely fail to recognize the emotions conveyed in these examples.
Example 5: “@ter2459 it was!!! I am still on cloud nine! I say and watched them for over two hours. I couldn't leave! They are incredible!” [Happiness]
Example 6: “Getting one of these bad boys in your cereal box and feeling like your day simply could-n't get any better http://t.co/Fae9EjyN61” [Happi-ness]
Example 7: “Loving the #IKEAHomeTour décor #ideas! Between the showroom and the catalog I am in heaven” [Happiness]
Example 8: “I did an adult thing by buying stylish bed sheets and not fucking it up when setting them up. *cracks beer open*” [Happiness]
The occurrence of an emotion word in a tweet does not always indicate the tweeter’s emotion. The emotion word “happy” in Example 9 is not used to describe how the tweeter feels about the tune but is instead used to characterize the affec-tive quality or affecaffec-tive property of the tune (Rus-sell, 2003; Zhang, 2013). The tweeter attributes a happy quality to the tune but is in fact expressing anger towards the “happy” tune. Similarly, #Hap-piness in Example 10 is part of a book’s title so the emotion word hashtag functions as a topic more than an expression or description of an individual’s emotion. The common practice of using emotion word hashtags to retrieve self-annotated examples as ground truth to build emotion classifiers, a method known as “distant supervision” (Hasan et al., 2014; Mohammad, 2012; Mohammad &
Ki-ritchenko, 2014; Wang et al., 2012), is susceptible to this weakness.
Example 9: “@Anjijade I was at this party on the weekend, that happy tune was played endlessly, really not my stuff, it was like the cure's torture ha” [Anger]
Example 10: “Hear Carrie Goodwiler's audition for the audio version of my book #Happiness & Honey on #SoundCloud” [No Emotion]
These challenges associated with detecting fine-grained emotion expressions in tweets remain a virgin territory that has not been thoroughly ex-plored. To start addressing some off these chal-lenges, we present a manually-annotated tweet corpus that captures a diversity of emotion expres-sions at a fine-grained level. We describe the grounded theory approach used to develop a cor-pus of 5,553 tweets manually annotated with 28 emotion categories. The corpus captures a variety of explicit and implicit emotion expressions for these 28 emotion categories, including the exam-ples described above.
Using this carefully curated gold standard cor-pus, we report our preliminary efforts to train and evaluate machine learning models for emotion classification. We examine if common machine learning techniques known to perform well in coarse-grained emotion and sentiment classifica-tion can also be applied successfully on this set of fine-grained emotion categories. The contributions of this paper are two-fold:
a) Identifying machine learning algorithms that generally perform well at classifying the 28 emotion categories in the corpus and compar-ing them to baselines
b) Comparing the machine learning performance of fine-grained to coarse-grained emotion classification
2
Empirical Study
2.1
Corpus(TOPIC: 1310 tweets), sampling using @usernames of US Senators (SEN-USER: 1493 tweets) and sampling using @usernames of aver-age users randomly selected from Twitter (AVG-USER: 1300 tweets). Tweets were sampled from the Twitter API and two publicly available da-tasets: 1) the SemEval 2014 tweet data set (Nakov et al., 2013; Rosenthal et al., 2014), and 2) the 2012 US presidential elections data set (Moham-mad et al., 2014). The proportion of tweets from each of the four samples is roughly balanced.
The corpus was annotated by graduate students who were interested in undertaking the task as part of a class project (e.g., Natural Language Pro-cessing course) or to gain research experience in content analysis (e.g., independent study). A total of 18 annotators worked on the annotation task over a period of ten months. Annotators were first instructed to annotate the valence of a tweet. Emo-tion valence can be positive, negative or neutral. Positive emotions are evoked by events causing one to express pleasure (e.g., happy, relaxed, fasci-nation, love) while negative emotions are evoked by events causing one to express displeasure (e.g., anger, fear, sad). Emotions that were neither posi-tive nor negaposi-tive were considered to be neutral (e.g. surprise). Valence was useful to help annota-tors distinguish between tweets that contained emotion and those that did not.
To uncover a set of emotion categories from the tweets, we used an adapted grounded theory ap-proach developed by Glaser & Strauss (1967) for the purpose of building theory that emerges from the data. Using this approach, annotators were not given a predefined set of labels for emotion catego-ry. Instead, the emotion categories were formed inductively based on the emotion tags or labels suggested by annotators. Annotators were required to identify emotion tag when valence for a tweet was labeled as either “Positive”, “Negative” or “Neutral”. For emotion tag, annotators were in-structed to assign an emotion label that best de-scribed the overall emotion expressed in a tweet. In cases where a tweet contained multiple emotions, annotators were asked to first identify the primary emotion expressed in the tweet, and then also in-clude the other emotions observed.
The annotation task was conducted in an itera-tive fashion. In the first iteration, also referred to as
the training round, all annotators annotated the same sample of 300 tweets from the SEN-USER sample. Annotators were expected to achieve at least 70% pairwise agreement for valence with the primary researcher in order to move forward. The annotators achieved a mean pairwise agreement of 82% with the researcher. Upon passing the training round, annotators were assigned to annotate at least 1,000 tweets from one of the four samples (RAN-DOM, TOPIC, AVG-USER or SEN-USER) in subsequent iterations. Every week, annotators worked independently on annotating a subset of 150 – 200 tweets but met with the researcher in groups to discuss disagreements, and 100% agree-ment for valence and emotion tag was achieved af-ter discussion. In these weekly meetings, the re-searcher also facilitated the discussions among an-notators working on the same sample to merge, remove, and refine suggested emotion tags.
Annotators suggested a total 246 distinct emo-tion tags. To group the emoemo-tion tags into catego-ries, annotators were asked to perform a card sort-ing exercise in different teams to group emotion tags that are variants of the same root word or se-mantically similar into the same category. Annota-tors were divided into 5 teams, and each team re-ceived a pack of 1’ x 5’ cards containing only the emotion tags used by the all members in their re-spective teams. This task organized the emotion tags into 48 emotion categories.
To refine the emotion categories, we collected pleasure and arousal ratings for each emotion cate-gory name from Amazon Mechanical Turk (AMT). Based on 76 usable responses, the emotion catego-ry names were mapped on a two-dimensional plot. Emotion categories that were closely clustered to-gether on the plot and semantically related to one another were further merged resulting in a final set of 28 emotion categories. Finally, all emotion cat-egory labels in the corpus were systematically re-placed by the appropriate 28 emotion category la-bels. Overall, annotators achieved Krippendorff’s α = 0.61 for valence and α = 0.50 for the set of 28 emotion categories. Each tweet was assigned gold labels for valence and emotion category.
2.2
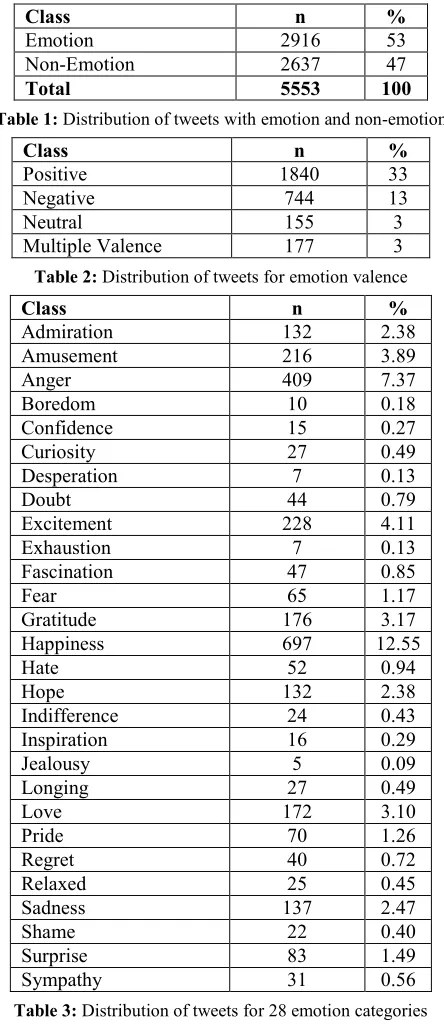
Emotion Distributionsemo-tion/non-emotion, 2) valence, and 3) 28 emotion categories. As shown in Table 1, the overall distri-bution between tweets containing emotion and those that do not is roughly balanced. Slightly over half of the tweets (53%) contain emotion.
Class n %
Emotion 2916 53
Non-Emotion 2637 47
Total 5553 100
Table 1: Distribution of tweets with emotion and non-emotion
Class n %
Positive 1840 33
Negative 744 13
Neutral 155 3
Multiple Valence 177 3 Table 2: Distribution of tweets for emotion valence
Class n %
Admiration 132 2.38
Amusement 216 3.89
Anger 409 7.37
Boredom 10 0.18
Confidence 15 0.27
Curiosity 27 0.49
Desperation 7 0.13
Doubt 44 0.79
Excitement 228 4.11
Exhaustion 7 0.13
Fascination 47 0.85
Fear 65 1.17
Gratitude 176 3.17
Happiness 697 12.55
Hate 52 0.94
Hope 132 2.38
Indifference 24 0.43
Inspiration 16 0.29
Jealousy 5 0.09
Longing 27 0.49
Love 172 3.10
Pride 70 1.26
Regret 40 0.72
Relaxed 25 0.45
Sadness 137 2.47
Shame 22 0.40
Surprise 83 1.49
[image:4.612.75.297.130.642.2]Sympathy 31 0.56
Table 3: Distribution of tweets for 28 emotion categories
The class distribution becomes more unbalanced with the finer-grained emotion classes, valence (Table 2) and 28 emotion categories (Table 3). For valence, 33% of the tweets containing emotion are
positive, 13% are negative and only 3% are neu-tral. Emotion classes become even sparser with the 28 emotion categories. The most frequent category is happiness (13%) while the least frequent catego-ry is jealousy (0.09%).
2.3
Machine Learning ExperimentsWe ran a series of experiments to identify a set of machine learning algorithms that generally per-form well for this task. Four machine learning al-gorithms were found to perform well in this prob-lem space: support vector machines (SVM) (Alm et al., 2005; Aman & Szpakowicz, 2007; Brooks et al., 2013; Cherry et al., 2012), Bayesian networks (Sohn et al., 2012; Strapparava & Mihalcea, 2008), decision trees (Hasan et al., 2014), and k-nearest neighbor (KNN) (Hasan et al., 2014; Holzman & Pottenger, 2003). The features were held constant across different classifiers in the candidate set. As a starting point, a unigram (i.e., bag-of-words) model, which has been shown to work reasonably well for text classification in sentiment analysis (Pang et al., 2002; Salvetti et al., 2006), was cho-sen. Although limited, the unigram bag-of- words features captures not only emotion words but all words in a tweet, thus increasing the likelihood of the classifiers to handle the figurative expressions of emotion.
We tokenized the text in the corpus and extract-ed all unique terms as features. We creatextract-ed a cus-tom tokenizer to better handle elements that are common in tweets. In particular, the tokenizer rec-ognizes emoticons, emojis, URLs and HTML en-coding. The tokenizer also handles common ab-breviations and contractions. Text was encoded in UTF-8 in order to preserve the emojis. We then evaluated the effect of case normalization (i.e, lowercasing), stemming, and a minimum word fre-quency threshold (f = 1, 3, 5 and 10) as a means to reduce the number of features. Classifiers were evaluated using 10-fold cross validation.
one) to distinguish between 29 classes (i.e., 28 emotion categories and no emotion). Second, we ran experiments using Weka’s MultiClassClassifi-er, a meta-classifier that mapped a multi-class da-taset into multiple two-class classifiers (multi-class-binary: one versus all), one for each emotion and one for no emotion, thus resulting in a setup with 29 binary classifiers in total. Unfortunately, the multi-class-binary setup was not designed to handle instances with multiple labels but it offered a straightforward implementation of multiple bina-ry classifications for preliminabina-ry analysis. About 92% of the corpus contained instances with only a single label so overall classification performance is expected to be close to that of a multi-label classi-fier.
3
Evaluation and Results
3.1
Machine Learning AlgorithmsWe found that the use of stemming, case normali-zation and applying a word frequency threshold of 3 produced consistently good results.
Classifier MCS MCB
BayesNet 0.533 0.574
SVM-SMO 0.571 0.529
J48 0.567 0.520
KNN (k = 1) 0.391 0.391 Table 4: Micro-averaged F1 for multi-class-single (MCS) and
multi-class-binary (MCB)
Based on the micro-averaged F1 shown in Table 4, the two machine learning algorithms that yielded the best performance were Sequential Minimal Op-timization (SMO), an algorithm for training SVM (Platt, 1998) and Bayesian Networks (BayesNet) (Bouckaert, 1967). The performance ranking dif-fers slightly between the four machine learning al-gorithms across the two experimental setups with SVM being the top performing classifier in multi-class-single while BayesNet in multi-class-binary. A more in-depth analysis of the best performing classifier for each emotion category also shows that BayesNet and SVM yield the best perfor-mance for over half of the emotion categories.
3.2
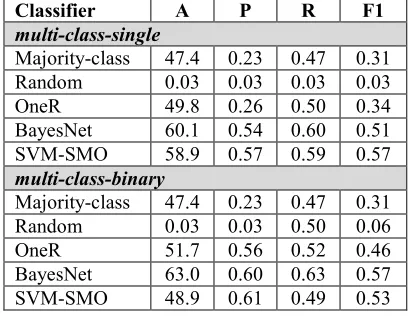
Comparison with BaselinesThree baselines are first established as the basis of comparison for all other classifiers.
Majority-class baseline: The majority-class baseline simply assigns the majority class to each tweet.
Random baseline: The random baseline clas-sifier predicts a label randomly with no learn-ing involved.
OneR: OneR is a simple classifier that uses a single feature with minimum error for classi-fication. The classifier generates a set of rules based on this single feature.
Classifier A P R F1
multi-class-single
Majority-class 47.4 0.23 0.47 0.31 Random 0.03 0.03 0.03 0.03 OneR 49.8 0.26 0.50 0.34 BayesNet 60.1 0.54 0.60 0.51 SVM-SMO 58.9 0.57 0.59 0.57 multi-class-binary
[image:5.612.324.530.200.358.2]Majority-class 47.4 0.23 0.47 0.31 Random 0.03 0.03 0.50 0.06 OneR 51.7 0.56 0.52 0.46 BayesNet 63.0 0.60 0.63 0.57 SVM-SMO 48.9 0.61 0.49 0.53 Table 5: Comparison between best performing models and
baselines (A: Accuracy, P: Precision, R: Recall)
We compare the SVM and BayesNet classifiers to the three baselines as shown in Table 5. In terms of accuracy, SVM and BayesNet outperform the majority-class and random baselines in both multi-class-single and multi-class-binary. BayesNet cor-rectly predicts roughly 60% of the instances while SVM correctly predicts roughly 50%. In terms of F1, SVM and BayesNet exceed the performance of all the three baselines.
3.3
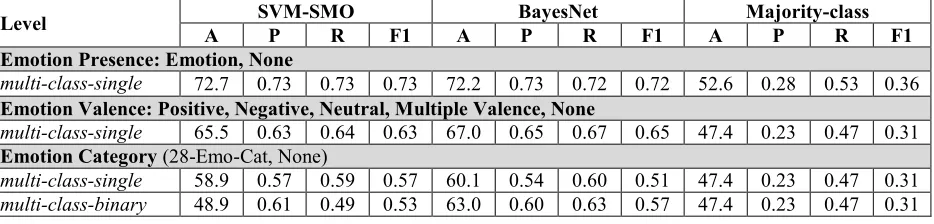
Levels of GranularityLevel A SVM-SMO P R F1 A BayesNet P R F1 A Majority-class P R F1 Emotion Presence: Emotion, None
multi-class-single 72.7 0.73 0.73 0.73 72.2 0.73 0.72 0.72 52.6 0.28 0.53 0.36
Emotion Valence: Positive, Negative, Neutral, Multiple Valence, None
multi-class-single 65.5 0.63 0.64 0.63 67.0 0.65 0.67 0.65 47.4 0.23 0.47 0.31
Emotion Category (28-Emo-Cat, None)
[image:6.612.72.539.64.176.2]multi-class-single 58.9 0.57 0.59 0.57 60.1 0.54 0.60 0.51 47.4 0.23 0.47 0.31 multi-class-binary 48.9 0.61 0.49 0.53 63.0 0.60 0.63 0.57 47.4 0.23 0.47 0.31 Table 6: Accuracy (A), precision (P), recall (R) and F1 across classification schemes with different levels of granularity
Comparing across the three levels of granularity, better performance is observed when there are fewer classes. For example, a classifier trained to distinguish between 2 classes (emotion and none) yields higher performance than a classifier trained to distinguish between 29 classes (28 emotion cat-egories and none). The drop in classifier perfor-mance from coarser to finer levels of granularity is gradual. Note that the performance of a classifier trained to classify 29 classes is not a great deal worse than a classifier dealing with fewer classes (2 or 5). A closer analysis of the F1 per emotion category shows that the classifiers are able to cor-rectly predict some categories better than the oth-ers. For instance, SVM and BayesNet achieve F1 greater than 0.7 for gratitude. The performance measures in Table 6 are micro averages across all classes. The performance results reported here are intended to show a realistic assessment of machine learning performance in classifying the 28 emotion categories that emerged from the open coding task. We included even the poor performing categories in the computation of the micro averages.
4
Discussion and Conclusion
Automatic fine-grained emotion detection is a challenging task but we have demonstrated that it is feasible to train a classifier to perform decently well in classifying as many as 28 emotion catego-ries. Our 28 emotion categories is an extension to the six to eight emotion categories commonly-used in the state-of-the-art (Alm et al., 2005; Aman & Szpakowicz, 2007; Mohammad, 2012). Some of the 28 emotion categories overlap with those found in existing emotion theories such as Plutchik’s (1962) 24 categories on the wheel of emotion and Shaver et al.’s (2001) tree-structured list of emo-tions. Existing emotion theories in psychology are not developed specifically based on emotions
ex-pressed in text. Therefore, our emotion categories offer a more fitting framework for the study of emotion in text.
Existing classifiers achieve only moderate per-formance in detecting emotions in tweets even those trained with a significant amount of data col-lected using distant supervision (Mohammad, 2012; Roberts et al., 2012; Wang et al., 2012). Our preliminary classifiers trained with less data show results that are comparable to existing coarse-grained classifiers. Results from our preliminary machine learning experiments conclude that SVM and BayesNet classifiers produce consistently good performance for fine-grained emotion classifica-tion. Therefore, we plan to continue our machine learning experiment with more sophisticated fea-ture selection strategies, ensemble methods and more balanced training data using both SVM and BayesNet.
There is no stark difference in classifier perfor-mance between fine-grained and coarse-grained emotion classes. Classifiers perform poorly for a handful of emotion categories with very low fre-quency. We will need to generate more positive examples for these classes to improve classifier performance. We plan to add another 10,000 anno-tated tweets in the corpus to increase the size of training and evaluation data. We will make the emotion corpus available in the future.
Acknowledgments
We thank the annotators who volunteered in per-forming the annotation task. We are grateful to Dr. Elizabeth D. Liddy for her insights in the study.
References
Agarwal, A., Xie, B., Vovsha, I., Rambow, O., & Pas-sonneau, R. (2011). Sentiment analysis of Twitter da-ta. In Proceedings of the Workshop on Languages in Social Media (pp. 30–38). Stroudsburg, PA, USA. Alm, C. O., Roth, D., & Sproat, R. (2005). Emotions
from text: Machine learning for text-based emotion prediction. In Proceedings of the Conference on Hu-man Language Technology and Empirical Methods in Natural Language Processing (pp. 579–586). Stroudsburg, PA, USA.
Aman, S., & Szpakowicz, S. (2007). Identifying expres-sions of emotion in text. In Text, Speech and Dia-logue (pp. 196–205).
Aman, S., & Szpakowicz, S. (2008). Using Roget’s the-saurus for fine-grained emotion recognition. In Pro-ceedings of the Third International Joint Conference on Natural Language Processing (pp. 296–302). Baldwin, T., Cook, P., Lui, M., MacKinlay, A., &
Wang, L. (2013). How Noisy Social Media Text, How Diffrnt Social Media Sources? In Proceedings of the 6th International Joint Conference on Natural Language Processing (IJCNLP 2013) (pp. 356–364). Nagoya, Japan.
Bouckaert, R. R. (1967). Bayesian belief networks: From construction to inference. Universiteit Utrecht, Faculteit Wiskunde en Informatica.
Brooks, M., Kuksenok, K., Torkildson, M. K., Perry, D., Robinson, J. J., Scott, T. J., Anicello, O., Zukow-ski, A., Harris, P., & Aragon, C. R. (2013). Statistical affect detection in collaborative chat. Presented at the Conference on Computer Supported Cooperative Work and Social Computing, San Antonio, TX. Chaumartin, F. R. (2007). UPAR7: A knowledge-based
system for headline sentiment tagging. In Proceed-ings of the Fourth International Workshop on Seman-tic Evaluations (SemEval-2007) (pp. 422–425). Cherry, C., Mohammad, S. M., & de Bruijn, B. (2012).
Binary classifiers and latent sequence models for emotion detection in suicide notes. Biomedical In-formatics Insights, 5, 147–154.
Eisenstein, J. (2013). What to do about bad language on the internet. In Proceedings of NAACL-HLT 2013 (pp. 359–369).
Glaser, B. G., & Strauss, A. L. (1967). The discovery of grounded theory: Strategies for qualitative research. Chicago: Aldine.
Hasan, M., Agu, E., & Rundensteiner, E. (2014). Using hashtags as labels for supervised learning of emo-tions in Twitter messages.
Hasan, M., Rundensteiner, E., & Agu, E. (2014). EMOTEX: Detecting emotions in Twitter messages. Presented at the 2014 ASE BIGDA-TA/SOCIALCOM/CYBERSECURITY Conference, Stanford University.
Holzman, L. E., & Pottenger, W. (2003). Classification of emotions in internet chat: An application of ma-chine learning using speech phonemes.
Kouloumpis, E., Wilson, T., & Moore, J. (2011). Twit-ter sentiment analysis: The good the bad and the omg! In Proceedings of the 5th International AAAI Conference on Weblogs and Social Media (ICWSM) (pp. 538–541).
Mohammad, S. M. (2012). #Emotional tweets. In Pro-ceedings of the 1st Joint Conference on Lexical and Computational Semantics (pp. 246–255). Montreal, QC.
Mohammad, S. M., & Kiritchenko, S. (2014). Using hashtags to capture fine emotion categories from tweets. Computational Intelligence, 301-326. Mohammad, S. M., Zhu, X., & Martin, J. (2014).
Se-mantic role labeling of emotions in tweets. In Pro-ceedings of the ACL 2014 Workshop on Computa-tional Approaches to Subjectivity, Sentiment, and So-cial Media (WASSA) (pp. 32–41). Baltimore, MD. Nakov, P., Kozareva, Z., Ritter, A., Rosenthal, S.,
Stoyanov, V., & Wilson, T. (2013). SemEval-2013 task 2: Sentiment analysis in Twitter. In Proceedings of the 7th International Workshop on Semantic Eval-uation (SemEval 2013) (pp. 312–320).
Pak, A., & Paroubek, P. (2010). Twitter as a corpus for sentiment analysis and opinion mining. In Seventh International Conference on Language Resources and Evaluation (LREC) (pp. 1320–1326).
Pang, B., Lee, L., & Vaithyanathan, S. (2002). Thumbs up?: Sentiment classification using machine learning techniques. In Proceedings of the ACL-2002 Confer-ence on Empirical Methods in Natural Language Processing (pp. 79–86). Stroudsburg, PA, USA. Platt, J. C. (1998). Fast Training of Support Vector
Ma-chines Using Sequential Minimal Optimization - Mi-crosoft Research. In Advances in Kernel Methods - Support Vector Learning (pp. 41–65). MIT Press. Plutchik, R. (1962). The Emotions: Facts, theories, and
a new model. New York: Random House.
Rosenthal, S., Nakov, P., Ritter, A., & Stoyanov, V. (2014). Semeval-2014 task 9: Sentiment analysis in Twitter. In Proceedings of the 8th International Workshop on Semantic Evaluation (SemEval 2014) (pp. 73–80). Dublin, Ireland.
Russell, J. A. (2003). Core affect and the psychological construction of emotion. Psychological Review, 110(1), 145–172.
Salvetti, F., Reichenbach, C., & Lewis, S. (2006). Opin-ion polarity identificatOpin-ion of movie reviews. Compu-ting Attitude and Affect in Text: Theory and Applica-tions (pp. 303–316).
Shaver, P., Schwartz, J., Kirson, D., & O’Connor, C. (2001). Emotion knowledge: Further exploration of a prototype approach. In Emotions in Social Psycholo-gy (pp. 26–56). Psychology Press.
Sohn, S., Torii, M., Li, D., Wagholikar, K., Wu, S., & Liu, H. (2012). A hybrid approach to sentiment sen-tence classification in suicide notes. Biomedical In-formatics Insights, 5(Suppl. 1), 43–50.
Strapparava, C., & Mihalcea, R. (2008). Learning to identify emotions in text. In Proceedings of the 2008 ACM Symposium on Applied Computing (pp. 1556– 1560). New York, USA.
Wang, W., Chen, L., Thirunarayan, K., & Sheth, A. P. (2012). Harnessing Twitter “big data” for automatic emotion identification. In 2012 International Confer-ence on Privacy, Security, Risk and Trust, and 2012 International Conference on Social Computing (pp. 587–592).
Wiebe, J. M., Wilson, T., Bruce, R., Bell, M., & Martin, M. (2004). Learning subjective language. Computa-tional Linguistics, 30(3), 277–308.