Journal of Electrical Engineering,
Electronics, Control and Computer Science –
JEEECCS, Volume 4, Issue 12, pages 1-8, 2018
Signal Processing and Analysis Methods in
Nuclear Quadrupole Resonance Spectroscopy
Cristian Monea
Research & Development Department Mira Technologies Group
Otopeni, Romania [email protected]
Abstract – The purpose of this paper is to review the signal processing and analysis methods applied in nuclear quadrupole resonance (NQR) spectroscopy. NQR is a radio frequency spectroscopic technique used for detecting solid state compounds containing quadrupolar nuclei, in applications ranging from chemical analysis to explosive and drugs detection. This paper presents the principle of NQR, its applications, the detection methods and an overview of the research done in the field of signal processing and analysis using this technique. Different solutions are described, starting from the techniques developed initially up to state-of-the-art detection algorithms. These are presented in chronological order, also discussing their principles, advantages and disadvantages. This paper proposes several directions for future research and suggests machine learning as a next step in NQR signal analysis.
Keywords-NQR; spectroscopy; signal processing; analysis; detection algorithm;machine learning
I. INTRODUCTION
Nuclear quadrupole resonance (NQR) is a solid-state radio frequency (RF) spectroscopy technique used in chemical analysis. It was first observed in 1949, by H. Dehmelt and H. Krüger [1] and is similar to nuclear magnetic resonance (NMR), with the difference that it does not require an external magnetic field. For this reason, NQR is also called zero-field NMR.
NQR is manifested in powder or crystalline substances made out of atoms with quadrupolar nuclei, i.e. with spin number at least ½. By having a non-spherical electrical charge distribution, these atoms exhibit an electric quadrupole moment which can interact with an external electric-field gradient to create distinct energy states. There are many isotopes that possess quadrupole moments, such as: 14N, 35Cl,
17
O, 27Al etc. Substances that contain these isotopes can be analyzed using NQR spectroscopy, which opens up this technique to a range of applications. Since many explosive and drugs contain the isotope
14
N, one of its most appealing applications is the detection of dangerous and contraband substances. NQR is very sensitive to the electron distribution and molecular structure (chemical environment), thus allowing for very precise measurements. There are over 10000 substances investigated up to this date
using NQR spectroscopy and no two substances have been found with the same resonance frequency [2].
One of the characteristics of NQR is that the substance response signal is very weak, with magnitude order of tens of nV, comparable with the probe’s thermal noise level, thus being very susceptible to radio frequency interference and spurious signals such as piezoelectric and magneto-acoustic responses. As a result, the detection and signal processing methods focus on differentiating the useful signal from environmental and electronic noise, as well as maximizing the substance response signal.
The detection methods applied in NQR range from direct (pure) detection, including continuous-wave, superregenerative and pulsed methods, to indirect detection using double resonance, cross-relaxation, polarization and superconducting quantum interference device (SQUID). Depending on the volume of the object analyzed, which can be a laboratory probe, a parcel or even a luggage, the substance analyzed and measurement conditions, these employ excitation powers ranging from mW to kW. Special care is taken to switch from high power emission (excitation) to very low signal reception (detection).
The signal processing methods used in NQR aim to increase the signal-to-noise ratio (SNR). They imply pre-processing techniques to improve the extremely weak raw signal, i.e. the signal response, quadrature detection technique, adaptive cancellation algorithms to reduce the background noise, matched filters, spectral estimation and even neural networks. These will be detailed in the following chapters.
II. NQRPRINCIPLE AND APPLICATIONS
.
The electric moment appears in nuclei with spin number at least ½. Figure 1. shows the sign of Q depending on the charge distribution in the nucleus.
Figure 1. Electric quadrupole moment sign based on the charge
distribution in the nucleus [3]
In the figure above, zn is the axis of symmetry of
the nucleus (spin), and rn is the direction perpendicular
to zn. The electric quadrupole moment can interact
with an external EFG to create distinct energy states. Transitions among the various states can be excited by RF pulses whose frequency matches the energy difference between two different states. Three possible transitions between the energy states are possible, corresponding to three NQR resonant frequencies, denoted ν0, ν- and ν+ [4]. As a result, NQR can be
defined as a process of RF resonance, consisting in absorption and emission of electromagnetic energy. In gaseous and liquid phases, these transitions become averaged to zero, so NQR can only be used on solids (including powders, crystals).
There are many isotopes that possess quadrupole moments, such as: 14N, 35Cl, 63Cu, 65Cu, 17O, 59Co,
47
Ti, 49Ti, 55Mn, 27Al, 115I, 71Ga etc. Substances which contain these isotopes can be analyzed using NQR spectroscopy.
The resonance frequencies are very sensitive to the electron distribution and molecular structure (chemical environment), allowing for very precise measurements. There are over 10000 substances investigated up to this date and each has been found with unique resonance frequencies [2] (RF “fingerprints”). In case of complex substances which have multiple molecules on the crystal lattice, each molecule with its own resonant frequency, these can respond to more than 3 frequencies. E.g., TNT has over 30 resonance frequencies [4]. However, the resonant frequencies are highly dependent on temperature.
The NQR response signal is generated by the spin precession of the nuclei after excitation with an RF signal. Figure 2. illustrates the NQR signal excitation.
Figure 2. NQR excitation [4]
The excitation signal is usually a high-power pulse sequence which drives a coil surrounding the
substance measured. This generates a magnetic field that tilts the spins of the nuclei. When reverting to equilibrium, these emit a decaying signal, also known as free induction decay (FID), which can be captured by the same coil. The excitation and FID signal are illustrated in Figure 3.
Figure 3. FID signal [4]
The time required to return to equilibrium, also called spin–lattice relaxation time, is denoted T1 and
ranges from ms to tens of s. The time constant for FID decaying is T2 and its effective value, T
*
2, ranges from
µs to ms. In order to obtain a stronger response, most excitation sequences focus on generating echo signals, which appear on excitation with successive pulses of different durations. The echo train decay time, also called spin–spin relaxation time, is denoted T2 and its
effective value, T2e, ranges from tens of ms to several
s, being longer than T*2. These parameters, along with
the excitation power, have to be taken seriously into consideration when choosing the detection technique and are specific for each substance.
Due to its high specificity, one of the most important applications of NQR is chemical analysis. Since many explosive and drugs contain the isotope
14
N, another application is the detection of dangerous and contraband substances (baggage scanning, landmine detection). Other applications domains include: pharmaceutical analysis [5], mineral analysis, oil drilling and geothermal heat drilling, temperature measurement [6].
III. NQRDETECTION METHODS
There are several excitation methods used to obtain an NQR response signal from the substance investigated. All of them consist in emitting electromagnetic energy towards the substance, which can be a pulse sequence or continuous wave.
A. Direct Detection
.
Pulsed-based methods are widely used, because they permit better sensitivity [6]. They consist in emitting a train of impulses and summing the FID response after each pulse. SNR is directly proportional with the square root of the number of pulses (scans), and the time between scans is at least T1. Sensitivity is
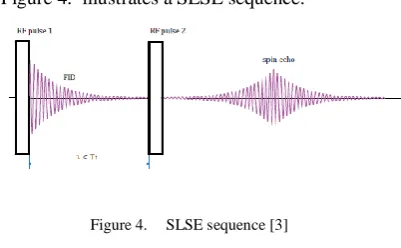
increased and scan time is reduced by the use of multi-pulse sequences, initially developed for NMR. These are divided in: spin-locking multi-pulse (SLMP) sequences (also called spin-locked spin echo – SLSE) and steady-state free precession (SSFP).
SLSE sequences imply excitation of the substance before returning to equilibrium, producing echo signals (spin echo). These sequences are expressed as:
θφ1 ‒ (τ ‒ θφ2 ‒ τ) N, (1)
where τ is half of the pulse repetition time, φ1 is the
first (or preparatory) pulse phase, φ2 is the phase of the
other pulses, θ is the rotation angle of the spins (directly related with pulse duration), and N is the scan number (number of pulses in the sequence).
Figure 4. illustrates a SLSE sequence.
Figure 4. SLSE sequence [3]
These types of sequences are adequate for substances with T1 greater than the detection time.
SSFP sequences use equally spaced pulses and with the same duration to maintain the substance in a steady-state (different from equilibrium), thus responding with a continuous signal of varying amplitude. These are adequate for substances with short T1. SSFP sequences are expressed as:
(τ ‒ θφ ‒ τ) N, (2)
where φ is the first (or preparatory) pulse phase. The parameters of multipulse techniques (i.e. τ, θ, N) need to be fined tuned for each substance type in order to obtain maximum response. Also, there are many variations of these multipulse sequences that are developed for specific types of substances and applications: SE, CP, CPMG, QCPMG, WURST-QCPMG, PAPS, NPAPS, SORC etc. Pulse sequences have even been developed to reduce spurious signals, such as piezoelectric and magneto-acoustic responses [7].
B. Indirect Detection
The second method is indirect detection and is used to complement the first technique for substances with low intensity response, especially if the resonance frequency is below 1 MHz. This is subdivided in:
double resonance, cross-relaxation, polarization and superconducting quantum interference device (SQUID).
Double resonance is used on substances with two types of nuclei, one of them having a strong response. It focuses on detecting the weak response when observing changes in the stronger one. Cross-relaxation is similar to double resonance method, but further applies an external DC magnetic field. The polarization method uses an external static magnetic field before applying the excitation sequence, in order to maximize the response. The use of superconducting quantum interference device (SQUID) based amplifiers permits detection of weak responses at low frequencies but requires special equipment.
IV. NQRSIGNAL PROCESSING AND ANALYSIS
METHODS
There are many signal processing techniques proposed over time and these can be classified into several categories: classical NQR (cNQR), stochastic NQR (sNQR), single sensor, multi-sensor, pre-processing, post-pre-processing, CW NQR, pulsed NQR. cNQR techniques process the signal obtained using high power RF pulses, whereas sNQR process the signal resulting from trains of low power pulses with randomized phases and amplitudes [9]. Single sensor algorithms focus on systems with one transmission-reception coil/antenna, whereas multi-sensor techniques are used in detectors based on spatial diversity (multi-channel detection using multiple antennas for better interference rejection) [10]. Pre-processing techniques aim to improve the signal as it is acquired, while post-processing methods work with signal obtained after pre-processing. CW and pulsed NQR methods focus on the signal obtained using these two methods, respectively. For clarity in presenting the signal processing techniques, these will be divided in pre- and post-processing methods.
A. Pre-Processing Methods
The main disadvantage of NQR is the very low SNR. Consequently, the challenges for NQR signal processing methods are to reduce RFI (due to radio transmissions and electronic devices) and to extract the substance response from noise [13].
Basically, in either CW or pulsed NQR, the response signal is digitized using an ADC and then processed. The signal can be detected using the known NQR resonance frequency (quadrature detection approach) or can be acquired as is (raw signal approach).
.
relatively large T1. This is due to the fact that one
needs to wait up to 5T1 between scans for the
substance to properly return to equilibrium state (reaching full relaxation) [3].
The quadrature detection approach is another pre-processing solution which was initially utilized in NMR, using two receiver coils. It has the advantages of increasing SNR with the square root of 2 [12] and allowing to observe the response’s frequency deviation. It is illustrated in Figure 5.
Figure 5. Quadrature detection [11]
Quadrature detection takes the substance response signal (FID or spin-echo) and mixes it with the receiver sine and cosine waveforms to create the real and imaginary data which, after low pass filtering, become the I and Q channels. After phase detection, these can be further passed to a signal averaging block. When processed using fast-Fourier transform (FFT) these allow one to distinguish the negative and positive frequencies relative to the carrier frequency, i.e. the frequency deviation of the substance response relative to the excitation frequency. However, if only one coil is used, the SNR remains the same [12].
SNR is further improved by using multi-pulse sequences together with better post-processing signal detection techniques.
In [4], RFI is mitigated using a custom designed analog domain adaptive filter, with a new weight-updating circuit with DC offset cancellation. This is used together with a digital signal processing platform.
B. Post-Processing Methods
As previously mentioned, the NQR response amplitude strongly depends on the excitation sequence parameters (amplitude, frequency – also dependent on sample temperature – duration and repetition rate) which need to be fined tuned for each type of substance in order to achieve an optimal signal. This can be a time-consuming task, especially if no data is available for the substance analyzed. This situation is addressed in [14] where a feedback control algorithm is used to adjust in real-time the excitation pulse parameters, i.e. width and offset frequency to increase the SNR and probability of detection (Pd). This
method is also useful in experiments where noise is correlated or when averaging limited data.
The same algorithm is proposed in [15] for detecting buried mines. A strong off-resonant comb sequence (SORC) is used for excitation and the algorithm automatically optimizes the pulse width by adjusting a performance index. This is represented by
the peak-to-peak value of the average of N responses obtained with a fixed pulse width. It is maximized using the gradient method of steepest ascent [15].
In [16] an energy detector is used, which converts the received signal to frequency domain and checks if the power of the frequency of interest exceeds a predefined threshold [13]. Several detection algorithms based on power spectrum estimation are investigated. In particular, discrete Fourier transform (DFT), the periodogram, an autoregressive (AR) algorithm using four different approaches (Yule-Walker, covariance, Burg and modified covariance), and also, the MUSIC spectral estimator. However, these methods are adequate only for high SNR [13].
Tantum et al. have proposed the use of a Bayesian algorithm to improve the very low SNR in case of TNT landmine detection and an adaptive noise cancellation algorithm (ANC) for RFI mitigation [17]. The Bayesian approach uses statistical data of the substance response and noise, and takes the decision based on a likelihood ratio. However, it requires previous knowledge of mean and covariance of the data in both hypotheses (mine present and mine absent), which is acquired using 50 training sets [17]. The ANC is done using a 2-tap normalized least mean squares (NLMS) filter and the noise is captured using one or more antennas. Filtering is done in the frequency domain. The Bayesian detector processes the output of the adaptive filter. The disadvantage of this method is that it cannot adapt to environment changes which result in nonstationary noise statistics. Also, it can amplify the white noise and it may suffer from signal cancellation due to minimizing the total output power [22].
In [18], Tan et al. present TNT landmine detection using the LMS algorithm to reduce RFI and a power spectral estimation technique to identify the response peak. Figure 6. shows the adaptive noise canceller diagram.
Figure 6. Adaptive noise canceller in NQR detection [18]
. The previous works assume that the noise has a white Gaussian distribution. Tan et al. take a step further in [19], by considering the RFI to have a non-Gaussian colored distribution, which is unavoidable in field conditions. They propose the Cramer–Rao lower bound for estimating the NQR signal based on the statistical model of RFI.
The same authors propose in [20] the use of a Kalman filter to detect the presence of the substance response in the post-RFI mitigation signal. They investigate a two-step adaptive Kalman filter on simulated and real data, in both direct estimation (i.e., the system state is represented by the NQR signal to be estimated), and also in indirect estimation configurations (i.e., the system state is the equal to the background noise and the response is considered the observation noise). In case of direct estimation, several filters are investigated. Figure 7. shows the direct estimation results achieved for simulated data in all configurations investigated: without filter (pre KF), with conventional filter (post conKF), with filter for colored noise (post arbKF) and with filter having an autoregressive model for colored noise (post extKF). The model variance is indicated by Q and is the same for all traces. As seen in the plot, the best performance is achieved using the latter filter. The drawback of this method is that it requires training data for estimating the coefficient and covariance matrices [20], which may not be available in real application.
Figure 7. Direct Kalman estimation results [20]
In [21], Liu et al. suggest exploiting both the spatial and temporal correlations of the RFI in order to improve detection of TNT landmines. The RFI is captured using a secondary antenna array. They propose several methods for RFI suppression, such as: alternating least squares (ALS) and doubly constrained robust Capon beamformer (DCRCB).
In [22] several detection algorithms are investigated. For single sensor applications, robust generalized Capon (RGC) and approximate robust RGC are found better than non-adaptive least-squares (LS) method. For multi-sensor applications, several adaptive beamforming methods are proposed to mitigate the RFI.
Stegenga investigates in [23], the matched filter (MF), maximum entropy (ME) and Bayesian methods. The latter is found to be the most robust against noise, but it requires a priori information. The maximum entropy method is observed to be the most computationally intensive.
NQR has the drawback that the substance response frequency is strongly dependent on its temperature. Jakobsson et al. propose an approximate maximum likelihood (AML) to exploit this dependency as a way to enhance the SNR [24]. Basically, this algorithm matches the measured spectral lines (whose temperature dependence is known) with the estimated model data, evaluating the peak corresponding to the temperature that gives the best match. However, it requires an estimated noise model which is obtained using a nonlinear least squares method.
In [25], the authors extend the previously presented algorithm to a frequency selective AML detector (FSAML). It has the advantages that it works with a subset of the available frequencies, making it more robust to narrow-band RFI, and is less computationally intensive.
As previously mentioned, in order to increase SNR, the data captured after each excitation pulse is averaged. Somasundaram et al. propose in [26] that the individual received responses be processed as a sequence, instead of averaging them, thus exploiting the decaying characteristic of each spin echo. Hence, the raw signal train without averaging is utilized. The echo train variants, ETAML and FETAML, of the previous algorithms are investigated for TNT detection. The authors report increased Pd, even in
cases where the sample temperature is unknown.
In [27], Somasundaram et al. approach stochastic NQR detection, by introducing a new data model and investigating two detection schemes. According to [10], “in sNQR, only a very small amount of the data contains the FID, the rest can be considered secondary data; in cNQR, secondary data can be acquired by continuing the measurement after the pulsing has ceased. This information is used to construct an interference subspace, to which the signal is then projected orthogonally, removing the RFI components.” In [27], the projection algorithm used is called Subspace-based EvaluAtion of Quadrupole resonance signals Exploiting Robust methods (SEAQUER), which has the limitation that it does not perform well on a mixed response (e.g., generated by different polymorphic forms of the same substance) [10]. The other algorithm investigated in [27] is robust correlation domain approximate maximum likelihood (RCDAML), which uses the correlation domain samples known not to contain NQR components, denoted signal-of-interest (SOI) free samples, “to obtain an estimate of the noise covariance matrix, and then use this to prewhiten any unknown noise coloring” [27]. Prewhitening is used to filter out background noise from NQR data [40].
least squares (NLS) detector, frequency-selective multichannel (FSMC) method and exploiting spatial diversity and polymorphism in robust estimation algorithm (ESPIRE). Since the other algorithms required that the relative amplitude of the spectral lines is known a priori, ESPIRE is proposed as a solution to provide robustness to uncertainties in the assumed amplitudes, which is the case in real applications.
This line of research is continued in [29], where they improve the methods to be more robust against uncertain amplitudes. The least squares ETAML (LSETAML) and robust (or constrained least squares) ETAML (RETAML) detectors are proposed, as well as their frequency selective versions (FLSETAML and FRETAML). LSETAML has the advantage that it does not require a priori information, but this can be a drawback if uncertainty is low. RETAML, however, requires a priori information. Their frequency selective versions offer the advantages of being less computationally intensive and having better results.
Jakobsson and Butt also propose, in [35], an improvement for the ESPIRE algorithm, considering that it does not perform well in the presence of temporally correlated noise. The new algorithm, called noise and RFI removal for detection in QR applications (NORRDIQ), cancels temporally correlated interference from the data before ML estimates are calculated.
They propose in [30], that the noise and SOI samples be captured sequentially, using the same cNQR excitation sequence. Thus, two scans are needed, in the presence and absence of the sample, respectively. The SOI data set contains the sample response plus noise, whereas the other data set (acquired either before or after capturing the SOI data), contains only the noise. The noise-only data is then subtracted from the SOI data to remove RFI. However, this solution cannot be used in applications where long scanning time is not acceptable.
Niu et al. propose in [34], a generalized matched filter approach to enhance detection. An autoregressive method is utilized for estimating the power spectrum of background noise and a generalized matched filter, formed by combining a prewhitening filter with a matched filter, is used for detection.
Gudmundson et al. have developed an ESPRIT-based estimator, together with the corresponding Cramer-Rao lower bound, for spin echoes resulting in SLMP experiments [36].
A signal processing solution for CW measurements is presented in [44]. It proposes a phase altering operation to remove artifacts of phase differences in the reference. Also, the mean value of the signal in case sample absence is subtracted from the mean value of the signal in case of sample presence.
In [33], Swärd and Jakobsson proposes the algorithm called Estimation of Phase and amplitude for Interference Cancellation (EPIC). It estimates the stationary RFI components present in both primary
(that includes SOI) and secondary data sets (noise-only). This has the advantage that it can also be used in cases when the interference is overlapping the SOI.
A single sensor algorithm for cancelling strong stationary and non-stationary interference in landmine detection has been developed in [37]. The interference cancelation AML (ICAML) method estimates the entire RFI data using Fourier and wavelet analysis. Compared with the frequency selective algorithm presented before, this technique can also reduce noise overlapping the SOI.
Mozzhukhin et al. utilize in [38], the continuous wavelet transformation on the response signal and a pattern (reference) signal constructed from known parameters (relaxation values, line width and waveform). The mutual wavelet spectrum is determined and used for detecting the presence of the NQR response.
In [39], a multi-sensor (or multi-channel) version of the EPIC algorithm is investigated for landmine detection. Denoted dual-channel EPIC (DEPIC), it measures the interference on the secondary channel and subtracts the estimated values from the primary channel.
Hemnani et al. investigate in [41], two adaptive filtering techniques, ANC and adaptive line enhancement (ALE), together with wavelet transform, showing that ALE enables better and faster detection.
In [42] a new algorithm is developed to detect the NQR signal in case of severe interference, without requiring secondary data for obtaining prior knowledge about the RFI. The interference cancelation ETAML (ICETAML) method firstly cancels interference in the acquired data, then applies the ETAML algorithm. It is shown to have excellent performance [42]. The frequency selective version (ICFETAML) is also investigated and it is shown that it has no advantages over ICETAML.
A different approach is researched in [43], where neural networks (NN) are used to detect the sNQR response. Several algorithms are investigated: AML, FSAML and feedforward NN. The later was shown to have good performance if the NQR response parameters are within certain ranges.
NQR signal pattern recognition is investigated in [3], for ammonium nitrate landmine detection. Several signal features are extracted from the response: spectral magnitude at reference frequency, sum of spectral intensities in the frequency ranges of interest, frequency of the highest peak in the frequency range of interest, frequency and spectral intensity of the peak closer to the reference frequency and others. These are fed to a classifier to produce the detection result. The following classifiers are studied: naïve Bayes, k-nearest neighbors (k-NN), support vector machine (SVM), 2-layer neural network and a combination of the previous ones.
C. Future Research
applications, as well as machine learning (ML) techniques for signal analysis.
ML is currently a very active research topic which finds applications in multiple domains. According to ScienceDirect, thousands of articles on ML have been published in the last few years, as follows: 2013 (8643), 2014 (9936), 2015 (12398), 2016 (13770), 2017 (16082) [46]. As observed, the topic is heavily researched and the interest for it is rising yearly.
There are tens of algorithms developed for ML, the most efficient being those with deep architectures (deep learning techniques): deep neural networks (DNN), deep belief networks (DBN), autoencoders, convolutional neural networks (CNN), recurrent neural networks (RNN) and others [48]. New and more performant algorithms appear every year, some of the most notable being: LeNet, AlexNet, VGG, GoogLeNet, ResNet [47]. E.g., the latter has achieved better image recognition than a human expert [47].
Machine learning (deep learning) offers many advantages, such as new features generation and unsupervised learning [51]. In particular, it is useful for analyzing signals in low SNR scenarios, as it is the case for NQR, and it has been shown to perform well in signal recognition applications [49].
ML was approached in NQR [3], but the algorithms used represent only a subset of it and have been replaced by recent proposals, as mentioned above. The fusion of several algorithms together with better feature extraction techniques can provide very good results in NQR signal analysis. In [45] a machine learning solution was developed for NMR. Although it is not applied in NQR, a similar approach can be developed here also.
CONCLUSION
In this paper, the NQR principle was described, as well as its applications. The detection methods were presented, classified in direct and indirect methods. The challenges that signal processing algorithms must overcome have been stated and the algorithms were described, classified in pre- and post-processing methods. These were presented in a chronological order, starting from the techniques initially used up to state-of-the-art detection algorithms. Their principles, advantages and disadvantages are discussed.
As seen, the first detectors were FFT-based. A major contribution was given by the use of the adaptive noise cancellation algorithms for RFI mitigation. Another step further was made by the use of spectral estimation techniques complementary to the aforementioned algorithms. The spectral estimation detectors offered the advantage of detection in cases were the spectral peak is covered by noise, whereas the first detectors could only identify the response signal if the peak rose from the noise floor. Another major contribution was the use of pattern recognition techniques for signal detection. Coupled with efficient features extraction and other signal processing techniques (e.g., wavelet transform, spectral estimation), these can provide good results in severe RFI conditions.
Finally, an analysis on future research opportunities is presented and several directions are proposed. Machine learning has not been properly investigated in the field of NQR signal analysis and it is suggested as a next research step.
REFERENCES
[1] H. Dehmelt, H. Krüger, “Pure quadrupole resonance in
solids,” Naturwissenschaften, vol. 37, p. 111, 1950.
[2] H. Chihara, N. Nakamura, Nuclear Quadrupole Resonance
Spectroscopy Data, Applied Spectroscopy, Springer-Verlag Berlin Heidelberg, 1997.
[3] L. R. Cardona, “Nuclear quadrupole resonance system for
landmine detection in Antioquia,” Ph.D. thesis, National University of Colombia, 2017.
[4] Z. Xinwang, “A low-power compact nuclear quadrupole
resonance (NQR) based explosive detection system,” Ph.D. thesis, University of Nebraska - Lincoln, 2014.
[5] A. Kaspar, CONPHIRMER - Project Final Report, Grant
Agreement Number 261670, King’s College London, 2014.
[6] T. Rudakov, “Magnetic resonance: NQR technique and
instruments,” Encyclopedia of Spectroscopy and
Spectrometry (Third Edition), pp. 700–710, Elsevier, 2015. [7] J. Flexman, et al., “The detection of explosives in airport
luggage using the direct nuclear quadrupole resonance method,” Detection of Bulk Explosives Advanced Techniques against Terrorism, NATO Science Series II, pp. 113–124, Springer Netherlands, 2004.
[8] J. Apostolos, W. Mouyos, J. Feng, and W. Chase,
“Low-power stimulated emission nuclear quadrupole resonance
detection system utilizing Rabi transitions,” SPIE
Proceedings, vol. 8709, 2013.
[9] A. Garroway, J. B. Miller, D. B. Zax, and M. Liao, “Method
and apparatus for detecting target species having quadrupolar nuclei by stochastic nuclear quadrupole resonance,” Patent, US5608321, 1997.
[10] R. Naveed, E. Gudmundson, and A. Jakobsson, “An overview
of NQR signal detection algorithms,” Magnetic Resonance Detection of Explosives and Illicit Materials, NATO Science for Peace and Security Series B: Physics and Biophysics, pp. 19-33, 2014.
[11] V. Bringi, and V. Chandrasekar, “Polarimetric doppler
weather radar: Principles and applications,” Cambridge University Press, pp. 37-38, 2001.
[12] NMR Analysis, “Sensitivity Enhancement for free?,” 2008,
accessed 16.06.2018:
http://nmr- analysis.blogspot.com/2008/07/sensitivity-enhancement-for-free.html.
[13] P. Hemnani, G. Joshi, A. K. Rajarajan, and S. V. G.
Ravindranath, “14
N NQR spectrometer for explosive detection: A review,” 2016 International Conference on Automatic Control and Dynamic Optimization Techniques (ICACDOT), pp. 1120-1125, 2016.
[14] J. Schiano, A. J. Blauch, and M. D. Ginsberg, “Optimization
of NQR pulse parameters using feedback control,” XVth
International Symposium on Nuclear Quadrupole
Interactions, 1999.
[15] J. Schiano, T. Routhier, A. J. Blauch, and M. D. Ginsberg, “Feedback optimization of pulse width in the SORC sequence,” Journal of Magnetic Resonance 140, pp. 84–90, 1999.
[16] S. D. Somasundaram, K. Althoefer, A. S. Smith, and L. D. Seneviratne, “Detection of landmines using nuclear quadrupole resonance (NQR): Signal processing to aid classification,” Climbing and Walking Robots, Springer, pp. 833-840, 2006.
[17] S. Tantum, et al., “Signal processing for NQR discrimination
of buried landmines,” SPIE Conference on Detection and Remediation Technologies for Mines and Minelike Targets IV, vol. 3710, 1999.
[18] T. Yingyi, S. L. Tantum, and L. M. Collins, “Landmine
International Geoscience and Remote Sensing Symposium, 2002.
[19] T. Yingyi, S. L. Tantum, and L. M. Collins, “Cramer–Rao
lower bound for estimating quadrupole resonance signals in non-gaussian noise,” IEEE Signal Processing Letters, vol. 11, no. 5, pp. 490-493, 2004.
[20] T. Yingyi, S. L. Tantum, and L. M. Collins, “Kalman filtering
for enhanced landmine detection using quadrupole
resonance,” IEEE Transactions on Geoscience and Remote Sensing, vol. 43, no. 7, pp. 1507-1516, 2005.
[21] G. Liu, Y. Jiang, H. Xiong, J. Li, and G. A. Barrall, “Radio frequency interference suppression for landmine detection by quadrupole resonance,” EURASIP Journal on Applied Signal Processing, vol. 2006, pp. 1-14, 2006.
[22] H. Xiong, “Robust adaptive methods and their applications in
quadrupole resonance,” Ph.D. thesis, University of Florida, 2006.
[23] J. Stegenga, “Humanitarian de-mining: Detection algorithms
for NQR signals,” M.S. thesis, University of Twente, 2004.
[24] A. Jakobsson, M. Mossberg, M. D. Rowe, and J. A. S. Smith,
“Exploiting temperature dependency in the detection of NQR signals,” IEEE Transactions on Signal Processing, vol. 54, no. 5, pp. 1610-1616, 2006.
[25] A. Jakobsson, M. Mossberg, M. D. Rowe, and J. A. S. Smith,
“Frequency-selective detection of nuclear quadrupole resonance signals,” IEEE Transactions on Geoscience and Remote Sensing, vol. 43, no. 11, pp. 2659-2665, 2005.
[26] S. D. Somasundaram, A. Jakobsson, and E. Gudmundson,
“Exploiting spin echo decay in the detection of nuclear quadrupole resonance signals,” IEEE Transactions on Geoscience and Remote Sensing, vol. 45, no. 4, pp. 925-933, 2007.
[27] S. D. Somasundaram, et al., “Robust detection of stochastic nuclear quadrupole resonance signals,” IEEE Transactions on Signal Processing, vol. 56, no. 9, pp. 4221-4229, 2008. [28] N. R. Butt, A. Jakobsson, S. D. Somasundaram, and J. A. S.
Smith, “Robust multichannel detection of mixtures using nuclear quadrupole resonance,” IEEE Transactions on Signal Processing, vol. 56, no. 10, pp. 5042-5050, 2008.
[29] S. D. Somasundaram, A. Jakobsson, and E. Gudmundson,
“Robust nuclear quadrupole resonance signal detection allowing for amplitude uncertainties,” IEEE Transactions on Signal Processing, vol. 56, no. 3, pp. 887-894, 2008.
[30] S. D. Somasundaram, A. Jakobsson, and N. R. Butt,
“Countering radio frequency interference in single-sensor quadrupole resonance,” IEEE Geoscience and Remote Sensing Letters, vol. 6, no. 1, pp. 62-66, 2009.
[31] Y. Jiang, P. Stoica, and J. Li, “Array signal processing in the
known waveform and steering vector case,” IEEE Transactions on Signal Processing, vol. 52, no. 1, pp. 23-35, 2004.
[32] H. Xiong, J. Li, and G. A. Barrall, “Joint TNT and RDX
detection via quadrupole resonance,” IEEE Transactions on Aerospace and Electronic Systems, vol. 43, no. 4, pp. 1282-1293, 2007.
[33] J. Swärd, and A. Jakobsson, “Canceling stationary
interference signals exploiting secondary data,” 22nd European
Signal Processing Conference (EUSIPCO), 2014.
[34] J. Niu, T. Sua, X. Hea, K. Zhua, and H. Wu, “Weak NQR
signal detection based on generalized matched filter,” 2010
Symposium on Security Detection and Information
Processing, pp. 377-382, 2010.
[35] N. R. Butt, and A. Jakobsson, “Efficient removal of noise and
interference in multichannel quadrupole resonance,” 2011 Conference Record of the Forty Fifth Asilomar Conference on Signals, Systems and Computers (ASILOMAR), 2011.
[36] E. Gudmundson, P. Wirfalt, A. Jakobsson, and M. Jansson,
“An ESPRIT-based parameter estimator for spectroscopic data,” 2012 IEEE Statistical Signal Processing Workshop (SSP), 2012.
[37] W. Shao, P. Kosmas, K. Althoefer, and J. Barras, “Canceling
strong and complex interference in NQR-based landmine
detection,” 2016 IEEE International Conference on
Information and Automation for Sustainability (ICIAfS), 2016.
[38] G. V. Mozzhukhin, G. S. Kupriyanova, I. G. Mershiev, and S.
V. Molchanov, “Signal processing in NMR/NQR detection on the base of pattern signal,” 2016 9th International Kharkiv Symposium on Physics and Engineering of Microwaves, Millimeter and Submillimeter Waves (MSMW), 2016. [39] T. Piatti, S. Lei, J. Barras, and A. Jakobsson, “Interference
cancellation in two-channel nuclear quadrupole resonance measurements,” 2017 IEEE International Conference on Acoustics, Speech and Signal Processing (ICASSP), 2017. [40] K. Zhu, Z. Zhao, and H. Jia, “Nuclear quadrupole resonance
signal detectability enhancement methods,” 2017
International Conference on Information and Communication Technology Convergence (ICTC), 2017.
[41] P. Hemnani, A. K. Rajarajan, G. Joshi, and S. V. G.
Ravindranath, “Detection of NQR signals using wavelet transform and adaptive filters,” International Journal of Instrumentation Technology, vol. 2, no. 1, pp. 34-49, 2018.
[42] W. Shao, J. Barras, K. Althoefer, and P. Kosmas, “Detecting
NQR signals severely polluted by interference,” Signal Processing, vol. 138, pp. 256-264, 2017.
[43] W. Shao, J. Barras, and P. Kosmas, “Detection of extremely weak NQR signals using stochastic resonance and neural network theories,” Signal Processing, vol. 142, pp. 96-103, 2018.
[44] J. Apostolos, J. Feng, W. Mouyos, and B. McMahon, “Using
phase matched filters for NQR detection of continuous Rabi transitions,” Patent, US8660803, 2014.
[45] P. Klukowski, et al., “NMRNet: a deep learning approach to automated peak picking of protein NMR spectra,” Bioinformatics, pp. 2590-2597, 2018.
[46] ScienceDirect, Machine learning articles search, 2018,
accessed 20.06.2018:
https://www.sciencedirect.com/search?qs=machine%20learni ng&show=25&sortBy=relevance.
[47] L. Lazebnik, “Convolutional neural network architectures:
from LeNet to ResNet,” Presentation, University of Illinois,
accessed 20.06.2018:
http://slazebni.cs.illinois.edu/spring17/lec01_cnn_architecture s.pdf.
[48] B. Póczos, and A. L. Singh, “Introduction to machine learning
CMU-10701 Deep Learning,” Presentation, Carnegie Mellon
University, accessed 20.06.2018:
http://www.cs.cmu.edu/~aarti/Class/10701_Spring14/slides/D eepLearning.pdf.
[49] X. Liu, R. Li, C. Zhao, and P. Wang, “Robust signal
recognition algorithm based on machine learning in heterogeneous networks,” Journal of Systems Engineering and Electronics, vol. 27, no. 2, pp. 333-342, 2016.
[50] T. Gao, et al., “Improving deep neural network based speech
enhancement in low SNR environments,” Latent Variable
Analysis and Signal Separation: 12th International
Conference, pp. 75-82, 2015.
[51] stfalcon.com, “Deep learning: definition, benefits, and
challenges,” 2018, accessed 20.06.2018:
![Figure 1. Electric quadrupole moment sign based on the charge distribution in the nucleus [3]](https://thumb-us.123doks.com/thumbv2/123dok_us/7806174.2085115/2.595.78.261.639.701/figure-electric-quadrupole-moment-based-charge-distribution-nucleus.webp)
![Figure 5. Quadrature detection [11] .](https://thumb-us.123doks.com/thumbv2/123dok_us/7806174.2085115/4.595.300.515.520.627/figure-quadrature-detection.webp)
![Figure 7. Direct Kalman estimation results [20]](https://thumb-us.123doks.com/thumbv2/123dok_us/7806174.2085115/5.595.117.275.399.554/figure-direct-kalman-estimation-results.webp)
