VOLUME 17 ISSUE 2 (2019), Page 302
–
311
PREDICTABILITY OF POSITIVE RELATIONSHIPS THROUGH
PERSONAL EMPOWERMENT
Aisyah Abu Bakar
1, Mariana Mohamed Osman
2& Muhammad Faris Abdullah
31,2,3
Kulliyyah of Architecture and Environmental Design
INTERNATIONAL ISLAMIC UNIVERSITY MALAYSIA
Abstract
Designers have long adopted the knowledge from the field of psychology to
expand architectural space’s emotion
al impacts. Appropriate design strategies
can improve and sustain well-being through instilling the sense of empowerment,
leading to positive relationships among space occupants.
Issue
: A large body of
the literature has sought to provide a conclusive empirical assessment on the
predictability of attitudes and behaviours in positive relationships (PR) through
personal empowerment (PE).
Purpose
: This paper intends to determine the
predictability of PR based on PE.
Approach
: Multiple Correlation and Multiple
Linear Regression were conducted to estimate linear associations and parameters
of linear equations to predict PR components based on PE items.
Findings
:
Components of PR were predictable by the majority of the PE items and
‘
monitoring behaviours to suit with situation
’ was the strongest predictor of PR.
INTRODUCTION
Human interdependence with other humans (HIH) is one of the agents of
subjective sustainable well-
being (SSWB). HIH is the extent of individuals’
abilities to dedicate themselves in their social context in return for SSWB.
Personal empowerment (PE) and positive relationships (PR) are dimensions of
HIH. Spatial designs support developmental milestones contributing to enhance
PE. Some studies have theoretically justified the widely diverse ends and means
of PE. While there are claims of PE as enablers of PR, empirical evidence is still
lacking. This paper assesses the statistical predictability of PR based on PE.
LITERATURE REVIEW
Case studies based on articles from selected Asian Journals from the year 2011
onwards highlight conditional factors and potential determinants of Positive
Relations (PR). Table 1 summarises these findings.
Table 1
Conditional factors and potential determinants for positive relationships
Conditional Factors (keywords) Potential Determinants References Parenting styles and involvement, authoritiesparenting, work-family balance; economic situation health and safety at home; community involvement; spirituality; density and number of bedrooms.
Involvement, support, resilience, time (ability to spend time with family), and family functioning (fulfilling roles and)
Noraini, Gandhi, Ishak, & Wok (2014) husband and wife relations, family relationships,
achievements, economic situations, standard of living, health, safety, relationship with community, spiritual practices, and basic amenities.
Functioning, involvement, resilience, tolerance (acceptance) and understanding, helpfulness and time with family
Abu Rahim, Ishak, Mohd Shafie, &
Shafiai (2013)
Settlement areas (urban area), income (> RM 800), marital status (married) and possess social life skills
Care (feeling concern for), responsibility, and social contact (communication)
Mohamad et al. (2013) Resilience (strength to cope in stressful situations),
financial autonomy (financially independent)
Emotional intimacy, tolerance, responsibility
Shuib et al. (2013) Gender – women apologize more to the same gender,
while men apologize easier to the opposite gender. Women have a ‘lower threshold of what constitutes offensive behaviour’. Men tend to apologize when they believe that they have actually offended someone.
Ability to apologise, humility (humbleness), modesty (moderate and unassuming), compassion (empathy and sensitivity)
Turiman, Leong, & Hassan (2013) Age and number of children negatively correlate with
marital satisfaction. Marital satisfaction refers to the perception towards marital relationship in terms of the marriage as a whole, the husband or wife as a spouse, the overall relationship with husband or wife, and the expression of love in the relationship.
Love (deep affection), passion (enthusiasm for someone), intimacy (close familiarity), commitment (sense of obligation), and communication (connecting) Hoesni, Subhi, Alavi, & Wan Azreena (2013) Parents’ self-esteem (confidence in abilities), family
functioning (involvement and communication), and temperament (innate and enduring personality traits)
Conducive (encouraging) and responsive (readily responding) behaviours
Chiah & Baharudin
(2013)
Parents’ personality factors, parent-child relationship and practices, parental intervention, family sibship size, peer relationship and academic performance
Extraversion (outgoing) emotional stability, and conscientiousness (being careful or vigilant)
Ha & Tam (2013)
experience), and social skills (skills facilitating interaction and communication with others) Peer-rejection (exclusion from social interaction), isolation (separation from others), criticism (expression of disapproval), strictness (rigidity and stringency), competitions (act of rivalry and supremacy), and emotional dissatisfaction (intense feelings of discontent or feeling disgruntled).
Interaction skills, flexibility (willingness to compromise) cooperativeness (joint action) and nurturance (love, care and attention given to someone)
Vellymalay (2013)
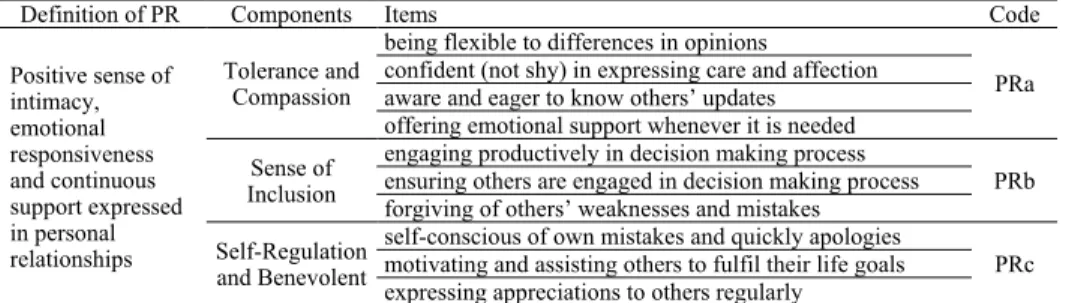
The findings from the case studies generate three significant components
of PR: (i) Tolerance and Compassion (PRa), (ii) Sense of Inclusion (PRb) and
(iii) Self-Regulation and Benevolent (PRc).
Table 2
Components and determinants of positive relationships
Definition of PR Components Items Code
Positive sense of intimacy, emotional responsiveness and continuous support expressed in personal relationships
Tolerance and Compassion
being flexible to differences in opinions
PRa confident (not shy) in expressing care and affection
aware and eager to know others’ updates offering emotional support whenever it is needed Sense of
Inclusion
engaging productively in decision making process
PRb ensuring others are engaged in decision making process
forgiving of others’ weaknesses and mistakes
Self-Regulation and Benevolent
self-conscious of own mistakes and quickly apologies
PRc motivating and assisting others to fulfil their life goals
expressing appreciations to others regularly
Personal Empowerment (PE) manifests in the opportunity to exercise
control, voice and choice with regards to social surroundings. Qualities adhere to
PE include (i) self-motivation with regards to goal orientation, autonomy and
self-regulation (Fatimah et al., 2011; Chin et al., 2012; Kok, 2016), (ii) social
acceptance and coherence with others (Fatimah, Lukman, Khairudin, Wan
Shahrazad, & Halim, 2011; Nesbit, Jepsen, Demirian, & Ho, 2012; Kadir, Omar,
Desa, & Yusooff, 2013; Zamani, Khairudin, Sulaiman, Halim, & Nasir, 2013),
and (iii) composure, stability and resilience (Song, Cai, Brown, & Grimm, 2011;
Sulaiman et al., 2013; Sipon, Nasrah, Nazli, Abdullah, & Othman, 2014).
Table 3
Determinants of personal empowerment
Definition of PE Items Code
Self-esteem in taking control over life along with sense of composure to progress in the social
environment
setting goals and striving to meet goals PE1 striving and working hard even for easy goals PE2 monitoring behaviours to suit with situations PE3
knowing when somebody is offended PE4
Based on theoretical underpinnings, this research hypothesises that PR
components are predictable by PE. The following sections provide empirical
evidence the predictability of PRa, PRb and PRc based on PE items.
METHOD
A sample of 4,315 was gathered after the data screening process. The Malaysian
respondents were given an 11-point Likert scale to respond to questionnaire items
which include the components of PR and the ten (10) PE items. Pearson
correlation analyses were conducted to observe if there were linear associations
between the PR components and PE items. Ensuing correlation analyses, multiple
linear regression analyses were conducted to estimate parameters of the linear
equations used to predict values of PRa, PRb and PRc from PE items.
RESULTS AND
DISCUSSION
At 95% confidence level, there were statistically significant positive correlations
between (i) PRa and each of PE items, (ii) PRb and each of PE items, and (iii)
PRc and each of PE items. The null hypotheses claiming there are no statistically
significant correlations between (i) PRa and respective PE items, (ii) PRb and
respective PE items, and (iii) PRc and respective PE items were all rejected.
Table 4
Multiple Correlations between PE items and PRa, PRb and PRc
H0 There is no statistically significant correlation between PRa and respective PE itemsH0 There is no statistically significant correlation between PRb and respective PE items
H0 There is no statistically significant correlation between PRc and respective PE items
Correlation Strength Threshold (Dancey & Reidy, 2004)
r 0 .1 .2 .3 .4 .5 .6 .7 .8 .9 1
strength zero weak moderate strong perfect
DV Stats PE1 PE2 PE3 PE4 PE5 PE6 PE7 PE8 PE9 PE10
PRa
r .494** .511** .498** .470** .470** .431** .442** .427** .445** .405**
p .000 .000 .000 .000 .000 .000 .000 .000 .000 .000 N 4315 4315 4315 4315 4315 4315 4315 4315 4315 4315
PRb
r .446** .465** .461** .426** .451** .382** .402** .403** .419** .375**
p .000 .000 .000 .000 .000 .000 .000 .000 .000 .000 N 4315 4315 4315 4315 4315 4315 4315 4315 4315 4315
PRc
r .458** .473** .480** .433** .463** .386** .412** .389** .420** .351**
p .000 .000 .000 .000 .000 .000 .000 .000 .000 .000 N 4315 4315 4315 4315 4315 4315 4315 4315 4315 4315
Statistical Interpretation of Multiple Correlation Analyses
PRa
At 95% confidence level, there were statistically significant and moderate correlations between PRa and (i) PE1 (r =.494, p = .000); (ii) PE2 (r =.511, p = .000); (iii) PE3 (r =.498, p = .000); (iv) PE4 (r =.470, p = .000); (v) PE5 (r =.470, p = .000); (vi) PE6 (r =.431, p = .000); (vii) PE7 (r =.442, p = .000); (viii) PE8 (r =.427, p = .000); (ix) PE9 (r =.445, p = .000); (x) PE01 (r =.405, p = .000).
.000); (viii) PE9 (r =.419, p = .000). Additionally, there were statistically significant and weak correlations between PRb and (ix) PE6 (r =.382, p = .000); (x) PE10 (r =.375, p = .000).
PRc
At 95% confidence level, there were statistically significant and moderate correlations between PRc and (i) PE1 (r =.458, p = .000); (ii) PE2 (r =.473, p = .000); (iii) PE3 (r =.480, p = .000); (iv) PE4 (r =.433, p = .000); (v) PE5 (r =.463, p = .000); (vi) PE7 (r =.412, p = .000); (vii) PE8 (r =.389, p = .000); (viii) PE9 (r =.420, p = .000); Additionally, there were statistically significant and weak correlations between PRc and (ix) PE6 (r =.386, p = .000); (x) PE10 (r =.351, p = .000).
Three (3) multiple regression analyses were carried out to predict the
values of each of dependent variables (i) PRa, (ii) PRb and (iii) PRc given the set
of PE explanatory variables (PE1, PE2, PE3, PE4, PE5, PE6, PE7, PE8, PE9, and
PE10).
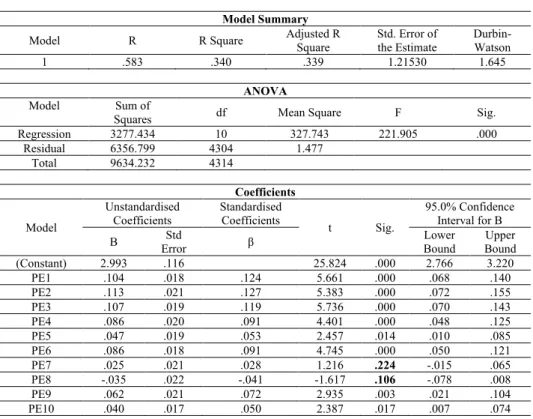
Table 5
Multiple Linear Regression
–
PE predicting PRa
H0There will be no significant prediction of PRa by PE1, PE2, PE3, PE4, PE5, PE6, PE7, PE8, PE9 and PE10
Model Summary
Model R R Square Adjusted R Square Std. Error of the Estimate Durbin-Watson
1 .583 .340 .339 1.21530 1.645
ANOVA
Model Sum of
Squares df Mean Square F Sig.
Regression 3277.434 10 327.743 221.905 .000
Residual 6356.799 4304 1.477
Total 9634.232 4314
Coefficients
Model
Unstandardised Coefficients
Standardised
Coefficients t Sig.
95.0% Confidence Interval for B
B Error Std β Lower Bound Bound Upper
(Constant) 2.993 .116 25.824 .000 2.766 3.220
PE1 .104 .018 .124 5.661 .000 .068 .140
PE2 .113 .021 .127 5.383 .000 .072 .155
PE3 .107 .019 .119 5.736 .000 .070 .143
PE4 .086 .020 .091 4.401 .000 .048 .125
PE5 .047 .019 .053 2.457 .014 .010 .085
PE6 .086 .018 .091 4.745 .000 .050 .121
PE7 .025 .021 .028 1.216 .224 -.015 .065
PE8 -.035 .022 -.041 -1.617 .106 -.078 .008
PE9 .062 .021 .072 2.935 .003 .021 .104
PE10 .040 .017 .050 2.387 .017 .007 .074
= 221.905, p = .000, with an R
2of .340; indicating that the proportion of variance
in PRa that can be explained by PE items was 34%.
At 95% confidence level, PE1 (B = .104, t = 5.661, p = .000), PE2 (B =
.113, t = 5.383, p =.000), PE3 (B = .107, t = 5.736, p =.000), PE4 (B = .086, t =
4.401, p =.000), PE5 (B = .047, t = 2.457, p = .014), PE6 (B = .086, t = 4.745, p
=.000), PE9 (B = .062, t = 2.935, p =.003) and PE10 (B = .040, t = 2.387, p =.017)
were significant predictors of PRa. On the contrary, it was found that PE7 (B =
.025, t = 1.216, p = .224) and PE8 (B = -.035, t = -1.617, p = .106) were not
significant predictors of PRa.
Personal Empowerment (PE) items significantly account for 34% of
Tolerance and Compassion (PRa). Eight (8) of PE items were significant
predictors of PRa.
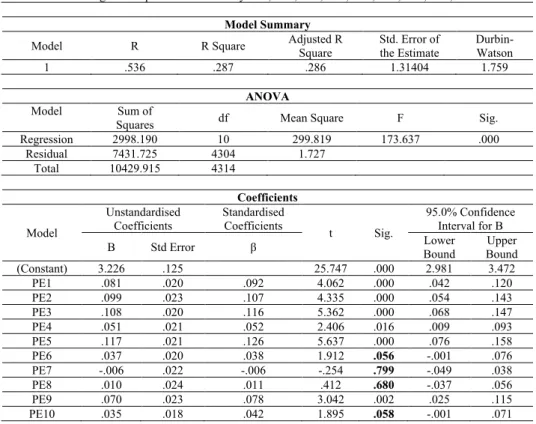
Table 6
Multiple Linear Regression
–
PE predicting PRb
H0There will be no significant prediction of PRb by PE1, PE2, PE3, PE4, PE5, PE6, PE7, PE8, PE9 and PE10
Model Summary
Model R R Square Adjusted R Square Std. Error of the Estimate Durbin-Watson
1 .536 .287 .286 1.31404 1.759
ANOVA
Model Sum of
Squares df Mean Square F Sig.
Regression 2998.190 10 299.819 173.637 .000
Residual 7431.725 4304 1.727
Total 10429.915 4314
Coefficients
Model
Unstandardised Coefficients
Standardised
Coefficients t Sig.
95.0% Confidence Interval for B
B Std Error β Lower Bound Bound Upper
(Constant) 3.226 .125 25.747 .000 2.981 3.472
PE1 .081 .020 .092 4.062 .000 .042 .120
PE2 .099 .023 .107 4.335 .000 .054 .143
PE3 .108 .020 .116 5.362 .000 .068 .147
PE4 .051 .021 .052 2.406 .016 .009 .093
PE5 .117 .021 .126 5.637 .000 .076 .158
PE6 .037 .020 .038 1.912 .056 -.001 .076
PE7 -.006 .022 -.006 -.254 .799 -.049 .038
PE8 .010 .024 .011 .412 .680 -.037 .056
PE9 .070 .023 .078 3.042 .002 .025 .115
PE10 .035 .018 .042 1.895 .058 -.001 .071
Durbin-= 173.637, p Durbin-= .000, with an R
2of .287; indicating that the proportion of variance
in PRb that can be explained by PE items was 28.7%.
At 95% confidence level, PE1 (B = .081, t = 4.062, p = .000), PE2 (B =
.099, t = 4.335, p =.000), PE3 (B = .108, t = 5.362, p =.000), PE4 (B = .051, t =
2.406, p =.000), PE5 (B =.117, t = 3.042, p = .002), and PE9 (B = .070, t = 2.935,
p =.003) were significant predictors of PRb. On the contrary, it was found that
PE6 (B = .037, t = 1.912, p =.056), PE7 (B = -.066, t = -.254, p = .799), PE8 (B
= .010, t = .412, p = .680) and PE10 (B = .035, t = 1.895, p =.058) were not
significant predictors of PRb.
Personal Empowerment (PE) items significantly account for 28.7% of
Sense of Inclusion (PRb). Six (6) of PE items were significant predictors of PRb.
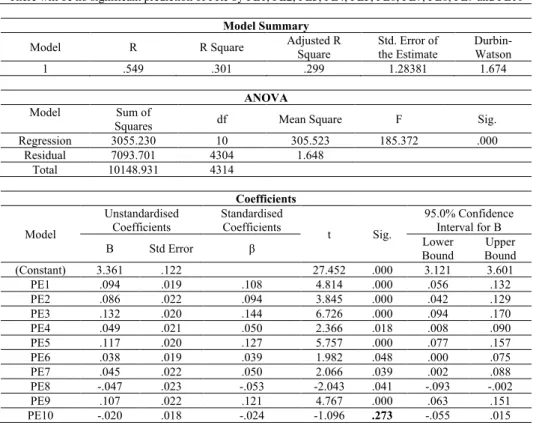
Table 7
Multiple Linear Regression
–
PE predicting PRc
H0There will be no significant prediction of PRc by PE1, PE2, PE3, PE4, PE5, PE6, PE7, PE8, PE9 and PE10
Model Summary
Model R R Square Adjusted R Square Std. Error of the Estimate Durbin-Watson
1 .549 .301 .299 1.28381 1.674
ANOVA
Model Sum of
Squares df Mean Square F Sig.
Regression 3055.230 10 305.523 185.372 .000
Residual 7093.701 4304 1.648
Total 10148.931 4314
Coefficients
Model
Unstandardised Coefficients
Standardised
Coefficients t Sig.
95.0% Confidence Interval for B
B Std Error β Lower Bound Bound Upper
(Constant) 3.361 .122 27.452 .000 3.121 3.601
PE1 .094 .019 .108 4.814 .000 .056 .132
PE2 .086 .022 .094 3.845 .000 .042 .129
PE3 .132 .020 .144 6.726 .000 .094 .170
PE4 .049 .021 .050 2.366 .018 .008 .090
PE5 .117 .020 .127 5.757 .000 .077 .157
PE6 .038 .019 .039 1.982 .048 .000 .075
PE7 .045 .022 .050 2.066 .039 .002 .088
PE8 -.047 .023 -.053 -2.043 .041 -.093 -.002
PE9 .107 .022 .121 4.767 .000 .063 .151
PE10 -.020 .018 -.024 -1.096 .273 -.055 .015
= 185.372, p = .000, with an R
2of .301; indicating that the proportion of variance
in PRc that can be explained by PE items was 30.1%.
At 95% confidence level, PE1 (B = .094, t = 4.814, p = .000), PE2 (B =
.086, t = 3.845, p =.000), PE3 (B = .132, t = 6.726, p =.000), PE4 (B = .049, t =
2.366, p =..018), PE5 (B = .117, t = 5.757, p = .000), PE6 (B = .038, t = 1.982, p
=.048), PE7 (B = .045 t = 2.066, p = .039), PE8 (-.047, t = -2.043, p = .041) and
PE9 (B = .107, t = 4.767, p =.000) were significant predictors of PRc. It was
found that PE10 (B = -.020, t = -1.096, p =.273) was not significant predictor of
PRc.
Personal Empowerment (PE) items significantly account for 30.1% of
Self-Regulation and Benevolent (PRc). Nine (9) of PE items were significant
predictors of PRc.
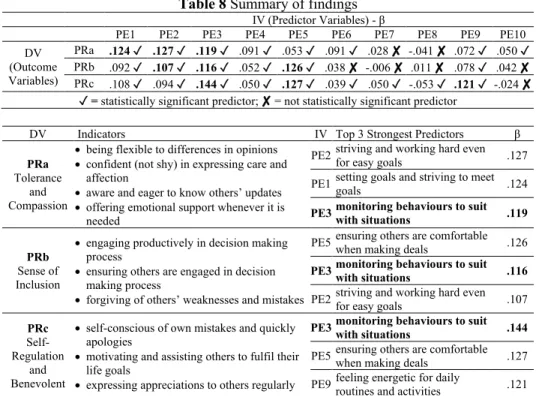
Table 8
Summary of findings
IV (Predictor Variables) - βPE1 PE2 PE3 PE4 PE5 PE6 PE7 PE8 PE9 PE10
DV (Outcome Variables)
PRa .124 ✓ .127✓ .119 ✓ .091 ✓ .053 ✓ .091 ✓ .028 ✘ -.041 ✘ .072 ✓ .050 ✓ PRb .092 ✓ .107 ✓ .116 ✓ .052 ✓ .126 ✓ .038 ✘ -.006 ✘ .011 ✘ .078 ✓ .042 ✘ PRc .108 ✓ .094 ✓ .144 ✓ .050 ✓ .127 ✓ .039 ✓ .050 ✓ -.053 ✓ .121 ✓ -.024 ✘
✓ = statistically significant predictor; ✘ = not statistically significant predictor
DV Indicators IV Top 3 Strongest Predictors β
PRa Tolerance
and Compassion
•being flexible to differences in opinions •confident (not shy) in expressing care and
affection
•aware and eager to know others’ updates •offering emotional support whenever it is
needed
PE2 striving and working hard even for easy goals .127
PE1 setting goals and striving to meet goals .124
PE3 monitoring behaviours to suit with situations .119
PRb Sense of Inclusion
•engaging productively in decision making process
•ensuring others are engaged in decision making process
•forgiving of others’ weaknesses and mistakes
PE5 ensuring others are comfortable when making deals .126
PE3 monitoring behaviours to suit with situations .116
PE2 striving and working hard even for easy goals .107
PRc Self-Regulation
and Benevolent
•self-conscious of own mistakes and quickly apologies
•motivating and assisting others to fulfil their life goals
•expressing appreciations to others regularly
PE3 monitoring behaviours to suit with situations .144
PE5 ensuring others are comfortable when making deals .127
PE9 feeling energetic for daily routines and activities .121