International Journal of Communication Networks and Information Security (IJCNIS) Vol. 7, No. 3, December 2015
A Driving Path Based Opportunistic Routing in
Vehicular Ad Hoc Network
Nassim Mirjazaee
1, Neda Moghim
11
Faculty of Computer Engineering, University of Isfahan, Isfahan,Iran [email protected], [email protected]
Corresponding Author: Neda Moghim
Abstract: Vehicular Ad Hoc Networks is a promising technology that can widely apply to monitor the physical world in urban areas. Efficient data delivery is important in these networks and optimal route selection is vital to improve this factor. Vehicular mobility is a reflection of human social activity and human trajectories show a high degree of temporal and spatial regularity. Therefore, vehicular driving paths are predictable in a large extent. A new opportunistic routing protocol (DPOR) is proposed in this study that uses driving path predictability and vehicular distribution in its route selection procedure. This protocol is composed of two phases: intersection and next hop selection phases. A utility function is calculated to select the next intersection and a new mechanism is also proposed for the next hop selection phase. Simulation results show that DPOR achieves high delivery ratio and low end-to-end delay in the network.
Keywords: Vehicular ad hoc network, Opportunistic routing, driving path predictability, Data delivery ratio.
1.
Introduction
A growing number of vehicles are equipped by wireless transceivers to communicate with each other. They form a special class of wireless networks, known as vehicular ad hoc networks or VANETs [1-2]. Besides road safety applications, which are meant to avoid injuries, comfort and innovative applications are increasingly becoming popular, which increase the power of vehicular networks. Accessing the Internet and offering P2P services are some of those applications [3]. VANET is characterized by high node mobility and fast changing topology [4]. The main challenge of these kinds of services is how to maintain persistent connection between vehicle nodes to transmit data from source to destination via wireless multi-hop transmission or carry-and-forward techniques. To realize the above mentioned applications, one of the key research topics is to design effective data delivery schemes. Therefore, many research works have been conducted on this topic recently. Among the existing schemes, some works use route information (hop count, bandwidth, link quality, etc.) in their routing process, such as DSR and AODV [5, 6]. Due to the high speed of nodes' movement and high overhead of the route maintenance phase, these protocols are not suitable for VANETs.
Some other works use geographical position information and traffic model to find the suitable route. This information can be obtained by onboard navigation systems. The performance of these protocols mainly depends on the network connectivity and thus on the vehicle nodes’ density. Therefore they do not work well in sparse vehicular condition. GPSR and CAR [7, 8] are examples of this kind of protocols. To solve this problem, opportunistic routing has been proposed, which can cope with sparse and partitioned
networks. Opportunistic routing schemes carry the message until a suitable next hop is found. But this causes additional delay in message delivery process.
Some other research works have mentioned that human trajectories show a high degree of temporal and spatial regularity [9-11]. Most of the trips made by the drivers are repetitive and formed by travelling between a limited number of sources and destinations.
In this study, driving path predictability, vehicular density and their way of distribution over the road are used to propose a new protocol for data delivery improvement.
The rest of the paper is organized as follows: In Section 2, related works on routing protocols in vehicular ad hoc networks are summarized. Section 3 analyzes the driving path predictability for various types of vehicles and discusses the feasibility of proposing a new scheme. The proposed new protocol (DPOR) will be described in section 4, which will be evaluated in Section 5 via simulation study and finally, Section 6 will conclude the paper.
2.
Related Works
Alternating connectivity, rapidly changing topology and stringent application requirements (e.g., guaranteed high delivery rate and low packet end-to-end delay) make routing a challenging task in VANETs. Different methods have been proposed to solve this problem. These methods can be classified in to 3 groups:
I. Position based routing II. Trajectory based routing III. Opportunistic routing
Position based routing: Position based schemes use the geographical positioning information to select the next forwarding hop. Packet is sent to the next hop neighbor that is closer to the destination, without any map knowledge. This technique is called greedy forwarding toward destination. They do not keep global network information and their performance mainly depends on the network connectivity. Thus position based routing schemes cannot work well when the vehicular traffic is sparse and of none uniform distribution. GPSR and ASTAR [12] are two examples of position based routing.
International Journal of Communication Networks and Information Security (IJCNIS) Vol. 7, No. 3, December 2015
network resources compared to the position based ones. Because they use a specific trajectory to forward the packets and this prevents the packets to hang around the networks. TBD [15] is an example of trajectory based routing
Opportunistic routing: Opportunistic routing schemes can cope with sparse and partitioned networks. No end-to-end path is assumed between source and destination in opportunistic routing schemes and they might never be connected during the network's lifetime. Moreover, nodes do not require the global knowledge of network topology to forward the message. Routes are built dynamically and each node selects its next hop based on local information of neighbors. If a suitable next hop is not found, the message will be carried till a suitable node is found. This comes at a price of additional delay in message delivery due to the lower speed of vehicle’s movement compared to the wireless communication’s speed. Effective buffering of message also takes role in the delay increase of the network.
These methods are compared in Table 1.
Table 1.Comparisons of routing protocols
Category Method Advantage Disadvantage
Position based routing
Uses geographical
position information to select next hop.
Needs only to know the position of its one-hop neighbors.
Weak performance
in sparse environment
Trajectory based routing
Uses a hybrid strategy based on source- based routing
and greedy forwarding.
data packet overhead is
low
Weak performance
in network disruptions
Opportunistic routing
Routes are built dynamically and each node selects its next hop, based on
local information and
carries the message until a
suitable next hop is found.
Suitable for sparse and partitioned networks
Additional delay in message delivery
Opportunistic routing scheme works better in sparse environments, which is a point of weakness in both groups of position and trajectory based schemes. VANETs should not interrupt their message delivery in sparse conditions. Therefore, opportunistic schemes are selected for further investigation in this study. Opportunistic routing can be divided in to 3 categories as well [16]:
I. Predictive based routing II. Topology based routing
III. Human Trajectory based routing
Predictive based routing. The motion of vehicles is constrained by road map and vehicular traffic conditions on urban and highway areas. Therefore, mobility is quite predictable in VANETs. With the use of vehicle’s movement information such as location, velocity, trajectory, and etc., this class of routing estimates the link availability. For example, life time of the routes is estimated with the use of nodes’ mobility prediction in PBR [17]. After that, the most stable route will be selected to forward the packets.
Topology based routing: Topology based routing combines position based routing and opportunistic routing together. This class of protocols uses geographical maps in
addition to location information to route the packets. Traffic-aware data delivery scheme (TADS) is a protocol that chooses intersections dynamically to forward packets through a route to the destination. This route is determined based on link quality and remaining Euclidean distance to the destination. And vehicular traffic condition is used to estimate the link quality [18].
Adaptive connectivity aware routing (ACAR) protocol selects an optimal route with the best network transmission quality. This transmission quality is based on statistical and real-time vehicular density that is gathered through an on-the-fly density collection process. ACAR protocol is suitable for both daytime and nighttime city scenarios. But when the vehicular density increases, ACAR may choose the highest density road to forward the packet, which causes MAC layer collisions. Therefore, delivery ratio cannot have much improvement and sometimes may decrease [19].
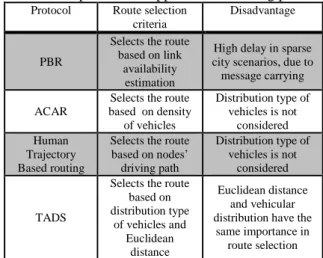
Human Trajectory based routing: This class of protocols uses human behavior based trajectories for route selection. Most of vehicular networks exhibit some sort of regularity and periodicity in their mobility patterns [20]. And this can help the routing protocols to select a more suitable path. For example, public transportation networks follow periodic schedules. Even most individuals have fairly repetitive movement patterns, for example, driving to and from the work places at approximately same times of the day. Vehicular mobility is the reflection of human social activity. Therefore, vehicular driving paths are predictable in a large extent. The mentioned opportunistic routing protocols are compared in Table 2.
Table 2.Comparisons of opportunistic routing protocol
Protocol Route selection
criteria
Disadvantage
PBR
Selects the route based on link
availability estimation
High delay in sparse city scenarios, due to message carrying
ACAR
Selects the route based on density
of vehicles
Distribution type of vehicles is not
considered Human
Trajectory Based routing
Selects the route based on nodes’ driving path
Distribution type of vehicles is not
considered
TADS
Selects the route based on distribution type
of vehicles and Euclidean
distance
Euclidean distance and vehicular distribution have the
same importance in route selection
Regarding the comparison result in Table 2, driving path predictability, vehicular density and their way of distribution over the road are used to propose the new protocol (DPOR) in this study.
3.
Predictability of the Vehicles’ Driving
Trajectory
Most of the trips made by the drivers are repetitive because they travel between a limited numbers of sources and destinations. Regarding to this point, vehicles can be classified in to different categories:
I. Vehicles with specific driving trajectories such as bus, tramway and light rail. These vehicles have stable trajectories and their driving paths are fully predictable.
International Journal of Communication Networks and Information Security (IJCNIS) Vol. 7, No. 3, December 2015
temporal and spatial regularity. For example, a private car generally travels between limited number of places such as home, workplace, supermarket, and park. Driving paths for these vehicles are almost predictable and some methods have been proposed recently to predict the private car’s driving path [21-23].
III. Vehicles with alternating trajectories, such as taxies, which have different driving paths. These vehicles have variable driving path and do not have certain destinations. But if their destination is determined in the initial stage of the trip, their trajectories will be predictable. In a research, a driving path prediction method is proposed for taxies with the assumption of destination information gathering [24].
As discussed before, driving path prediction of the vehicles is feasible and each vehicle can know its driving path beforehand. If vehicles broadcast their driving path in the hello messages, each of them can earn the trajectory of the vehicles that it meets on the road.
4.
Proposed Algorithm
Nodes in VANET do not have the ability to roam freely due to the obstacles and traffic regulations. Road segments with their containing vehicles construct the VANET topology. Finding an efficient packet routing algorithm is a challenging task in VANET. An efficient algorithm is interpreted as a route with high data delivery ratio.
Consider the network topology shown in Figure 1: Source node (S) wants to communicate with destination (D), near intersection .
Figure 1.A network example to find the path from S to D
The route ( → → ) is selected for message forwarding by the algorithms that selects high density routes, such as ACAR. This route can lead to a low data delivery ratio in this scenario, because it does not consider the vehicular distribution of the roads. Although → has higher vehicular density, → is better to forward the message, because the vehicles are more uniformly distributed on this road. As wireless communication is far faster than vehicle’ movement, using multi hop paths leads to much less transmission delays compared to carry and forward scheme. Therefore, vehicular distribution is as important as vehicular density. Furthermore, the Euclidean distance should also be considered in the route selection, but in a less degree of importance.
Vehicular density, vehicular distribution and Euclidean distance will be considered in the proposed method because considering a single factor cannot lead to a good performance.
Some assumptions are made in this study, which are given below:
First of all, city environments are considered in this study. Each vehicle is assumed to have GPS device. Therefore, its current location will be available. It is equipped with a preloaded street-level digital map, which not only describes road topology and traffic light period, but also provides traffic statistics such as vehicular traffic density and average vehicle’s speed on different times of the day. Vehicles communicate with each other through short range wireless channels and can find their neighbors through beacon messages. Each beacon message provides vehicle’s information such as its unique ID, location, velocity, and direction.
Each vehicle carries out a prediction method to obtain its driving path and announces it in the beacon message. The driving path is defined as a sequence of intersections along which the vehicle will arrive at the destination.
Furthermore, the street-level digital map is abstracted as a directed graph ( , ). For any two intersections and
, ∈ will exist if there is a road segment connecting and , and vehicles can travel from towards on this road. An accuracy factor ( ) is defined in this study. This factor shows the accuracy of the vehicle’s predicted driving path that is in the range of [0%, 100%]. takes part in the next hop selection procedure. It is set equal to 100% for the vehicles with fixed driving trajectory (buses) and its value for private cars is set more than taxies'.
4.1 Structure of DPOR
DPOR is an opportunistic multi-hop routing protocol that is capable of finding optimal route, considering vehicular traffic condition and driving path of the vehicles. DPOR is designed as a two phase protocol.
I. Intersection selection phase II. Next hop selection phase
A queue management method is also utilized to improve the data delivery ratio.
Intersection selection phase: This phase is used by the packet carriers when approaching an intersection. They calculate a utility function based on the vehicular density, vehicular distribution and the Euclidean distance for the neighboring roads.
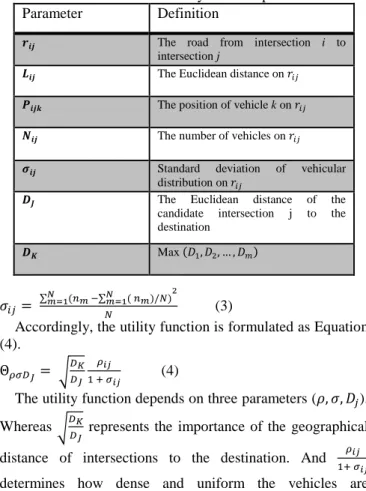
Regarding the defined parameters in Table 3, utility function is calculated for each candidate intersection as follows.
Vehicular density on road can be formulated as Equation (1).
= (1)
To consider the vehicular distribution, relative location is defined for each vehicle.
Relative location of node ( )with position ( ) on road is defined as Equation (2).
= (2)
International Journal of Communication Networks and Information Security (IJCNIS) Vol. 7, No. 3, December 2015
Table 3.Utility function parameters
Parameter Definition
!" The road from intersection i to
intersection j
#!" The Euclidean distance on
$!"% The position of vehicle k on
&!" The number of vehicles on
'!" Standard deviation of vehicular
distribution on
() The Euclidean distance of the
candidate intersection j to the
destination
(* Max (+,,+-, … , + )
/ = ∑6378(23 4∑6378( 23)/ )9 (3)
Accordingly, the utility function is formulated as Equation (4).
Θ;<=>= ?==@>
;
, A < (4)
The utility function depends on three parameters ( , /, +). Whereas ?=@
=> represents the importance of the geographical
distance of intersections to the destination. And ;
,A <
determines how dense and uniform the vehicles are distributed along the route. It is obvious that vehicular distribution is more important than Euclidean distance to improve delivery ratio and end-to-end delay. Therefore, the utility function is assumed as Equation (4) in this study.
Next hop selection phase: As vehicle ( ) has a message (M) to send, it selects the best next hop vehicle from its neighbors. The best next hop is the neighboring vehicle whose driving path will pass the destination of the message. If more than one matching vehicle is found, the next hop will be selected according to Ψ.
Ψ = × ℇ × EF (5)
M is sent to the vehicle with largest value of Ψ.
In this equation, is the vehicle's accuracy factor and F is its average speed. ℇ is a binary value parameter that is not 0 for the vehicles whose driving path passes the destination.
If there is no matching vehicle, uses geographically greedy forwarding to select the next hop. It generates a copy of M, denoted as GH, increments the COPY field of the M and sends it to the next greedy selected hop. It also buffers M and keeps carrying it until a suitable vehicle, whose driving path passes the destination, is found. will carry the message, if it is in a sparse area and there is not any vehicle in its neighbor list.
Queue management. As the vehicles' buffer size is limited, queue management would greatly affect the data delivery ratio. In DPOR, COPY field of the message indicates the number of copies; propagated in the network and time to live (TTL) filed of the message shows its remaining life time. Messages will get higher transmission priority, if they have smaller COPY and lower time to live values. The dropping strategy of the buffers is as follows:
I. When a message arrives and the queue is full, it will be compared to the message at the tail of the queue. The one with the bigger COPY field and in the case
of equal copy fields, the one with the shorter TTL is dropped.
II. When TTL decreases to 0, the message will be dropped.
5.
Performance Evaluation
Performance of the proposed algorithm will be evaluated via simulation in this section. To simulate a VANET, three stages should be passed. These three stages are done by vehicles’ mobility simulator, network simulator and VANET simulator which will be explained below:
Vehicles’ mobility simulator:
Road map, vehicle’s traveling scenario or some road and vehicles’ parameters, such as vehicles’ maximum speed, road limitation, vehicles’ arrival, departure times and etc. are important to be used to simulate a vehicle movement. SUMO is used in this study for mobility simulation and its output is a timely changing coordinate of vehicles and their mobility parameters such as speed, acceleration and etc.
Network Simulator:
Network simulators are usually used to simulate the computer networks. They are also used for simulating VANETs to evaluating the performance of network protocols in the presence of nodes’ mobility. DPOR is simulated by NS2 (ns 2.35) and its performance will be compared to TADS, ACAR, GPSR with carry and forward protocols. VANET Simulator:
The third part of our simulator is a VANET simulator which uses the mobility simulator’s output in a digital map such as TIGER (Topologically Integrated Geographic Encoding) database or Google earth. After that it uses the network simulator to be run on this generated environment. MOVE is used as VANET simulator in this study. In other words, VANET simulator acts as a connector between mobility and network simulator.
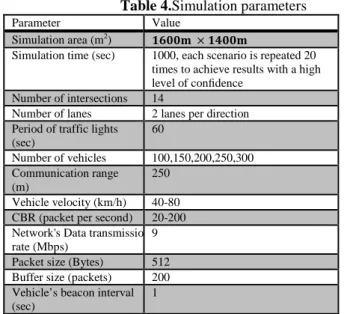
This simulation is done in a real street area with the range of 1600m×1400m. It consists of 14 intersections and 25 bidirectional roads. Average speed of vehicles is in the range of 40 to 80 kilometers per hour. This simulation is repeated in different vehicular density from 100 to 300 vehicles in this area. Each intersection is assumed to have a traffic light with duration of 60 seconds. 10 vehicles are selected to act as source nodes. They send CBR traffics in the network with the rate of 20 to 200 packets per second to fixed spots. Packets are 512 Byte long and other simulation parameters are set according to Table 4.
Packet delivery, packet loss, packet end-to-end delay are used to evaluate the performance of protocols in this study. Packet Delivery Ratio: Packet delivery ratio is defined as the number of packets received at the destination to the total number of sent packets.
As shown in Figure 2(a), GPSR with carry and forward has the lowest packet delivery ratio. It always chooses the geographically shortest path to the destination, without considering the vehicular density. Consequently, some data packets cannot reach their destination due to the low vehicular density on some sections of the road.
International Journal of Communication Networks and Information Security (IJCNIS) Vol. 7, No. 3, December 2015
Table 4.Simulation parameters Value
Parameter
IJKKL × IMKKL
Simulation area (m2)
1000, each scenario is repeated 20 times to achieve results with a high level of confidence
Simulation time (sec)
14 Number of intersections
2 lanes per direction Number of lanes
60 Period of traffic lights (sec)
100,150,200,250,300 Number of vehicles
250 Communication range
(m)
40-80 Vehicle velocity (km/h)
20-200 CBR (packet per second)
9 Network's Data transmission rate (Mbps)
512 Packet size (Bytes)
200 Buffer size (packets)
1 Vehicle’s beacon interval (sec)
According to Equation (4), which is used for utility calculation in DPOR, Euclidean distance takes a less important role rather than vehicular density and distribution. Furthermore, driving path is used to choose the next hop on the selected road. Simulation results show that the above mentioned mechanism leads to a better performance in comparison with TADS. This result was predictable because the speed of wireless transmission is much more than the vehicles’ speed and less time duration is required to forward the packet vehicle by vehicle rather than carrying the packet over geographical distance.
ACAR has a lower delivery ratio than DPOR, because it just considers vehicular density in the path selection procedure and vehicular density cannot show how uniform the vehicles are distributed on the path. Consequently, some data packets cannot reach their destination due to the problem of sparse vehicular area.
In Figure 2(b), as the vehicular density increases, GPSR with carry and forward achieves very good delivery ratio. Because, when there are more nodes in the route, connectivity increases and packets will be forwarded to the destination.
When number of the nodes becomes larger than 150, packet delivery ratio slightly increases in ACAR. Because when network density becomes larger, ACAR may choose more dense roads to forward the packets, which causes MAC layer collisions and data delivery ratio cannot significantly increase and may sometimes decrease. But in TADS, MAC layer collisions become less frequent and the results are better than ACAR. Consideration of vehicular distribution leads to such an improvement in TADS compared to ACAR. But DPOR performs better than TADS, as driving path is used to choose the next hop. And packets are not forwarded to all neighboring nodes. Next neighboring node is selected based on its driving path through the destination and this will reduce the collision probability.
Packet loss: Week wireless links are the main reason of packet loss in these protocols. When next hop is too far away or even out of the communication range of current packet holder, packet loss will be occurred. Because of the reasons that are mentioned above, GPSR with carry and forward is expected to have the highest packet loss ratio. As shown in Figure 3 simulation results confirm this expectation.
But for almost all data sending rates, DPOR and TADS lead to lower packet loss. They select the road to forward the
packet by considering vehicular density, Euclidean distance, and vehicular spatial distribution. Therefore, packets will arrive at the destination more successfully.
0 0.2 0.4 0.6 0.8 1
20 40 60 80 100 120 140 160 180 200
D
e
li
v
e
ry
ra
ti
o
Date sending rate (pkts/seconds)
DPOR ACAR GPSR+carry&forward TADS
Figure 2(a).Data delivery ratio against data sending rates
0 0.2 0.4 0.6 0.8 1
100 150 200 250 300
D
e
li
v
e
ry
ra
ti
o
Number of nodes in network
DPOR ACAR GPSR+carry&forward TADS
Figure 2(b).Data delivery ratio against number of nodes
0 0.1 0.2 0.3 0.4 0.5
20 40 60 80 100 120 140 160 180 200
F
ra
c
ti
o
n
o
f
l
o
s
t
p
a
c
k
e
ts
Data sending rate (pkts/seconds)
DPOR ACAR GPSR+carry&forward TADS
Figure 3.Fraction of lost packets due to the weak wireless link
ACAR does not consider vehicular spatial distribution in path selection procedure. Consequently, some data packets cannot reach their destination due to the problem of sparse vehicular area.
International Journal of Communication Networks and Information Security (IJCNIS) Vol. 7, No. 3, December 2015
time duration; it will take for a packet to be received at the destination.
In Figure 4(a), end-to-end packet delay is shown in different data sending rates. GPSR with carry and forward has the highest end-to-end delay because lots of packets are buffered when there is no next hop available. Since the velocity of vehicles is much slower than the speed of wireless transmission, ACAR has relatively lower end-to-end delay compared to GPSR with carry and forward. An interesting result is that when the data sending rate get closed to 170 pkt/sec or when the number of vehicles increases to 200 nodes (in Figure 4(b)); GPSR with carry and forward shows lower delay compared to ACAR. This is because of the forwarding rules in ACAR. When more packets are injected on a single route, there will be more packet collisions and longer queuing delays. In this condition, end-to-end delay will increase in ACAR.
As it is shown in Figure 4(b), as the vehicular density increases, DPOR achieves the lowest end-to-end delay because it has an efficient way of intersection selection, which guarantees packets to be sent to the destination with a lower delay. And in next hop selection stage, using of the driving path information will effectively increase the chance of finding the proper forwarding node, which reduces the number of hops involved in packet delivery and thus more desirable delay will be resulted.
0 5 10 15 20 25 30 35 40 45
20 40 60 80 100 120 140 160 180 200
E
n
d
-t
o
E
n
d
d
e
la
y
(s
)
Data sending rate (pkts/second)
DPOR ACAR GPSR+carry&forward TADS
Figure 4(a).End to End delay against data sending rates
0 10 20 30 40 50
100 150 200 250 300
E
n
d
-t
o
E
n
d
d
e
la
y
(s
)
Number of nodes in network
DPOR ACAR GPSR+carry&forward TADS
Figure 4(b).End to End delay against number of nodes
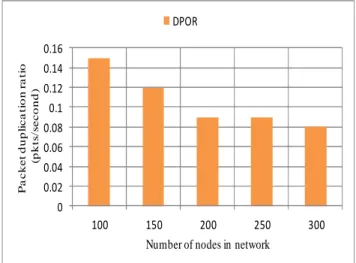
According to the next hop selection phase in DPOR, it seems that duplicate packets are received at the destination more frequently. But simulation result, shown in Figure 5, does not
confirm this claim and packet duplication ratio is low and acceptable in this protocol. As the vehicular density increases, number of neighbors whose driving path will pass the destination increases. Therefore, packet duplication ratio will become even lower in higher network density.
0 0.02 0.04 0.06 0.08 0.1 0.12 0.14 0.16
100 150 200 250 300
P
a
c
k
e
t
d
u
p
li
c
a
ti
o
n
r
a
ti
o
(p
k
ts
/s
e
c
o
n
d
)
Number of nodes in network
DPOR
Figure 5.Packet duplication in the network
6.
Conclusion
A new protocol (DPOR) was proposed in this study based on the assumption that each vehicle is capable of predicting its driving path. This vehicle trajectory prediction can provide new opportunity to forward data packets from static locations to the mobile vehicles or even between two or more mobile vehicles. This protocol is composed of two phases: intersection and next hop selection phases. A utility function is calculated for the selection of next intersection, which depends on the link quality and the Euclidean distance of the intersections to the destination with different important degrees. Vehicular density and also vehicular distribution affect the amount of link quality. After the intersection selection, proper next hop will be selected considering the neighboring nodes’ average speed, their driving path and the accuracy factor of the predicted driving paths. Simulation results showed that DPOR achieves a higher delivery ratio and lower end-to-end delay compared to other protocols such as GPSR with carry and forward, ACAR and TADS.
References
[1] T. Sukuvaara, K. Mäenpää, R. Ylitalo, H. Konttaniemi, J. Petäjäjärvi, J. Veskoniemi, M. Autioniemi, “Vehicular Networking Road Weather Information System Tailored for Arctic Winter Conditions”, International Journal of Communication Networks and Information Security, Vol. 7, No. 1, April 2015.
[2] A. K Saha, D. B Johnson, “Modeling mobility for vehicular ad hoc networks,” in proceedings of ACM International Workshop on Vehicular Ad Hoc Networks, pp. 91-92, 2004. [3] Y. Toor, P. Muhlethaler, “Vehicle ad hoc networks:
Applications and related technical issues,” in IEEE Communications Surveys, Vol. 10, No. 3, pp. 74-88, 2008. [4] H. Sadeghian, A. Farahani, M. Abbaspour,
“Overhead-controlled contention-based routing for VANETs”, International Journal of Communication Networks and Information Security, Vol. 6, No. 2, August 2014.
[5] C. Perkins, E. Belding-Royer, S. Das, “Ad hoc on-demand distance vector (AODV) Routing” Network Working Group, RFC 3561, July 2003.
International Journal of Communication Networks and Information Security (IJCNIS) Vol. 7, No. 3, December 2015
[7] B. Krap, H. Kung, “GPSR: greedy perimeter stateless routing for wireless networks,” in Proceeding of the 16th Annual International Conference on Mobile Computing and Networking (MobiCom), pp. 243-254, 2000.
[8] I. Leontiadis, C. Mascolo, “Geopps: opportunistic geographical routing for vehicular networks”, In: Proceedings of the IEEE Workshop on Autonomic and Opportunistic Communications, pp. 1-6, 2007.
[9] C. Lochert, H. Hartenstein, J. Tian, H. Fussler, D. Hermann, M. Mauve, “A routing strategy for vehicular ad hoc networks in city environments”. In Proceeding of the IEEE Intelligent Vehicular Symposium, pp. 156-161, 2003.
[10] L. Zhongyi, Z. Tong, Y. Wei, L. Xiaoming. “GOSR: geographical opportunistic source routing for VANETs”. ACM SIGMOBILE Mobile Computing and Communications Review, Vol.13, pp. 48-51, January 2009.
[11] J. Jeong, S. Guo, Y. Gu, Y. He, D. Du, “TBD: trajectory-based data forwarding for light-traffic vehicular networks”. In: Proceeding of the 29th IEEE International Conference, pp. 231-238, 2009.
[12] V. Naumov, T.R. Gross,”Connectivity aware routing (CAR) in vehicular ad hoc networks”. Proceedings of the 26th IEEE International Conference on Computer Communications, 2000.
[13] M. Gonzalez, C. Ahidalgo, A. Barabasi, “Under-standing individual human mobility patterns,” Nature, Vol. 453, No. 7196, pp. 779–782, 2008.
[14] K. Kelley, “Casual carpooling-enhanced,” Journal of Public Transportation, Vol. 10, No. 4, pp. 119-130, 2007.
[15] G. Liu, B. Lee, B. Seet, C. Foh, K. Lee, “A routing strategy for metropolis vehicular communications,” in Proceeding of International Conference on Information Networking, pp. 533-542, 2004.
[16] S. Ahmed, S. Kanhere, “A Bayesian framework for delay tolerant networks,” in Proceeding of the IEEE Wireless Communications and Networking Conference, pp. 1-6, 2010. [17] V. Namboodiri, L. Gao, “Prediction based routing for
vehicular ad hoc networks Vehicular Technology”. Vehicular Technology, IEEE Transactions, Vol. 56, No. 4, pp. 2332-2345, 2007.
[18] C. Ma, N. Liu N, “Traffic-aware data delivery scheme for urban vehicular sensor networks,” International Journal of Distributed Sensor Networks, Vol. 13, No.1, pp. 1-13, December 2012.
[19] Q. Yang, A. Lim, S. Li, J. Fang, P. Agrawal, “ACAR: adaptive connectivity aware routing for vehicular ad hoc networks in city scenarios,” Mobile Networks and Applications, vol. 15, No. 1, pp. 36-60, 2010.
[20] Z. Li, Y. Zhu, M. Li, “Practical location-based routing in vehicular ad hoc networks,” in Proceedings of the IEEE 6th International Conference on Mobile Ad hoc and Sensor Systems, pp. 900-905, 2009
[21] H. Jeung, M. L. Yiu, X. Zhou, C. S. Jensen, “Path prediction and predictive range querying in road network databases,” VLDB Journal, vol. 19, No. 4, pp. 585–602, 2010.
[22] Y. Feng, F. Wang, J. Liao, Q. Qian, “Driving path prediction based routing protocol in vehicular ad hoc networks,” International Journal of Distributed Sensor Networks, vol. 13, No. 1, pp. 1-10, January 2013.
[23] S. Schonfelder, U. Samag, “Where do you want to go today? More observations on daily mobility,” in Proceedings of the 3rd Swiss Transport Research Conference, pp. 1-33, 2003. [24] Y. Feng, Q. Qian, F. Wang, X. Fu, “Public transportation