ISSN: 1992-8645 www.jatit.org E-ISSN: 1817-3195
948
AN IMPROVED ALAMOUTI STRATEGY WITH
ENERGY-EFFICIENCY IN WIRELESS SENSOR NETWORKS
1CHENGZHI LONG, 2JIANPING LUO, 3MANTIAN XIANG, 1GUICAI YU
1School of Information Engineering, Nanchang University, Nanchang 330031, China
2
Research Institute of Computer Engineering Technology, Nanchang University, Nanchang 330031,
Jiangxi, China
3
School of Software, Nanchang University, Nanchang 330031, Jiangxi, China
ABSTRACT
Sensor nodes usually operate on small batteries with restricted sources of energy in the wireless sensor networks (WSNs). Energy efficiency is one of the most critical concerns for it. Clustered topology schedule is important method of saving energy with some advantages of managing conveniently, using the energy efficiently, and fusing the data easily. This paper gives an improved Alamouti strategy between the transmitting cluster and receiving cluster in wireless sensor networks after analyzing the model of wireless communication. In this new strategy, a scheme of transmitting nodes selection is proposed in order to improve the efficiency of transmitting. The strategy adjusts the number of nodes participating cooperative transmission according to the channel character between the data sensor nodes and sink node. Simulations show the results of energy consumption among optimal algorithm, bound algorithm and random algorithm. And the superiority of the new scheme is confirmed. Some rules are given in the process of the simulation analysis.
Keywords: Node Cooperation, Chernoff Bound, Wireless Sensor Networks, Alamouti Strategy
1. INTRODUCTION
In wireless sensor networks, Clustered topology schedule has such advantages: manage conveniently, use the energy efficiently, and fuse the data easily, etc. With good expansibility and robustness, it has become an important direction of topology study of WSNs [1].
The power consumption of sensor nodes is a critical issue since each node must operate on a single battery for several months. In addition, typical wireless channels suffer from signal fading which, for a given average transmit power, significantly reduces communication capacity and range. For a slow flat fading channel, channel coding does not help [2] and spatial diversity may be the only effective option that can either reduce the average transmitting power or increase capacity. MIMO system is another technical trend in recent years. Compared with single input single output (SISO) system, only by reasonable overhead of collaboration and multiple antennas at transmitter and/or receiver end, a huge improvement in link quality or channel capacity will be obtained[2,3].
In [4], Cui, Goldsmith and Bahai investigated the energy efficiency of MIMO and cooperative MIMO
techniques in sensor networks. They mainly consider using MIMO for diversity gain, which improves the quality of the link path. With a given BER threshold, a better link in turn requires lower SNR, and transmission energy is saved. In [5], Jayaweera proposed virtual V-BLAST MIMO based communication scheme can provide significant energy savings in wireless sensor networks. As reported in [4][6][7],such distributed MIMO techniques can offer considerable energy savings in cooperative wireless sensor networks even after allowing for additional circuit power, communication and training overheads.
949
0 10 20 30 40 50 60 70 80 90 100
[image:2.612.86.518.68.266.2]0 10 20 30 40 50 60 70 80 90 100
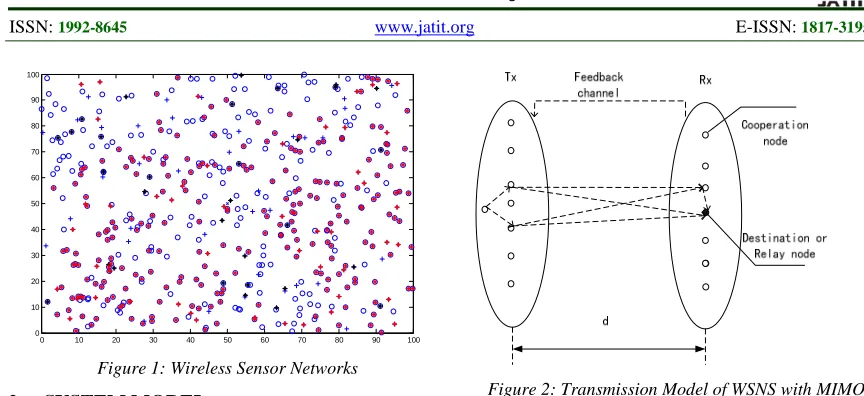
Figure 1: Wireless Sensor Networks
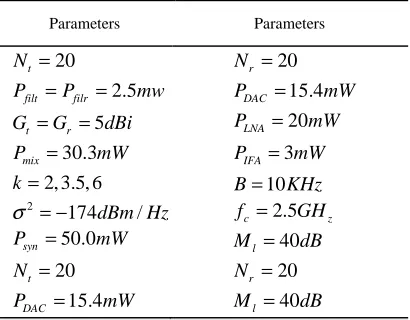
2. SYSTEM MODEL
We assume two clusters: one is transmitting cluster Tx with N nodes including t M nodes to t participate in transmitting message, and the other is receiving cluster Rx with N nodes including r
r
M nodes to participate in receiving message.
The long haul distance d between Tx and Rx is much larger than the local distance d among the m
nodes in cluster. Because ofd d , in this paper, m the energy consumption in local communication is ignored.
The availability of the CSI at the source and the destination or relays, CSI can be obtained by training sequences from transmitting cluster. As reported in [7]
We assume the wireless link in a flat Rayleigh fading environment. And the fading coefficientsh , ji
1£ i£ Nt, 1£ j£ Nr, is a Zero Mean Circulator Symmetric Complex Gaussian(ZMCSCG) random variables with unit variance.
Time synchronization is not considered in this paper. Suppose the network is good in time synchronization, the destination or relay node has more energy than cooperation node.
Figure 2: Transmission Model of WSNS with MIMO
Just like reported in [8-10], the total average power consumption along the signal path can be divided into two main components: the power consumptions of all the power amplifiers PPA and the power consumptions of all other circuit blocksPC.
Then the total energy consumption per bit for a fixed-rate system can be obtained as
( ) /
bt PA C b
E = P + P R (1)
b
R is the bit rate.
c
P is given by [3]:
( ) 2
( )
c t DAC mix filt syn
r LNA mix IFA filr ADC
P M P P P P
M P P P P P
» + + +
+ + + + + (2)
DAC
P , Pmix , PLNA , PIFA , are the power consumption values for the DAC, the mixer, the Low Noise Amplifier (LNA), the Intermediate Frequency Amplifier (IFA), respectively. AndP , filt
filr
P , PADC ,Psyn are those for the active filters at
the transmitter side, the active filters at the receiver sidePfilr, the ADC, and the frequency synthesizer
syn
P , respectively.
(1 )
PA out
P = + ¶ P (3)
In the formula ¶ = x h/ - 1 , η is the drain efficiency of the RF power amplifier and ξ is the Peak-to-Average Ratio (PAR) which is dependent on the modulation scheme and the associated constellation size [5].
out
P in the Eq.(3) is given by
2
2
(4 ) b
out b l f
t r d
P E R M N
G G p
l
= ´ (4)
ISSN: 1992-8645 www.jatit.org E-ISSN: 1817-3195
950 gain,G is the receiver antenna gain, l is the carrier r
wavelength, M is the link margin compensating the l hardware process variations and other additive background noise or interference, and N is the f
receiver noise figure[5].
3. COOPERATION STRATEGY
In order to analyze the transmitting power consumption, the channel model needs to be introduced in the first. A general case where there are 2 transmitting nodes and n(n=1,2)nodes is considered in this paper. The output signals at the n=2 receiving nodes are determined by the input through the following relationship:
* 1 2 * 2 1 x x X x x
é - ù
ê ú
=
ê ú
ë û
(5)
On the other hand, it is assumed that the system decodes with Maximum Likelihood (ML), and a correct estimation of channel can be acquired at receiving nodes, it is also known by transmitting nodes by TDD system or by feedback channel. We assume the wireless link in a flat Rayleigh fading environment. Then we could get fading matrix.
1,1 1,2
2,1 2,2
h h
h h
é ù
= ê ú
ê ú
ë û
H (6)
Whereh is ZMCSCG (Zero Mean Circulator ij
Symmetric Complex Gaussian) random variables
with E h
{ }
ij 2 = 1.At the receiving cluster, then receiving signal in participate nodes can be acquired
1,1 1,2 1 1
1
2,1 2,2 2 2
2 b
E h h x n
y
h h x n
é ùé ù é ù
= ê úê ú ê ú+
ê ú ê ú
ê úë û ë û
ë û
(7)
1,1 1,2 2 3
2
2,1 2,2 1 4
2 b
E h h x n
y
h h x n
*
*
é ù
é ù- é ù
ê ú
= ê ú + ê ú
ê ú ê ú
ê ú ë û
ë ûë û
(8) 1 n , 2 n , 3 n , 4
n are the ZMCSCG noise, representing additive white Gaussian noise sample
at the receiver.E n
{ }
i 2 = N i0( =1, 2, 3, 4)Let 1 * 2 y y y é ù = ê ú ê ú ë û
(9)
1,1 1,2 1
2,1 2,2 1 2
* *
3
1,2 1,1 2
* * 4 2,2 2,1 2 2 b b eff
h h n
h h
E x n
y
n
h h x
n
h h
E
é ù é ù
ê ú ê ú
é ù
ê ú ê ú
= ê - úê úê ú+ ê ú
ê úë û ê ú
ê - ú ê úë û
ë û
= H x+n
(10)
[
1 2]
T
x x
=
x , 1
[
1 2 3 4]
T
n n n n n
=
n , and we
also could get H 2 2
eff eff = F
H H H I
2
F
H is Frobenus norm
2 2 2 2 1 1 ij F i j h = =
=
å å
H (11)
It is assumed that the system decodes with Maximum Likelihood (ML), and a correct estimation of channel can be acquired at receiving nodes. The instantaneous receiving signal-to-noise (SNR) is given by [8]
2 0 2 b F b E N
g = H (12)
From Eq.(12), we can see that gb is
monotonically increased with 2 F
H . If we could have better channel, we could get small 2
F
H , and then get smallg , then need smallb E . b
4. EXPERIMENTAL TESTING RESULTS
[image:3.612.316.521.423.583.2]In order to validate the performance of the new algorithm, we assume 20 nodes in Tx cluster and 20 nodes in Rx cluster. Other parameter could be seen from table1.
Table 1: Table Parameters
Parameters Parameters
20 t
N = Nr =20
2.5 filt filr
P =P = mw
5
t r
G =G = dBi
15.4 DAC
P = mW
20 LNA
P = mW
30.3 mix
P = mW PIFA=3mW
2, 3.5, 6
k= B=10KHz
2 174dBm Hz/
σ = −
50.0 syn
P = mW
2.5
c z
f = GH
40 l
M = dB
20 t
N = Nr =20
15.4 DAC
P = mW Ml =40dB
951
10-5 10-4 10-3 10-2 10-1 100 10-21
10-20 10-19 10-18 10-17 10-16 10-15
Pb
E
b
J
Eb-Pb
[image:4.612.85.522.50.718.2]SISO N__S SISO random SISO bound
Figure 3: The relation of Eb and Pb in different SISO
Figure 4: The relation of Eb and Pb in different 2*1 Alamouti
10-5 10-4 10-3 10-2 10-1 100 10-22
10-21 10-20 10-19 10-18 10-17
Pb
E
b
J
Eb-Pb
2*2 alamouti N__S 2*2 alamouti random 2*2 alamouti bound
[image:4.612.91.305.69.717.2]Figure 5: The relation of Eb and Pb in different 2*2 Alamouti
Figure 6: Total of Consumption per bit in different distance
Figure 7: Energy Per Bit Vs Distance Of Three Algorithms
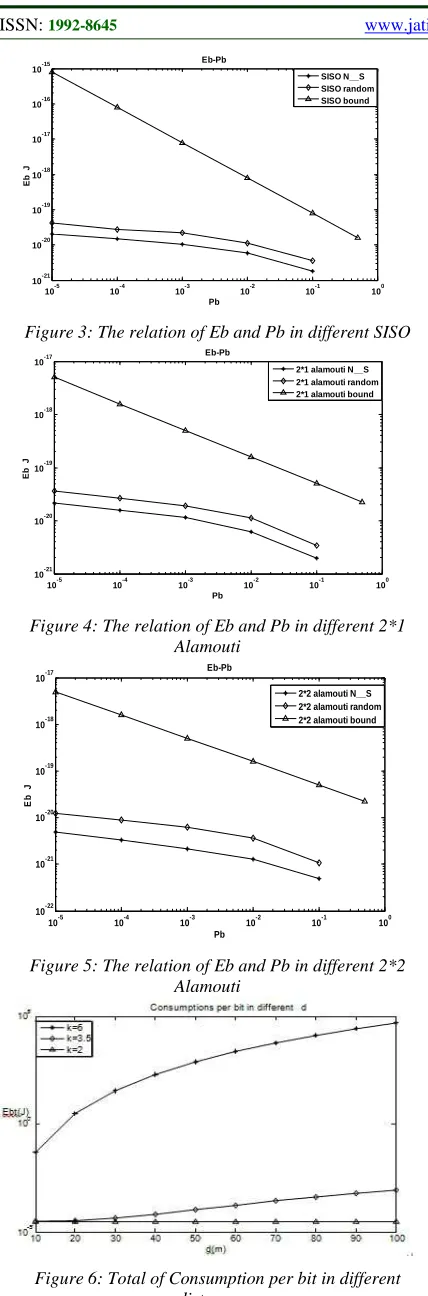
Figure 3 show the relation of Eb and Pb in different SISO(SISO N_S,SISO random, SISO bound). From the figure, we can see Chernoff bound is accurate bound in the low BER region and is loosen bound in the high BER region. In the same time, we can get the conclusion that the more high BER(Pb) ,the more Eb should be consumed. For example, Eb is 10-21, when Pb is 10-1,but when Pb is 10-5 Eb arrived is 10-20.
Figure 4 and Figure 5 show the relation of Eb and Pb in 2*1 and 2*2 Alamouti. We can get the similar result with the SISO. From the figures (3,4,5), it is shown that the advantaged of the optimal algorithm(N_S). The N_S algorithm consumes least Eb comparing with random algorithm and bound algorithm in the same Pb.
Figure 6 shows the total of consumption per bit in different distance with different k=6, 3.5, 2. We can get the result that the best environment is k=2.
Figure 7 shows the total of average power consumption Ebt. The power consumption can be divided into two main components: the power consumptions of all the power amplifiers PPA and the power consumptions of all other circuit blocksPC. It also shows that the optimal algorithm (N_S) is best in the three schemes.
5. CONCLUSIONS
Based on the node selection cooperative communication in WSNS this paper considers how to select the better node to save energy in long haul distance. According to get maximum SNR in Rx cluster, the new algorithm use feedback channel to return the ‘better’ transmitting node to Tx cluster, and then the Tx cluster could select nodes to transmit data in ‘better’ channel. This feedback method is little complexity and could be implement simply. This algorithm is suit to the scene that the
10-5 10-4 10-3 10-2 10-1 100 10-21
10-20 10-19 10-18 10-17
Pb
E
b
J
Eb-Pb
ISSN: 1992-8645 www.jatit.org E-ISSN: 1817-3195
952 clusters have a lot of nodes to participate cooperation.
ACKNOWLEDGEMENTS
This work was supported by the National Key Technology R&D Program (2012BAK17B02), as well as Science and Technology Development of Jiangxi (2009DTZ00900 20112BBE50021, 20112BBE51018)
REFERENCES:
[1] Qiu Qu, L. Milstein, D. Vaman, “Cooperative and constrained MIMO communications in wireless ad hoc/sensor networks”, IEEE Transaction on Wireless Communications, Vol. 9, No. 10, 2010, pp. 3120-3129.
[2] Sang Yang, Cheng Zhang, YuanGui Fang, “Minimum energy scheduling in multi-hop wireless networks with retransmission”, IEEE Transactions on Wireless Communications, Vol. 9, No. 1, 2010, pp. 348-355.
[3] H. Sajid, A. Anwarul, “Energy efficient virtual MIMO communication for wireless sensor networks”, Telecommunications System, Vol. 42, No. 10, 2009, pp. 139-149.
[4] A. Goldsmith, Suguang Cui, A. Bahai, “Energy-efficiency of MIMO and cooperative MIMO in sensor networks”, IEEE Journal on Selected Areas of Communications, Vol. 42, No. 10, 2009, pp. 139-149.
[5] R. Knopp, P. Humblet, “On coding for block fading channels”, IEEE Transactions on Information Theory, Vol. 46, No. 1, 2001, pp. 189-205.
[6] M. Chebolu, S. Jayaweera, V. Veera, “RLS based adaptive signal processing for energy aware sensor networks”, Proceedings of International Wireless Communications Networks Conference, IEEE Conference Publishing Services, March 25-28, 2005, pp. 312-316.
[7] Xu Li, Men Chen, Wei Liu, “Applications of STBC-encoded cooperative transmission in wireless sensor networks”, IEEE Signal Processing Letters, Vol. 12, No. 2, 2005, pp. 134-137.
[8] Yang Zhang, Wei Liu, “Energy-efficiency and transmissions strategy selection in cooperative wireless sensor networks”, Journal of Communications and Networks, Vol. 12, No. 2, 2005, pp. 134-137.
[9] Chengzhi Long, Jianping Luo, Miantian Xiang , Guicai Yu, “Study on target tracking technology based on the improved least square filter”,
Journal of Convergence Information
Technology, Vol. 7, No. 18, 2012, pp.418-424 [10] Chengzhi Long, Hui Chen, “Efficient data