735
HARMONY SEARCH ALGORITHM FOR OPTIMAL DESIGN
OF WATER SUPPLY NETWORKS
1,2LI YANG, 1JINXUE SUI, 1ZHEN HUA
1School of Information and Electronic Engineering, Shandong Institute of Business and Technology,
Yantai 264005, Shandong, China
2
Department of Control Engineering, Naval Aeronautical Engineering University, Yantai 264001,
Shandong, China
ABSTRACT
Optimization design of water supply pipe network is important with the development of economy and the increasingly fast urbanization process. Harmony search algorithm for the optimal design of water supply networks provides a better nonlinear optimization method. The improved strategy of the dynamic harmony memory size is proposed, through the optimization computation to water supply pipe network, compared with other algorithms, the improved HS algorithm in network optimization design problem has its superiority, its high speed, high efficiency, good convergence, can guarantee the stability of the global search optimization, and can provide the optimal design scheme.
Keywords: Water Supply Networks, Harmony Search, Optimization Design, Dynamic Adaptive
1. INTRODUCTION
With the development of economy and the increasingly fast urbanization process, on the one hand, large quantities of supplies and population to the city together, this put forward higher requirements to the city water supply system; on the other hand, city water supply shortage is becoming more and more serious. According to the Ministry of Housing and Urban-Rural Development of the People's Republic of China (MOHURD) report, in 2010, about 400 cities is suffering a desperate shortage of water, water shortage, amounted to 1600 cubic meters per day, the annual economic loss caused by water shortage in industry more than 230000000000 yuan. Lack of water will not only affect the industrial and agricultural production and people's daily life, and may endanger the safety of the city. With the development of the national economy growing rapidly, a sharp increase in the amount, China is expected in 2030 to appear water peak.
The water shortage means we should build on the existing foundation to save water resource, especially water supply in the densely populated city. City water supply pipe network project cost account for about 50%-80% of the entire water supply project total investment. Under the conditions of the use requirements, the minimum cost is the key in the engineering design. Water
supply project optimization design can not only reduce the investment, but also to the pump efficiency, saving water resources and so on. So it is necessary to optimize the design of water supply pipe network.
Network optimization takes the main economical efficiency as objective function, to ensure the required water pressure, under the reliable condition for the optimal economic. In the optimization of network to solve the model is relatively difficult, has gone through the linear programming model, nonlinear programming model, dynamic programming model, neural network, genetic algorithm and so on[1-4].
736
2. IMPROVED HARMONY SEARCH (IHS) ALGORITHM
2.1 The Original Harmony Search Algorithm
Harmony Search (HS) is a heuristic optimization algorithm. It was conceptualized from the musical process of searching for a ‘perfect state’ of harmony, namely the people seeks a best state (fantastic harmony) in the esthetic process through reasonable matching several kinds of musical instrument, just as the optimization algorithm seeks a best state (global optimum) determined by
evaluating the objective function. Aesthetic estimation is performed by the set of pitches played by each instrument, just as the objective function evaluation is performed by the set of values assigned by each decision variable. The harmony quality is enhanced practice after practice, just as the solution quality is enhanced iteration by iteration.
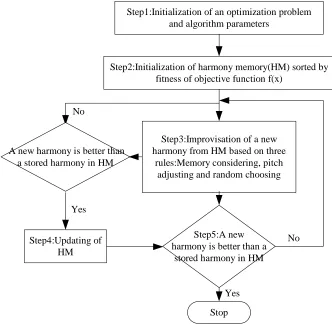
It has been shown that HS outperforms various optimization methods in many optimization problems. HS mimics the improvisation of music players for searching the better harmony. The HS step is shown in Fig. 1.
Step1:Initialization of an optimization problem and algorithm parameters
Step2:Initialization of harmony memory(HM) sorted by fitness of objective function f(x)
Step3:Improvisation of a new harmony from HM based on three
rules:Memory considering, pitch adjusting and random choosing A new harmony is better than
a stored harmony in HM
Step4:Updating of HM
Step5:A new harmony is better than a
stored harmony in HM
Stop Yes
No
[image:2.612.138.470.255.581.2]Yes No
Figure 1: Optimization Steps Of The Harmony Search Algorithm
(1) Initializing the problem and algorithm parameters including a representation of solution vectors to the problem.
(2) Creating an initial harmony memory (HM) of candidate solutions as a solution vector.
(3) Improvising a new harmony from HM.
(4) Updating the harmony memory.
(5) And, finally, checking the stopping criterion.
737 HS has four main parameters that direct the search toward the most favorable areas of the search space. These parameters are:
•Harmony memory size (HMS) represents the total number of harmonies in the HM.
•Harmony memory consideration rate (HMCR) represents the probability of picking up values from HM to the variables in the solution vector.
•Random selection rate (RSR) represents the probability of randomly choosing feasible values from the rage of all possible values to the variables in the solution vector.
• Pitch adjusting rate (PAR) represents the probability of further adjusting the pitch with neighboring pitches.
In each cycle or ‘improvisation’, each harmony is evaluated to determine its relative fitness within the harmony memory vectors; a new harmony is retained via each improvisation process. HMCR and PAR are applied to the HM in each improvisation process.
After the improvisation of the new Harmony is completed, it is evaluated by its objective function (fitness function). If the value of its objective function is better than the value of the objective function of the worst harmony in the HM, the new harmony is included in the HM and the existing worst harmony is excluded from the HM. Consequently, the vectors are sorted out based on their fitness functions. Then, the cycle repeats itself with a new harmony. After a varying number of improvisations, the algorithm converges to the best harmony, which represents a quasi-optimal or optimal solution to the given problem.
2.2 The Improved Harmony Search (IHS)
In general, the size of memory database is larger, the capability to find the globally optimal region is stronger, but because HS is starting from multiple points, with the increase of the memory storage, computation will be bigger, which affects the final search speed to optimal solution. Basic harmony search algorithm memory size is a fixed value, in this paper proposed the improved strategy of the dynamic harmony memory size, is called the improved harmony search algorithm (IHS). In the prophase, harmony memory size of M is larger, with the number of iterations increases, memory size decreases, down to a predetermined size Q (Q<M).
IHS flow chart and design steps:
Step1: Random initialization HM, its size is M;
Step2: Improved harmony search
Step2.1: Generates a random number rand1, if rand1<HMCR, then the harmony memory is selected within each musical tone, or in the musical tone range selection;
Step2.2 Generates a random number rand2, if rand2<PAR, the tone disturbance, or to maintain the original tone;
Step2.3: Through all the musical instruments; otherwise the implementation of step2.1
Step2.4: Generates N group of the new harmony, otherwise the implementation of step2.1;
Step2.5 generates a new memory HM, the size is N+M;
Step2.6: In M+N group, take out evaluation of the better value of the M group to update HM;
Step2.7: Calculating the evaluation value of the various HM;
Step2.8: If M>Q, executing step2.9, otherwise executing step2.10;
Step2.9: The memory size is M=M-1;
Step2.10: Judging whether conform to the stopping criterion; otherwise executing step2;
Step3: Stops search, output the most beautiful harmonies and evaluation value.
2.3 Improved Algorithms Test
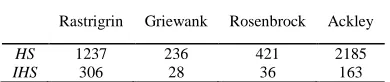
[image:3.612.321.516.557.598.2]Choosing Rastrigrin, Griewank, Rosenbrock, Ackley functions as optimization test functions, let HMCR=0.95, PAR=0.1, M=10, HS and IHS search algorithm through iterative algorithm, the number of iterations results as shown in Table 1, the improved harmony search convergence rate decreased obviously:
Table 1: Comparison Of 4 Different Functions Optimization
Rastrigrin Griewank Rosenbrock Ackley
HS 1237 236 421 2185
IHS 306 28 36 163
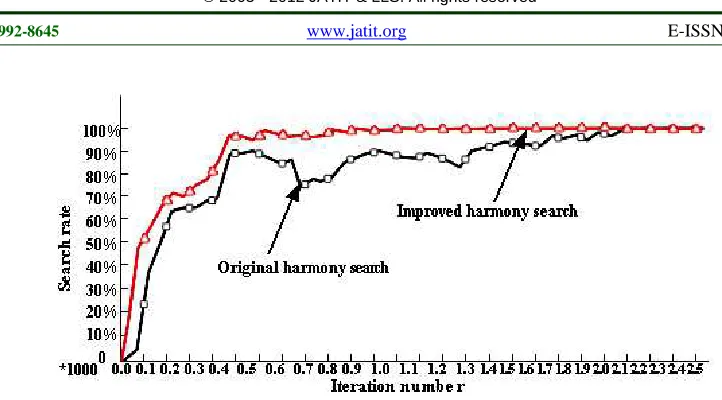
Taking the Ackley function as an example to
several optimization
tests,
∑
= +−
+
−
=
m i i ii
x
x
x
x
f
1 2 2 21
)
(
1
)
)
(
100
(
)
(
,[
−
2
.
048
,
2
.
048
]
∈
ix
, the iterative convergence738
Figure 2: The Convergence Curve Of The Harmony Search
3. IMPROVED HARMONY SEARCH ALGORITHM FOR OPTIMAL DESIGN OF WATER SUPPLY NETWORKS
3.1 The Original Harmony Search Algorithm
In the type,
a
andb
are the coefficient andindex of the unit length of pipe cost formula;
a
ij
D
ispipe diameter;
E
is energy charge, fen/kWh;Q
isthe flow of the input system in pipeline,
L /
s
;η
is the operating efficiency of pump station, usually 0.55~0.85;p
is the annual depreciation and repaircosts, %, lij is the pipeline length, m; t is the
investment repayment period, a;
β
is the variationcoefficient of water supply energy;
ρ
is the water density,ρ
=
1
kg
/
L
;g
is the gravity accelerationvalue,
g
=
9
.
81
m
/
s
2
;H
0 is the static lift pump,m;
∑
h
ij is the water head loss from the pipelinestarting point to the control point of any pipeline, m.
3.2 Constraint Condition
The objective function of water supply pipe network optimization design is built based on a
series of constraint equation, should satisfy the following conditions:
(1) Node flow equation
0
=
+
∑
Aq
Q
(1)(2) Loop energy equations
0
=
kLh
(2)In the type: L is the circuit matrix;
h
k is the column vector of the pipe head loss.(3) Pump head
∑
+
=
yp
H
h
H
0 (3)In the type,
H
pis a pump head,H
0 is a control point water pressure.(4) Nodal pressure constraint
max
min
H
H
H
≤
≤
(4)In the type,
H
minandH
max respectively is theminimum and maximum pressure values that the node requests.
(5) Pipe velocity constraint
max
v
v
≤
(5)In the type,
v
maxis the maximum of the pipeline739 11
12 10 9
2
3 4
8 7 5
1 6
[1]
[2]
[3]
[4] [6]
[7]
[9] [10]
[14]
[17] [16] [15]
[11]
[13] [12]
[5] [8]
[image:5.612.85.521.70.230.2]Node Existing pipelines Proposed pipeline
Figure 3: Network Layout Example Diagram
3.3 Simulation Example[1]
Using the established target mathematical model of optimization design and the improved harmony search algorithm, as shown in Figure 3 network to optimize the design, including pipeline and a water tower base in the plains, the gravity water supply mode, no power costs, two towers of initial water level were set to 26m, pipe made of plastic pipe, pipe head loss using the sea had William formula. Unit cost in different diameter length shown in Table 2, multiple working conditions of each node, the node with the elevation of the ground water, guarantee the water table 2 pipe sections 1 to 8 of the diameter of optimization decision variables, of which 1 to 3 to consider whether the renovation and expansion of the existing pipe, 4 to 8 for the pipe section. Water service condition, node flow and ensure the elevation of the ground water is
shown in table 3, Pipe unit length cost is shown in table 4.
This example uses the gravity water supply pipe network, the objective function is simplified, only the variable, and introducing the hydraulic related penalty function, the objective function can be modified for:
∆ × + × × =
∑
∑
= = N 1 i
max N
1 i
) Otherwise (
) constraint pressure
Satisfy (
cos
H P L C
L C
t Min
i i
i i
In the type,
i
=
1
,
2
,
K
,
N
, N is the number ofsegments, pipe,
C
i is the cost of the ith unit pipelength, Liis the length of the ith unit pip, P is the
punishment factor ( yuan/m ),
∆
H
maxis difference [image:5.612.150.461.519.701.2]between the actual pressure and the normal hydrostatic pressure.
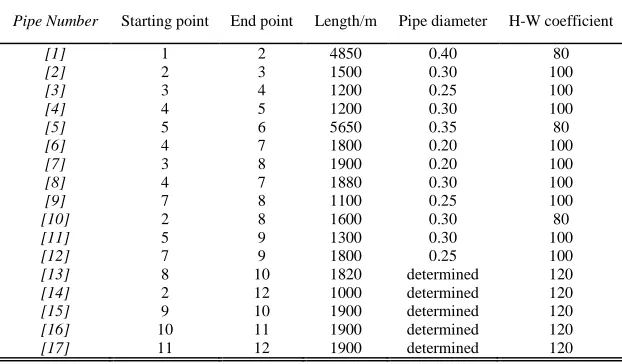
Table 2 : The Length, Diameter And Hazen- Williams Coefficient
Pipe Number Starting point End point Length/m Pipe diameter H-W coefficient
[1] 1 2 4850 0.40 80
[2] 2 3 1500 0.30 100
[3] 3 4 1200 0.25 100
[4] 4 5 1200 0.30 100
[5] 5 6 5650 0.35 80
[6] 4 7 1800 0.20 100
[7] 3 8 1900 0.20 100
[8] 4 7 1880 0.30 100
[9] 7 8 1100 0.25 100
[10] 2 8 1600 0.30 80
[11] 5 9 1300 0.30 100
[12] 7 9 1800 0.25 100
[13] 8 10 1820 determined 120
[14] 2 12 1000 determined 120
[15] 9 10 1900 determined 120
[16] 10 11 1900 determined 120
740
Table 3 : Water Service Condition
Pipe Number Starting point
Water service condition 1 Water service condition 2 Water service condition 3
Node flow (L/s) Pressure (m) Node flow (L/s) Pressure (m) Node flow (L/s) Pressure (m)
1 61.0 0 0 0 0 0 0
2 23.5 42.0 15.0 42.0 15.0 42.0 15.0
3 19.0 42.0 15.0 42.0 15.0 42.0 15.0
4 22.0 12.7 15.0 12.7 15.0 12.7 15.0
5 20.5 42.0 15.0 42.0 15.0 42.0 15.0
6 61.0 0 0 0 0 0 0
7 21.4 13.5 15.0 13.5 15.0 13.5 15.0
8 19.6 12.7 15.0 52.7 15.0 12.7 15.0
9 21.0 12.7 15.0 12.7 15.0 12.7 15.0
10 21.4 64.0 15.0 64.0 15.0 64.0 15.0
11 22.6 21.0 15.0 21.0 15.0 51.0 10.0
12 24.1 12.7 15.0 12.7 15.0 12.7 15.0
Table 4 : Pipe Unit Length Cost
Pipe diameter (mm) 200 250 300 350 400 450 500 600
Cost (yuan/m) 283.06 389.28 538.28 626.57 729.69 832.42 958.50 1214.10
Harmony memory search of
HMS
is 50,max
HMCR
is 0.96,HMCR
min is 0.88,max
PAR
is 0.25,PAR
min is 0.20, dynamic adaptive search probability is 0.8, the iteration number is 3000, and the penalty factorP
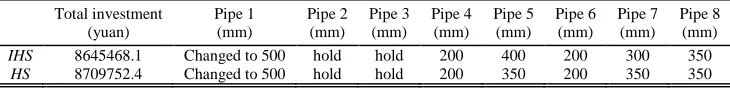
is 500000. Repeat computation is 20, achieved the same optimal solutions, and explained that theimproved HS algorithm can get global optimal solution. The improved harmony search algorithm for optimal design of investment project is shown in Table 4.
[image:6.612.124.489.464.508.2]From Table 5 shows, the objective function from 8709752.4 of HS to 8645468.1 of IHS, Optimization effect is improved obviously.
Table 5 : Improved Harmony Search Algorithm For Optimal Design Of Investment Project
Total investment (yuan)
Pipe 1 (mm)
Pipe 2 (mm)
Pipe 3 (mm)
Pipe 4 (mm)
Pipe 5 (mm)
Pipe 6 (mm)
Pipe 7 (mm)
Pipe 8 (mm)
IHS 8645468.1 Changed to 500 hold hold 200 400 200 300 350
HS 8709752.4 Changed to 500 hold hold 200 350 200 350 350
4. CONCLUSIONS
Through the optimization computation, compared with other algorithms, the improved HS algorithm in network optimization design problem has its superiority, its high speed, high efficiency, good convergence, can guarantee the stability of the global search optimization, and can provide the optimal design scheme. Therefore, the improved HS algorithm can have effect for network optimization problem, and has good application prospect.
ACKNOWLEDGEMENTS
This work is supported by NSF 60970105; education department S&T plan J08LJ70 and NSF
of Shandong Province ZR2010FL015 and ZR2010FL021; Ministry of Housing and Urban-Rural Development of the People's Republic of China (MOHURD) Development science and technology project 2010-K9-26; Department of Housing and Urban-Rural Development of Shandong province Development science and technology project 2011YK059.
REFERENCES:
[1] Lv Jian, Jia Yanbing, “Optimal Design of Water Distribution System by Genetic Algorith”,
Water and wastewater engineering, Vol.27, No.
741 [2] Zong Woo Geem, “Harmony search
optimization to the pump-included water distribution network design”, Civil Engineering
and Environmental Systems, Vol. 26, No. 3,
2009, pp. 211-221.
[3] Xin Kunlun, Liu Suiqing, Tao Tao, Li Shuping, “Application of Pseudo-Parallel Genetic Algorithm in Optimal Operation on Water Supply Network”, Journal of Tongji University, Vol. 34, No. 12, 2006, pp. 1662-1667.
[4] Zhuang Baoyu, Yang Yufei, Zhao Xin-hua, “Optimization of Water Distribution System Based on Improved Shuffled Frog Leaping Algorithm”, China water and wastewater, Vol. 27, No. 9, 2011, pp. 45-49.
[5] Z. Geem, J. Kim, G. Loganathan, “A new heuristic optimization algorithm: harmony search”, Simulation, Vol. 76, No. 2, 2001, pp. 60-68.
[6] Z.Geem, “Optimal cost design of water distribution networks using harmony search”,
Engineering Optimization, Vol. 38, No. 3, 2006,
pp. 259-280.
[7] A.Vasebi, M.Fesanghary, S.M.T.Bathaee, “Combined heat and power economic dispatch by harmony search algorithm”, Electrical
Power and Energy Systems, Vol. 29, No. 10,
2007, pp. 713-719.
[8] K.Lee,Z.Geem, “A new meta-heuristic algorithm for continuous engineering optimization: harmony search theory and practice”, Computer Methods in Applied
Mechanics and Engineering, Vol. 194, No. 36,
2007, pp. 3902-3933.
[9] Mahamed G.H.Omran, Mehrdad Mahdavi, “Global-best harmony search”, Applied Mathematics and Computation, Vol. 198, No.
2, 2008, pp. 643-656.
[10] M.Mahdavi, M.Fesanghary, E.Damangir, “An improved harmony search algorithm for solving optimization problems”, Applied Mathematics
and Computation, Vol. 188, No. 2, 2007, pp.