© 2015, IRJET.NET- All Rights Reserved
Page 632
Model Implementation and Performance Analysis of Solid Oxide Fuel
Cell as a Micro Source in Micro Grid Modelling
Subhajit Roy
consumption, rising public awareness of environmental protection and steady progress in power deregulation alternative (i.e. renewable and fuel cell based) Distributed Generation system has attracted increased interest. Fuel cell systems show great potential especially in the area of DG due to their fast technological development and merits, such as, high efficiency, zero or low emission (of pollutant gases) and flexible modular structure. Solid oxide fuel cells are a promising option for distributed energy stationary power generation that offers efficiencies up to 50% in stand-alone applications, 70% in hybrid gas turbine applications and 80% in cogeneration. In this paper we developed a model which describes and simulates the dynamic behavior of a Solid Oxide Fuel Cell (SOFC) and this model can test the dynamic response for the power demand change from 0% to 120% of the rated value. The standalone dynamic performance of the developed models is analyzed and evaluated. Results prove the effectiveness of the proposed developed model and this model can be used to describe the behavior of the Micro Grid (MG) under different disturbance conditions like load following, load shedding, unbalanced loads, failure of one micro source and so on. By using the micro sources a complete model can be built for the description of the overall dynamic performance of the Micro Grid (MG). The viability of the proposed power control mode is simulated by MATLAB/SIMULINK.
Key Words:
Dispersed Generator(DG); Micro Source,
DER; Unit Power Control (UPC); microgrid, Solid Oxide
Fuel Cell (SOFC); Dynamic response.
1. INTRODUCTION
Distributed generation is referred in general to small generators, starting from a few kW up to 10 MW, whether connected to the utility grid or used as standalone at an isolated site. Normally small DGs, in the 5- 250 kW range serve households to large buildings [1-2]. Distributed energy is generated or stored by a variety of small, grid-connected devices referred to as distributed energy resources (DER) or distributed energy resource systems. There are four realities facing future power systems that and with minimal growth of the transmission system. • Make greater use of renewable energies, such as wind and photovoltaic systems.
• Increase energy efficiency and reduce pollution and greenhouse gas emissions.
• Increase the availability of high power quality for sensitive loads.
A micro grid can be defined as a LV distribution system to which small modular generation systems are to be connected [5]. Generally, a micro grid corresponds to an association of electrical loads and small generation systems through a LV distribution network. This means that loads and sources are physically close [6]. Among such Distributed Energy Resources (DER), fuel cells show particular promise, as they can operate on multiple fuels with low emissions, high efficiency and high reliability [7]. In recent years, an interest toward fuel cell studies has grown because of increasing energy demand and fuel cells are clean and efficient sources of electricity. In this study, the electrical characteristic of solid oxide fuel cell (SOFC) is analyzed [8]. As fuel cells will likely became major Distributed Energy Resources (DERs), dynamic model is necessary to deal with issues in system planning operation and management. Fuel cells have several unique properties from a modelling viewpoint. Fuel cells offer some important benefits over other low-carbon heating technologies, and steady cost reductions through innovation are bringing fuel cells close to commercialization in several countries [9].
In fuel cells, the electrical response time of the power section is generally fast, being mainly associated with the speed at which the chemical reaction is capable of restoring the charge that has been drained by the load [10]. Conversely, the chemical response time of the reformer is usually slow, being associated with the time for the fuel cell stack to modify the chemical reaction parameters after a change in the flow of reactants [11].
© 2015, IRJET.NET- All Rights Reserved
Page 633
that describe the dynamics of induction and synchronous generators, converters, wind energy conversion systems, photovoltaic systems, fuel cells, micro turbines, battery energy storage systems and super capacitors are mainly controllers that are used to connect Distributed Generators (DG) to micro grids. In this paper, we developed Matlab® Simulink ® models to simulate a solid oxide fuel cell.
2. SOLID OXIDE FUEL CELL MODELING
Fuel cells are static energy conversion devices that convert the chemical energy of fuel directly into dc electrical energy. Fuel cells have a wide variety of potential applications including micro power, auxiliary power, transportation, stationary power for buildings, and cogeneration applications. Fuel cells have various advantages compared to conventional power sources, such as internal combustion engines or batteries [15]. The integration of the fuel cell system is to provide the continuous power supply to the load as per the demand. In the fuel cell energy system which is used for the distributed generation applications, the source is integrated with the DC – DC boost converter to stabilize
Fig.1: Block Diagram of Fuel cell energy System constant at all times. The ideal gas law is used to calculate the partial pressure of all the gases. For hydrogen is given
by. : (1)
Taking the derivative of the equation (1) w.r.t. time:
(2)
The hydrogen molar flow is further divided into three parts and their relationship can be expressed as follows
(3)
According to the electrochemical relationship, the quantity of hydrogen that react is given by.
(4)
Substituting (3) in (4), the time derivative of hydrogen partial pressure can be expressed as
(5) Taking the Laplace transforms both side and gives the expression for partial pressure of hydrogen
(6) In similar way, the partial pressure of oxygen and water is given by can be obtained applying Nernst’s equation (10) and also taking into account the voltage losses such as the Ohmic, Activation and mass transportation (concentration) losses
as: (9)
The value of the Nernst voltage equation (Efc) is found from Nernst equation
(10)
2.3
CALCULATION OF VOLTAGE LOSSES: COMPONENT1. Activation voltage losses- The reason for this loss in SOFC is the sluggishness of chemical reaction that takes place on the surface of electrodes. A certain amount of voltage produced by fuel cell is lost in carrying the reaction forward that transfers the electrons to or from the electrode. Activation losses are estimated using Tafel
equation. (11)
2. Concentration voltage losses- These losses are also known as mass transport losses and are caused due to the reduction in concentration of reactants in the region of voltage that portion of the electrode can produce.
(12)
3. Ohmic voltage losses- These losses in SOFCs are caused due to the resistance both to flow of electrons through the electrodes and to the migration of ions through the electrolyte. In addition, the fuel cell interconnects or bipolar plates also contribute to the Ohmic losses. Ohmic
© 2015, IRJET.NET- All Rights Reserved
Page 634
3. MODELLING OF SOFC
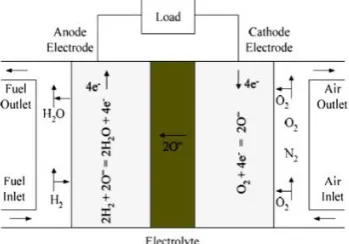
Solid oxide fuel cell is based on the concept of oxide ion migration through an oxygen ion conducting electrolyte from the oxidant electrode (cathode) to fuel electrode (anode) side. It operates at temperatures in the range of 600 – 1000ºC, which makes them highly efficient as well as fuel flexible. In case of SOFC the electrolyte is a dense solid that involves ceramic materials like Yttrium-stabilized zircon dioxide whose function is to prevent electrons from crossing over while allowing passage to the charged oxygen ions. The chemical reactions that take place inside the SOFC which are directly involved in the production of electricity.
Fig. 2: Schematic diagram of a Solid Oxide Fuel Cell
A power generation fuel cell system has the following three main parts:
(A) Fuel processor. The fuel processor converts fuels, such as natural gas, to hydrogen and by-product gases.
(B) Power section (fuel cell). The power section generates electricity. There are numerous individual electrochemical fuel cells in the power section.
(C) Power conditioner (Inverter). The power conditioner converts DC power to AC power output. In this study, we focus on the Solid Oxide Fuel Cell (SOFC) system modelling, with the expectation that the response time of other types of cell will be similar.
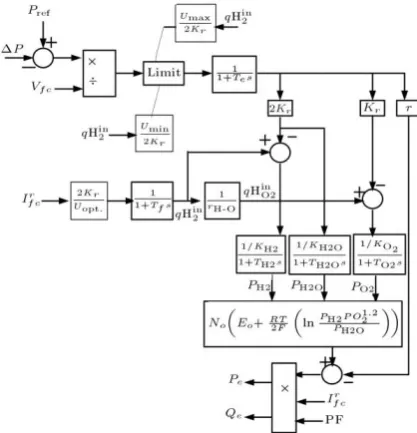
Padulles and Aulf [10] provided a basic SOFC power section dynamic model used for performance analysis during normal operation. Based on that, some control strategies of the fuel cell system, response functions of the fuel processor and the power section are added to model the SOFC power generation system (all symbols are defined in the Table1)
(D) Although CO can be a fuel in SOFC, the CO shift reaction is chemically favored with the present designs and operations if the fuel gas contains water. The CO-shift reaction is: CO + H2O CO2 + H2 (14) For a certain input hydrogen flow, the demand current of the fuel cell system can be restricted in the following
range: (17)
(E) The real output current in the fuel cell can be measured, so that the input fuel flow can be controlled to
control Uf (fuel utilization) at 85%, so: (18) (F) So, the ratio of Hydrogen to Oxygen is 2 to 1. Oxygen excess is always taken in to let Hydrogen react with Oxygen more completely. Simulation in our fuel cell system shows that rH-O (ratio of Hydrogen to Oxygen) should be kept around 1.145, in order to keep the fuel cell pressure difference below 4 kPa under normal operation. So, the input Oxygen flow is controlled to keep rH-O at 1.145 by speed control of the air compressor.
(G) The chemical response in the fuel processor is usually slow, as it is associated with the time to change the chemical reaction parameters after a change in the flow of reactants. This dynamic response function is modeled as a first-order transfer function with a 5 time constant. (H) The electrical response time in the fuel cells is generally fast and mainly associated with the speed at which the chemical reaction is capable of restoring the charge that has been drained by the load. This dynamic response function is also modeled as a first order transfer function, but with a 0.8 time constant.
(I) Through the power conditioner (inverter), the fuel cell system can output not only real power but also reactive power. Usually, the power factor can be in the range of 0.8-1.0. Based on [10] and the above discussions, the SOFC system dynamic model is given in Figure 10 where Oxygen input flow.
Pref Real power Reference 100 kW
Vrate Rated voltage 333.8 V
T Absolute Temperature 1273 K
F Faraday's constant 96487 C/mol
R Universal gas constant 8314J/(kmolK)
E0 Ideal standard potential 1.18 V
N0 Number of cells in series in
stack
© 2015, IRJET.NET- All Rights Reserved
Page 635
Kr Constant, Kr = N0/4F 0:996*10-6 Kmol/(sA)
Umax Maximum fuel utilization 0.9
Umin Minimum fuel utilization 0.8
Uopt Optimum fuel utilization 0.85
Valve molar constant for hydrogen
8.3*10-4 kmol/(s atm)
Valve molar constant for water 2.81*10-4 kmol/(s atm)
Valve molar constant for oxygen 2.52*10-4 kmol/(s atm)
Response time for hydrogen flow
26.1s
Response time for water flow 78.3 s
Response time for oxygen flow 2.91 s
R Ohmic loss 0.126 Ω
Te Electrical response time 0.8 sec
Tf Fuel processor response time 5 sec
rH-O Ratio of hydrogen to oxygen 1.145
PF Power factor 1.0
Table.1:Parameters of SOFC model.
The fuel cell demand current
(
)
is calculated by dividing power demand by fuel cell voltage(
).
Equation 17 determines the limits of the fuel cell demand current as shown in the block diagram. The fuel cell demand current is treated through a transfer function with time constant T s which represents the electrical time constant. The fuel cell demand current multiplied by ohmic resistance (r) determines the internal voltage drop. The fuel cell demand current multiplied by constant2 ( =N0/4F),
treated through a transfer function of gain equal to(1/KH2O)
and a time constant equal to TH2O determines the pressure of water as shown in the block diagram. With the same method, fuel cell current can be treated through transfer functions with time constants dependent on the valve molar constant of Oxygen and Hydrogen and with time constants equal to the response time of Oxygen and Hydrogen flow; this method can decide the pressure of Oxygen and Hydrogen inside the fuel cell. By knowing water, Oxygen and Hydrogen pressures, voltage produced inside the fuel cell can be calculated, as shown in the block diagram. If the internal voltage drop caused by ohmic resistance (r) is subtracted from the voltage produced inside the fuel cell, net output voltage can be calculated. By knowing the fuel cell load current (current output fromthe fuel cell), the active power produced by the fuel cell is calculated. Reactive power can be decided by the power factor of the inverter, which is used to interface the fuel cell to the MG.
Figure 3. SOFC system dynamic model.
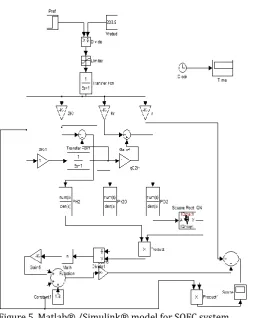
4. MATLAB SIMULINK MODEL OF SOFC
In this paper, the rated power of the SOFC system is 100 kW. All model parameters are listed in Table.1, Details of the developed model for implementation of the SOFC in the Matlab® Simulink® environment are shown in Figure.5 shows the model block diagram, input and output terminals. The input terminals are Pref (desired power) and rated voltage, Vratd. The output terminals are the fuel cell electrical output, active and reactive power. The amount of reactive power depends on the power factor of the inverter that is used to interface the SOFC with the MG.
© 2015, IRJET.NET- All Rights Reserved
Page 636
Figure 5. Matlab® /Simulink® model for SOFC system.
4. EVALUATION OF STAND ALONE PERFORMANCE OF SOFC IN A MICRO GRID SYSTEM
It is assumed that the stand-alone SOFC system is operating with constant rated voltage, 1.0 p.u. (333.8 V), and power demand, 0.7 p.u. (70 kW). All parameters of the system are the same as in Table. At t = 100 sec, there is a step increase of the power demand from 0.7 p.u. (70 kW) to 1.0 p.u. (100 kW). Figure 6 shows the dynamic response of this system. Figure 7 shows the dynamic response of the SOFC when there is a decreasing in power demand from 0.7 p.u. (70 kW) to 0.4 p.u. (40 kW).
Figure 6. Response of SOFC when increasing power demand from 0.7 p.u. to 1.0 p.u
Figure 7. Response of SOFC when decreasing power demand from 0.7 p.u. to 0.4 p.u.
From simulation results, the following points can be raised:
(i) Pe (output electrical active power) increases slowly and continuously until reaching the demand power. (ii) From Figure 6, Pe will decrease slowly until reaching the desired value.
(iii) In both cases, the response time of the fuel cell is about 25-30 sec.
(iv) In the first case, the output voltage of the fuel cell suffers from some decreasing, especially during power raising; while, in the second case, the voltage has some increasing during power decreasing.
(v) Results show that the SOFC has some slow dynamic response, so that using SOFC alone may be not suitable for systems that need a fast dynamic response.
(vi) In this case, use of a Micro Turbine or a fly wheel type generating source can be proved profitable with the SOFC to deal with a fast system response.
[A] SIMULATION MODEL OF SOFC BASED DG SYSTEM
© 2015, IRJET.NET- All Rights Reserved
Page 637
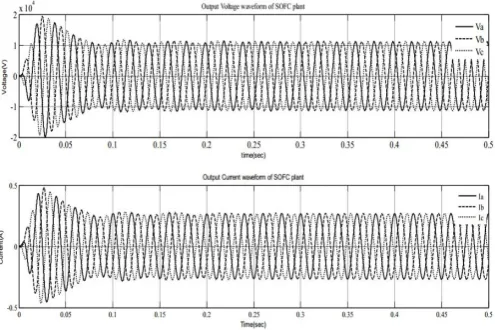
Figure 8. Simulink model of SOFC based DG system. The output inverted voltage and current waveform of SOFC based distributed generation system are shown in figure 9.
Figure 9. Output voltage and current waveform of SOFC plant
[C] Fuel cell Plant connected to the grid during L-G Fault
Here the Figure 10. shows voltage and current waveforms when with fuel cell plant to the grid during L-G fault, respectively. Single line to ground fault takes place on the grid during time period t=0.1 to 0.3 Sec. During fault we have analysed the parameters such as voltage, current and checked the system stability. It is clear from the above fig.8 that voltage profile is considerably improved after fuel cell plant interconnected with the grid. The various data of voltage and current are shown in table.2. After connecting the fuel cell plant system to the existing system we can say that power system stability is being improved.
Figure 10: Simulink model with fuel cell plant during L-G fault
Figure 11: voltage and current waveform with fuel-cell plant during L-G fault.
Voltage Without fuel-cell plant
With fuel-cell plant
V (nom.) 11.03Kv 11.04Kv
I (nom.) 941.9A 933.1A
V (fault) 7.813Kv 7.821Kv
I (fault) 7283.33 Amp. 7250.85Amp. Table.2: Values of voltage and current without and with fuel cell plant under normal and faulty condition.
5. CONCLUSION
© 2015, IRJET.NET- All Rights Reserved
Page 638
connected to 11Kv grid through an AC bus. Simulation studies have been carried out to verify the system performance under faulty condition. Simulation results show that after combining fuel cell system the system’s stability is considerably improved as compared to using just fuel cell power.
ACKNOWLEDGEMENT
I like to thanks to my guide Sanjoy Kumar Saha, for his assistance and guidance throughout this work in different ways.
REFERENCES
[1] Caisheng and M.hashem, “Power management of a stand alone Wind/Photovoltaiv/Fuell Cell Energy System”,IEEE Trans. On energy conversion, Vol.23,No.3,2008, PP 957-967.
[2] Roy Subhajit, Saha Sanjoy Kumar, 2015. Implementation of Model to Analyse the Performance of Microturbine as a Dispersed Generator in Micro Grid, International Journal of Engineering Research & Technology , vol-04, iss-2,February, pp-852-856. [3] Lasseter, R.H. “Dynamic distribution using
Distributed Energy Resources (DER):, Panel on Rethinking T&D Architecture for a DER Environment: IEEE PES T&D Meeting, Dallas (2006).
[4] Kazemi, A. and Karimi, E. “The effect of an Interline Power Flow Controller (IPFC) on damping inter-area oscillations in interconnected power systems", Industrial Electronics, 2006 IEEE International Symposium on (Volume:3 ),Montreal.
[5] Lopes, J.P. et al. “DD1-emergency strategies and algorithms", Microgrids Project Deliverable of Task DD1 (2004).
[6] El-Sayed, A.G. ; Obara, S. “Power generation efficiency of photovoltaics and a SOFC-PEFC combined micro-grid with time shift utilization of the SOFC exhaust heat”, Power Electronics Conference (IPEC), 2010 International, 2010 , Page(s): 2629 – 2636.
[7] Zhu, Y. and Tomsovic, K. “Development of models for analyzing the load-following performance of microturbines and fuel cells", Electric Power System Research, 62, pp. 1-11 (2002).
[8] Fedakar, S.; Bahceci, S. ; Yalcinoz, T. “Modeling and simulation of SOFC using PSCAD”, EUROCON, 2013 IEEE, Zagreb, July 2013, Page(s):1058 – 1065.
[9] Paul E. Dodds a; Iain Staffell; Adam D. Hawkes; Francis Li a; Philipp Grunewald; Will McDowall;Paul Ekins; “Hydrogen and fuel cell technologies for heating: A review”, Science Direct, Elsevier, International Journal of Hydrogen Energy 40 (2015) Page:2065-2083.
[10]Dodds PE, Hawkes A. The role of hydrogen and fuel cells in providing affordable, secure low-carbon heat.
London, UK: H2FC SUPERGEN; 2014.
http://dx.doi.org/10.13140/2.1.2439.9686.
[11]Henke, M., Willich, C., Westner, C., Leucht, F., Kallo, J., Bessler, W. G. and Friedrich, K. A. (2013), “A validated multi-scale model of a SOFC stack at elevated pressure”, Wiley Online Library, Fuel Cells Volume 13, Issue 5, pages 773–780, October, 2013.
[12]Manzar Ahmed; Uzma Amin; Suhail Aftab; Zaki Ahmed; “Integration of Renewable Energy Resources in Microgrid”, SciRes, Energy and Power Engineering, 2015, 7, Page:12-29,
[13]Padulles, J. and Ault, G.W. et al. “An integrated SOFC plant dynamic model for power systems simulation", J. Power Sources, 86, pp. 495-500 (2000)
[14]Kwang Y.Lee, “The effect of DG using Fuel Cell under deregulated electricity energy markets”, Power Engineering Society General Meeting, IEEE, 2006. [15]A. K. Saha, S.Chowdhury, C.T.Gaunt “Integration of
Wind Turbine, SOFC and Microturbine in Distributed Generation”Power & Energy Society General Meeting, 2009. PES '09. IEEE.
[16]Nagpal, M. and Moshref, A. et al. “Experience withtesting and modeling of gas turbines", Proceedings of the IEEE/PES Winter Meeting, Columbus, Ohio,USA, pp. 652-656 (2001).