TSIRNIKAS, AMBER LOUISE. Sweetpotato Shape Analysis Using a Laser Scanner on Different Nitrogen Applications. (Under the direction of Dr. Michael Boyette).
Fruit and vegetable selections by consumers are primarily based on the perceived quality appearance of the items. Since beauty is indeed in the eye of the beholder, “well shaped” or “pleasingly shaped” produce are subjective and qualitative terms. Despite the fact that producers strive to please the eye of the consumer, it is difficult to control factors that are difficult to measure. Sweetpotatoes are one of the most variable produce items in terms of shape and size. It is believed that sweetpotato varieties tend toward symmetrical shapes, but that various cultural conditions can influence the shapes in numerous ways. Yet, to date, these assertions remain untested with objective and quantitative approaches.
In order to effective influence shape and size, it is essential then to objectively measure sweetpotatoes in a way that is accurate and repeatable. Describing an object approaching a regular shape (sphere, cylinder, cone, rectangular solid etc.) is easy and generally precise enough for everyday use. On the contrary, irregular shapes that do not approximate any regular shape or combination of regular shapes may be difficult to describe mathematically. Sweetpotatoes can range from nearly round, to excessively long, to excessively curved, with flat sides or fluted sides to a combination of all these and more. This study uses two 3D capture scanners with a rotating platform and proprietary Geomagic™ software for data analytics. In use, the
should prove valuable in fine-tuning sweetpotato production and use efficiency. For the purpose of this study, morphologic characteristics of six varieties of four different nitrogen fertilizer treatments were quantified by two analysis platforms: Matlab and Analysis Export. Both systems produced similar results, but the Matlab method provided quicker and more consistent results and were used for statistical purposes. Both methods take the 3D image imported from the two Capture scanners and the Geomagic software, determine the central axis, and take slices perpendicular to the axis to perform calculations on size and shape. Using a mixed-design analysis of variance, size and shape characteristics were analyzed for significant differences across the different varieties and nitrogen treatments. Significant differences were found among the varieties for all size and shape characteristics for both the 2016 and 2017 crop years.
However, the effect of nitrogen only produced significant differences for straight length, curved length, and length-to-width ratio in the 2016 crop year. No significant differences were observed for the interaction between variety and nitrogen treatment. These results suggest that sweetpotato variety ultimately dictates the degree of variability observed in sweetpotato shape and size. However, these results are only preliminary, and further data are needed to form strong
by
Amber Louise Tsirnikas
A thesis submitted to the Graduate Faculty of North Carolina State University
in partial fulfillment of the requirements for the degree of
Master of Science
Biological and Agricultural Engineering
Raleigh, North Carolina 2018
APPROVED BY:
_______________________________ _______________________________ Dr. Michael D. Boyette Dr. Natalie Nelson
Committee Chair
DEDICATION
BIOGRAPHY
Amber Tsirnikas was born in Gainesville, Florida on March 10, 1994. She grew up in Lake County, Florida where her parents and younger brother still reside. Amber attended Umatilla High School from 2009 to 2012. She took many honors courses as well as dual enrollment classes at Lake Sumter State College. She was also actively involved in FFA and 4H, which is where her interests in agriculture grew immensely.
Amber enrolled at the University of Florida for her undergraduate degree in
Biological Engineering with a concentration in Agricultural Production in 2012. There she studied abroad in Germany for a summer and was enrolled in the 4/1 program, in which graduate level courses are intended to count towards both a master’s degree and bachelor’s degree. She graduate magna cum laude in 2016.
ACKNOWLEDGMENTS
I would like to thank Dr. Michael Boyette for all of his knowledge and guidance. I could not have been blessed with a better advisor. I know this research has been a long time coming but I am so happy I could be a part of it.
I would also like to thank Dr. Natalie Nelson and Dr. Edgar Lobaton for being on my committee and contributing to this project. Dr. Edgar Lobaton developed the Matlab script that was extremely difficult to find someone with the knowledge and skillset to do so. Dr. Natalie Nelson’s expertise in statistics, understanding of the data, and great visualizations were more helpful than I could have asked for. I cannot thank you both enough for the amount of time and assistance you put into this research.
TABLE OF CONTENTS
LIST OF TABLES ... vii
LIST OF FIGURES ... viii
CHAPTER 1: Literature Review ... 1
Introduction ... 1
Why Shape is Important ... 3
Field Sorting ... 4
Current Approach to Shape Estimates and Selection ... 6
Nitrogen Influences on Shape Studies ... 9
Conclusion ... 13
CHAPTER 2: A System to Measure Size and Shape ...15
Describing Shape ... 15
Some Shape Characteristics ... 17
Length ... 17
Diameter ... 19
Roundness ... 20
Volume ... 21
Surface Area ... 21
Taper ... 22
Size and Shape Analysis System ... 22
Prior Work on Sweetpotato Measuring Systems ... 23
The Current System ... 25
Output Data from Scans of Individual Sweetpotatoes ... 26
The Next Step in the Analysis ... 30
Accuracy ... 30
Conclusion ... 31
CHAPTER 3: Correlations of Size and Shape in Sweetpotatoes ... 33
Introduction ... 33
Procedures ... 33
Results ... 38
Statistics ... 43
Discussion ... 44
Conclusions ... 46
REFERENCES ... 48
APPENDICES ... 51
Appendix A: Scanning Protocol ... 52
Appendix B: Sweetpotato Grading Standards, Visual Aids, and Inspection Instructions ... 60
Appendix C: 2016 and 2017 Results Density Plots ... 107
LIST OF TABLES
Table 1 U.S. Department of Agriculture Sweetpotato Grades ... 2
Table 2 Coefficient of Variation by Variety ... 41
Table 3 Percent of Ideal Ranges by Variety ... 41
Table 4 Percent of U.S. No. 1s by Variety ... 42
Table 5 2016 P-Values from ANOVA ... 43
LIST OF FIGURES
Figure 1 General Shape Characteristics of an "Ideal" Sweetpotato ... 16
Figure 2 Straight Versus Curved Length ... 18
Figure 3 Maximum Transverse of a Cross Section ... 19
Figure 4 Roundness of a cross section is defined as the standard deviation of the lengths of each ray from the centroid of that cross section ... 21
Figure 5 A mechanical stylus based sweetpotato measuring system developed in 2013. 1 and 2- linear transducers, 3 digital stylus, 4. rotary encoder ... 23
Figure 6 Keyence LJ-V7300 laser scanner with a sweetpotato being scanned on the turntable and computer screen showing scanned data ... 24
Figure 7 Capture scanners and turntable setup during calibration with the partifact. ... 26
Figure 8 Matlab Output Visualization of an Individual Sweetpotato ... 28
Figure 9 2017 Sweetpotato Nitrogen Yield, Efficiency, and Shape Study ... 35
Figure 10 2017 Plot Layout ... 36
Figure 11 Example of Curvature Values with Images for Individual Sweetpotatoes ... 39
Figure 12 Example of Length-to-Width Values with Images of Individual Sweetpotatoes. ... 40
Figure 13 2016 Straight Length (inches) Density Plot ... 107
Figure 14 2016 Curved Length (inches) Density Plot ... 108
Figure 15 2016 Curvature Density Plot ... 109
Figure 16 2016 Maximum Transverse (inches) Density Plot ... 110
Figure 17 2016 Length-to-Width Ratio Density Plot ... 111
Figure 18 2016 Surface Area (inches2) Density Plot ... 112
Figure 19 2016 Volume (inches3) Density Plot ... 113
Figure 21 2017 Straight Length (inches) Density Plot ... 115
Figure 22 2017 Curved Length (inches) Density Plot ... 116
Figure 23 2017 Curvature Density Plot ... 117
Figure 24 2017 Maximum Transverse (inches) Density Plot ... 118
Figure 25 2017 Length-to-Width Ratio Density Plot ... 119
Figure 26 2017 Surface Area (inches2) Density Plot ... 120
Figure 27 2017 Volume (inches3) Density Plot ... 121
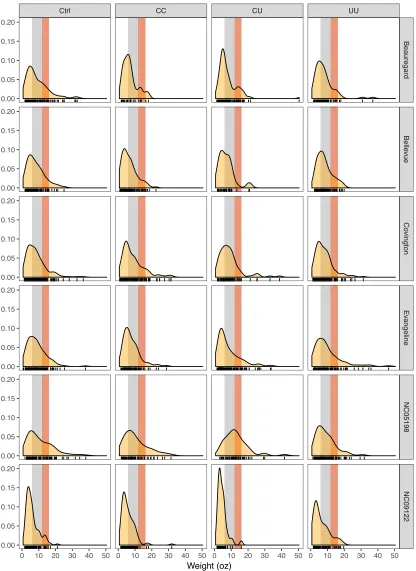
Figure 28 2017 Weight (ounces) Density Plot ... 122
Figure 29 2016 Straight Length (inches) Pairs Variety Plot ... 123
Figure 30 2016 Straight Length (inches) Pairs Nitrogen Plot ... 124
Figure 31 2016 Curved Length (inches) Pairs Variety Plot ... 125
Figure 32 2016 Curved Length (inches) Pairs Nitrogen Plot ... 126
Figure 33 2016 Curvature Pairs Variety Plot ... 127
Figure 34 2016 Max Transverse (inches) Pairs Variety Plot ... 128
Figure 35 2016 Length-to-Width Pairs Variety Plot ... 129
Figure 36 2016 Length-to-Width Pairs Nitrogen Plot ... 130
Figure 37 2016 Surface Area (inches2) Pairs Variety Plot ... 131
Figure 38 2016 Volume (inches3) Pairs Variety Plot ... 132
Figure 39 2017 Straight Length (inches) Pairs Variety Plot ... 133
Figure 40 2017 Curved Length (inches) Pairs Variety Plot ... 134
Figure 41 2017 Curvature Pairs Variety Plot ... 135
Figure 42 2017 Max Transverse (inches) Pairs Variety Plot ... 136
CHAPTER 1: Literature Review Introduction
Sweetpotatoes are a significant global food commodity. They are a staple food in many areas of the world and are enjoying an increase in popularity connected to their health and culinary benefits. In the United States, sweetpotato production has doubled in the last twenty years. North Carolina leads the country producing 1.7 billion pounds of
sweetpotatoes, which is the largest amount ever produced (Tippett, 2017). Sweetpotatoes find their way into a number of markets including the retail grocery trade, restaurants and
processing into a wide variety of food products. Approximately 40% of North Carolina production is now exported primarily to Europe.
Sweetpotatoes are generally marketed based on the United States Department of Agriculture grade standards. However, in the last two decades, these grades have been subdivided as the market has demanded finer and more precise grading. A large percentage of US sweetpotatoes are now graded with high-speed computerized grading machines with the capability of producing a very uniform pack.
Table 1: U.S. Department of Agriculture Sweetpotato Grades
Weight (ounces) Length (inches) Diameter (inches)
Canners <18 <3 <1.75
US Extra #1 <18 3 – 9 1.75 - 3.25
US #1 <20 3 – 9 1.75 – 3.5
US #1 Petite - 3 – 7 1.5 – 2.25
US #2 <36 - >1.5
Jumbos >36 - -
Size and shape are the major factors determining the value of an individual
sweetpotato. For example, a 40-pound carton of U.S. No. 1 sweetpotatoes might sell for $16-18; U.S. No. 1 petites for $12- $14; U.S. No. 2s for $8-10; and no grade marks jumbos for $8-10 (Sweet potatoes commodity pricing. 2016). Often, overly small, overly large or misshaped sweetpotatoes have difficulties finding a market that will recoup transportation costs.
Sweetpotatoes are storage roots and do not mature or ripen as a fruit would. Sweetpotatoes will continue to grow within limits as long as they have an agreeable environment. There are numerous instances where harvest was delayed by rain on an
how factors such as variety, fertilization, irrigation, soil type, time of planting and harvesting, etc. will affect the size and shape of a sweetpotato can help optimize their production and results in a greater number of sweetpotatoes selling for the best price, maximizing value for growers and value to consumers.
This paper will explain why the shape and size of a sweetpotato is important, summarize some past research on the size and shape of sweetpotatoes and detail recent attempts to design an accurate and practical sweetpotato scanner. Lastly, this paper will discuss some findings from a recent study on the type and timing of fertilizer on the size and shape of several common commercial sweetpotato varieties.
Why Shape is Important
conducted a study of consumer preferences for sweetpotatoes that showed that producers would benefit greatly if they produced the types and varieties desired (Abrahamsen, 1949). However, there is a lack of definitive standards for the shape of a good looking sweetpotato. The United States Department of Agriculture does provide certain mathematical standards but it hardly describes the actual shape of the root in any way that is objective and precise. They do, however, provide visual aids to accompany the grade standard for sweetpotatoes to show what is “fairly well shaped” and what is “not fairly well shaped.” What the USDA considers “well shaped” and what the consumer considers “well shaped” may not always be the same thing and may be subject to change over time.
Based on consumer perceived preferences and numerous sweetpotato “beauty
contests” held at agricultural fairs, the ideal and “well shaped” sweetpotato generally has the following characteristics:
1. A length of approximately 6 inches.
2. A maximum diameter of approximately 2.4 inches.
3. Approximately round in all cross sections perpendicular to the long axis. 4. Little to no curvature along the long axis.
5. Cylindrical with rounded shoulders on the apical end and tapering to rounded shoulders on the distal end.
6. A surface that is smooth and of a uniform color.
Field Sorting
size. As harvest time nears, the grower will sample the fields to closely monitor the roots as they continue to “size up”. The ideal harvest time is the point when the greatest percentage of the roots are judged to be US#1. Harvesting too early will both reduce the yield in terms of bushels per acre and the value of the yield because much of the yield is in the form of lower valued small canner sweetpotatoes. On the other hand, harvesting too late because of
excessive rains or labor shortages may yield a very large crop yield-wise but the value may be reduced by much of it being in the lower valued jumbo size sweetpotatoes. There have been instances where rains have delayed the harvest of fields to the point where, despite a huge yield, the value of the oversized roots barely make harvest profitable.
When all the harvestable sweetpotatoes are comingled into the same pallet bins, they are referred to as “field run”. This is rarely done because it later makes the packing line sorting much more inefficient and logistically complicated. Therefore, sweetpotatoes are roughly field sorted at harvest into two (or rarely three) sorts. These are either canners and US#1s or US#1 and jumbos depending on the general size distribution of the particular field. The handling logistics and lower worker productivity of field sorting into more than two sorts are cost prohibitive. When sweetpotatoes are harvested, the ones that are not deemed
Current Approach to Shape Estimates and Selection
Thirty-six hundred years ago, the Egyptian scribe, Ahmose, observed that “Accurate reckoning is the key to all knowledge”. In modern times, this notion has been stated as “you cannot know (or control) what you cannot accurately measure.” With this idea in mind, some of the first attempts to accurately measure the size and shape of sweetpotatoes began in 2004, in the Department of Biological and Agricultural Engineering at North Carolina State
University. A Master of Science thesis was completed that demonstrated the use of a high-speed camera taking multiple pictures of a rotating sweetpotato in order to digitize surface contour(Mummert, 2005). From the surface geometry, shape factors like crook, taper and length to width relationships could be derived. The primary aim of the research was to develop the hardware, software and the analytical methods to describe the shape of
sweetpotatoes. Although the project was successful in regards to the stated goals, the long-term aim of the project was to use this equipment to help sweetpotato breeders select clones for proper shape. Unfortunately, because of the lack of funds and the lack of a suitable candidate to carry on the work, this line of research was shelved.
regression analysis between the two volumes showed that they were approximately equal. Using 95% confident intervals, the variances in the volumes calculated from the laser
micrometer were smaller than the volumes calculated from the graduated cylinder. Therefore, this laser micrometer system is able to read the volumes of sweetpotatoes with high accuracy and resolution (Eguchi, Kitano, & Eguchi, 1997).
Mississippi State University stated that “accurate grading is very important, and mapping of grade in addition to yield would be advantageous because it could aid in
determining the effects of localized conditions like soil texture and fertility on not only yield but also the proportion of the U.S. No. 1s” (Gogineni et al., 2002). To help overcome this problem, Mississippi State University proposed an image-based technique that would
determine sweetpotato grade and yield. The design requirements for this system were to have images of sweetpotatoes as they are harvested as well as position data. The software used Borland C++ Builder version 5.0 that has a graphical user interface to open image files and perform image processing algorithms to detect and evaluate sweetpotatoes. The system also allowed the user to visualize some of the steps in the software grading process. The system calculate area by counting the number of pixels belonging to the sweetpotato in the image. Rectangular width and height were calculated from a rectangle drawn around delineated sweetpotatoes in the image’s principal directions. Length was calculated by considering the sweetpotatoes as ellipse and extracting their major and minor axes. Using these
misclassified by the system and for field testing, the soil needed to be very dry so that little or none adhere to the harvested roots.
A study to explore the use of machine vision to develop a yield and grade monitor for sweetpotatoes was done by deriving a relationship between image based size and shape of sweetpotatoes and their grade and weight (Wooten and Thomasson, 2000). This image acquisition system was mounted on a sweetpotato harvester and images were captured with a standard USB camera on a dark background. The sweetpotatoes in the images were first manually outlined and filled in with white. Linear discriminant and regression analysis were applied to estimate grade and weight of the sweetpotatoes from the size and shape features that were extracted from the images. The results display a strong correlation between estimated and actual weight.
Another example of automation to inspect produce is the use of artificial neural networks (ANNs) in machine vision inspection of Irish potatoes (Deck et al., 1992). Deck et al. compared the performance of the Fisher linear discriminant function with the back prorogation neural network to sort potatoes for greening, shape, and shatter bruise. This was done by selecting, imaging, and labeling potatoes to be placed manually in a lighting
potatoes both stationary and moving on a conveyor belt by approximately 10 percent (Heinemann et al., 1996).
Alchanatis and Searcy also used a system with neural networks to inspect carrots for shape and surface defects. The system classified carrots into two classes with irregular surfaces considered as defects. The image processing system extracted the carrot’s physical structure. An accuracy of over 90% was achieved at a grading speed of 2 carrots per second (Alchanatis and Searcy, 1995).
The University of California, Davis, developed a multi-camera, multiprocessor system to sort prunes for surface detects by storing images and using an algorithm to analyze and classify the images (Delwiche et al., 1993). Prunes considered defective were removed from the inspection chamber by an air jet. The system would sort the prunes at a rate of 20 fruit per second with a spacing of about 4 inches between the prunes. However, sorting errors occurred because of failure to get precise spacings so the actual sorting rate was 10 prunes per second.
Nitrogen Influences on Shape Studies
applied shortly after transplanting. In addition, he reported that the form of nitrogen applied pre-plant is most critical and the form of nitrogen applied 21 days after planting is not as important. This substantiated the notion that the first 21 days when storage roots are forming is the most critical in terms of root damage.
Sweetpotatoes are grown all over the temperate and tropical world from about 40N to 40S latitude. Even in the US, every farm location has different soil types and nutrition as well as different climates. The preferred varieties in a certain area are those that perform well in that location. A good example of this is the fact that clones developed by the Louisiana breeding program may not perform as well in North Carolina and those developed in North Carolina may not perform well in Louisiana and other deep-south locations. Therefore, different cultural practices such as the nitrogen applications timing and rates, may need to be specific for different regions. For example, it is frequently desirable to split the nitrogen applications three to four week apart or delay the nitrogen application altogether until some weeks after transplanting.
and in marketable roots than late maturing cultivars at both harvest times and that a single nitrogen application increased total yields for both cultivars. For this study, the source of nitrogen did not have an effect on the yield of late or early maturing cultivars, but it has been shown to have an effect in other studies (Tallyrand & Lugo-Lopez, 1976).
The Department of Biological Sciences at the University of the West Indies did a study on the interrelationships between root shape and yield of six different varieties of sweetpotatoes: 049, A28/7, C9/9, 162, A16/15, and 03/62. Because longitudinal and lateral growth occur at different times during the sweetpotato’s growth cycle, agroclimatic factors will affect the sweetpotato’s shape and size corresponding to where it is in its growth cycle, specifically the prolongation of the activity of root growth potential by secondary and tertiary meristems developing during the latter half of the growing season. Length growth occurs in the first 16 weeks and diameter growth occurring in the last 16-24 weeks. (Wilson, 1977).
There is evidence that nitrogen effects the yield and size of Beauregard
sweetpotatoes. A study at the Eastern Shore Agricultural Research and Extension Center, Painter, VA was conducted on ‘Beauregard’ sweetpotatoes to determine how nitrogen rate and application timing affected yield and quality (Phillips, Warren, & Mullins, 2005). Ammonium nitrate was applied in rates of 24.981, 49.962, and 74.943 lb/ac before
transplanting and 2 to 3 weeks after transplanting, before transplanting and 4 to 5 weeks after transplanting, or 2 to 3 weeks after transplanting and 4 to 5 weeks after transplanting, in addition to having a plot where no nitrogen was applied. This study showed that about 49.0699 lb/ac of nitrogen was required because of the excessive rainfall received during the study, but a prediction of 31.2263 lb/ac of nitrogen for normal rainfall conditions, and greater yields of marketable roots and crop uniformity were shown when applying nitrogen 3 to 5 weeks after transplanting. As for root size distribution, about 65% of the harvested roots were US No. 1, 25% canners, and 10% jumbo, which are similar to the results reported for
“Beauregard in North Carolina in 1992 (Schultheis, Walters, Adams, & Estes, 1999). Waiting until 4 to 5 weeks after transplanting decreased the number of US No. 1 roots and increased the number of canners (Phillips et al., 2005). In ‘Beauregard’, the critical
development stage can be observed 13 days after transplanting, with nitrogen recovery by the storage roots from 23 to 40 days after transplanting (Benedict et al., 2009). Because storage roots do not require high nitrogen levels to form but to grow, this is why finding the best time to apply the nitrogen application is important. Applying nitrogen at 40 days after
The sweetpotato variety ‘Covington’, or NC98-608, was developed by North Carolina State University that is comparable to ‘Beauregard’, a variety released by LSU. ‘Covington’ averages a length to diameter ratio of 2:1, whereas ‘Beauregard’ averages 2:5 (Yencho et al., 2008). A study was conducted from 2001 to 2006 at different locations in North Carolina that reported ‘Covington’ having a higher percentage of US No. 1’s than ‘Beauregard’ with roots more uniform in size (Yencho et al., 2008). ‘Covington’ produces better in areas such as North Carolina than in Louisiana and Mississippi because it is better adapted to grow in the soils and climate of North Carolina (Yencho et al., 2008). In a North Carolina study,
‘Covington’ roots would size quicker when a split nitrogen application of 10 and 28 days after planting that just a single nitrogen application (Yencho et al., 2008).
In China, a study was performed on sweetpotatoes to investigate the effects of humic acid urea fertilizer on root growth and yield (Chen X et al., 2017). Humic acid is known to promote root growth in crops or when combined with fertilizer to increase yield. The five treatments used: control, humic acid urea, weathered coal, urea, and humic acid urea. Their results showed that all treatments compared to the control significantly increased yield. The urea fertilizer treatment alone decreased the number of storage roots, but significantly increased the average fresh weight per storage root. Humic acid urea fertilizer increased root length, diameter, surface area and volume. It also increases the number of storage roots per plant, which understandably increased yield.
Conclusion
efficiency and profitability as well as produce sweetpotatoes consumers demand. The ability to determine what rate of nitrogen fertilizer to use when growing sweetpotato should help to achieve the highest yields while avoiding over fertilization of the crop or producing
misshaped roots. There is some information showing that nitrogen affects the yield and shape of sweetpotatoes; however, the information very specific to location and year (Benedict et al., 2009). Further and more importantly, having the tools to precisely and objectively measure shape and size now will prove very beneficial for sweetpotato farmers in all regions.
Based in the above and the limited amount of research on the correlation of nitrogen applications and rates with size and shape of sweetpotatoes commonly grown in North Carolina, such as Beauregard, Bellevue, Covington, Evangeline, NC 05-198, and NC 09 122, the objectives of this research are as follows:
i. Develop a system including the instrumentation and methodology for the rapid, objective scanning and measurement of sweetpotato shape and size.
ii. Utilizing the scan data along with mathematical and statistical analysis to objectively describe the shape of a sweet potato including length, maximum diameter, volume, taper, curvature, surface area, roundness and length to width ratio.
iii. This will allow us to assign a unique characteristic shape and size profile to different sweetpotato species based on various cultural factors.
CHAPTER 2: A System to Measure Size and Shape Describing Shape
USDA Grade Standards (Appendix B) notwithstanding, there are certain shape characteristics that most consumers would agree constitutes a well-shaped sweetpotato. The measurement of many “well shaped” sweetpotatoes according to consumer judgement suggests the following characteristics as a guide. See the illustration in Figure 1, below. a) A length of approximately 6 inches.
b) The largest diameter is approximately 2.4 inches which occurs just above the mid-point of the length. This yields an ideal length-to-width ratio of approximately 2.5 to 1.
c) Approximately round in all cross sections perpendicular to the long axis. d) Little or no curvature along the long axis of the root.
e) Tending to be fusiform with rounded shoulders on the apical end and tapering to small rounded shoulders on the distal end.
Figure 1: General Shape Characteristics of an "Ideal" Sweetpotato
In normal conversation, we describe the shape of an object by relating it to something else. For example, we can describe a tomato as “about the size of your fist” which implies a rough size as well as a rough shape. If we are seeking a more precise description, we might describe the same tomato as similar to an oblate spheroid with a major diameter of 3.37 inches. The shape of any particular object may roughly fall into one of two basic categories; regular and irregular. Describing an object approaching a regular shape (sphere, cylinder, cone, rectangular solid etc.) is easy and generally precise enough for everyday use. For example, we can say a baseball is like a sphere or a can of beans is like a right circular cylinder and be reasonably sure our hearer will understand. Further, there are numerous objects that are the combination of several regular shapes. Lego blocks and wine bottles come to mind.
On the other hand, there a great number of objects (mostly natural) that are irregular. They do not approximate any regular shape or combination of regular shapes. A lump of coal or a fragment of rock serve as examples as would the curve of a fish’s body, the shape of a leaf or in our case, the shape of a sweetpotato.
It may be that sweetpotatoes tend toward some ideal symmetrical shape but genetics and various cultural conditions influence the shape. Those familiar with different sweetpotato varieties of the same skin color can often distinguish between samples of different varieties by the subtle differences in shape associated with a specific variety. Sweetpotatoes are a product of nature, are irregular and therefore come in a bewildering range of shapes.
Although similarities abound, it is not likely to ever find two sweetpotatoes exactly the same size and shape. Sweetpotatoes can range from nearly round, to excessively long, to
excessively curved, with flat sides or fluted sides to a combination of all these and more.
Some Shape Characteristics Length
snakes which are pulled out straight before measuring. But how can we determine the length along the curve of a sweetpotato that we cannot straighten?
Figure 2: Straight Versus Curved Length
One way would be to first place the sweetpotato into a 3D coordinate system. We then take parallel cross sections perpendicular to the straight length (Ls) and then determine the x,y and z coordinates of the centroid of each area. By summing the distances between centroids, an approximate (piecewise) curved length (Lc) could be determined. In the sweetpotato above, the piecewise curve length, Lc = AB +BC+CD+DE+EF+FG+GH. A reasonable approximation of the degree of curvature may be obtained by the ratio of curve length to straight length, Lc/Ls. Notice that this takes into account the curvature along both planes parallel to the straight length line. The closer this ratio is to 1.0, the straighter the sweetpotato.
Straight
Length
Ls
A
C
B
D
F
E
G
Diameter
When we refer to the “diameter of a sweetpotato”, we normally mean the maximum transverse in a cross section located somewhere near the midpoint of the length. In layman’s terms, this would be thickest part of the sweetpotato. Note that the cross section must be perpendicular to the central axis of the sweetpotato and that this central axis is likely to be a curve. If the cross section is not perpendicular to the central axis (of curvature as in Figure 2, above) then the maximum transverse will be elongated and yield an inaccurate measurement. Diameter may not be correct usage since “diameter” implies a circle. Although the cross sections of sweetpotatoes may approach a circle, few, if any are actual circles. They are rather irregular closed figures with a maximum transverse as shown in Figure 3, below. It is likely but not assured that the maximum transverse will occur at or near the cross section with the largest area.
Maximum Transverse
Roundness
Roundness is a term used to describe how close a cross section approaches a perfect circle. Roundness is closely associated with symmetry since a round cross section has multi-lateral symmetry and recall that symmetry is a desirable visual attribute for produce. There are several ways to measure roundness. One way is to find the area of the largest circle that may be inscribed in the cross section and compare it to the total area of the cross section. This ratio is a measure of roundness. As the cross section approaches a perfect circle, the ratio will approach unity.
Figure 4: Roundness of a cross section is defined as the standard deviation of the lengths of each ray from the centroid of that cross section
Volume
Although volume alone may not be specifically related to shape, it is intrinsically related to size. Recall that size as well as shape is a determining factor in the value of an individual sweetpotato. Statistics concerning the volume of each individual sweetpotato in a unique treatment can give valuable information concerning how size distribution and total yield is related to genetics and cultural practices. Volume may be determined by first calculating the volume of each discrete section and then summing them to yield a total volume.
Surface Area
related to the size of the root. Since they are not, the ratio of surface area to volume can potentially be a quasi-indicator of shape provided we are careful and analyze the data properly.
Taper
The rate of change in cross section area is an indication of taper. The “ideal” sweetpotato as described above is ovoid or elongated egg shaped (fusiform) with a shorter taper at the top than bottom. The ideal sweetpotato is also described as having rounded shoulders (ends) on both the top and bottom end which indicates that the taper is not uniform. A statistical analysis of the change in cross section from top to bottom could potentially yield some interesting insights in the shape of the sweetpotato. For example, by examining the cross sectional area of all sections from one end of the sweetpotato to the other along a normalized length would be very helpful in describing the shape.
Size and Shape Analysis System
In the history of science, advances often come when new ways of seeing are perfected. This has been true for the microscope, the telescope, the x-ray and a long list of other scientific instruments. The same might be said for a way to precisely measure odd shaped items like sweetpotatoes and objectively analyze the data. Before the development of a computerized camera system, the only viable way to evaluate size and shape of
Prior Work on Sweetpotato Measuring Systems
In addition to an image camera based sweetpotato measuring system developed in the Department of Biological and Agricultural Engineering at NCSU in 2004 as part of a
graduate project (Mummert, 2004), there was built and tested a mechanical stylus based sweetpotato measuring system in 2013, as shown in Figure 5, below. This device was built by a team at NCSU as part of a summer undergraduate research project.
Figure 5: A mechanical stylus based sweetpotato measuring system developed in 2013. 1 and 2- linear transducers, 3 digital stylus, 4. rotary encoder
preliminary success, the research team was encouraged to look for better, faster equipment and methodology (Boyette, 2018).
In 2015, efforts were renewed to find a non-contact method suitable for rapidly measuring the size and shape of sweetpotatoes that could be integrated with computerized data collection. A Keyence LJ-V7300 high-speed laser profile scanner was eventually selected that could scan and collect 20,000 points over the surface of a single sweetpotato rotated on a turntable. The Keyence LJ-V7300 laser scanner uses a blue semiconductor laser that measures the ray lengths from the scanner to the surface of the sweetpotato. This was done along the length of each sweetpotato at 15 degree intervals. The data output was discrete points in 3D space (x, y, and z) with the datum axis being the center of rotation.
As scanning in 2016 progressed, it became increasingly apparent that the Keyence scanner had significant shortcomings. There were issues with calibration, accuracy and repeatability as well as the scanner missing data when scanning severely misshaped
sweetpotatoes. Further, because of the way the stepping motor on the turntable worked, there were issues with the sweetpotatoes slipping as they were turned allowing them to lose their angular orientation. Midway through scanning the 2016 test samples, it was determined to search for a more suitable scanning system alternative.
The Current System
Scanner technology is quickly evolving. Not only are scanners faster and more accurate but their outputs are better integrated with commercial 3D modeling software and their ability to operate an integrally controlled turntable. These scanners have been developed in conjunction with 3D printer technology for fast prototyping applications. A single
The specifications of the 3D Systems Capture scanner are as follows: Weight: 2.976241 lbs
Dimensions: 10.8661 in x 2.91339 in x 1.92913 in Data Capture Rate: 985,000 points/scan (0.3 seconds per scan)
Resolution: 0.00393701 in at 11.811 in and 0.007086614 in at 18.8976 in Accuracy: 0.002362205 in
Stand Off Distance: 11.811 in Depth of Field: 7.08661 in
Field of View: 4.88189 x 4.72441 in (near) and 7.48031 x 6.88976 in (far)
Prior to each scanning session, the Capture scanners are individually and collectively calibrated by triangulating the distance from the center of three spherical bosses on a partifact gauge seen on the turntable in Figure 7, below.
Figure 7: Capture scanners and turntable setup during calibration with the partifact.
Output Data from Scans of Individual Sweetpotatoes
variety and treatment. The scan data from a population of 50 to 250 individual roots in an individual treatment is exported and batch analyzed by a custom designed software package that yields the geometric criteria numbers discussed above for each individual root. Since these numbers are all machine generated, they are objective and not based on human judgement in any way. The criteria for each root in a treatment population is then further analyzed by statistical software that yields an overall population average, standard deviation and other statistics for each treatment.
The two custom software packages used to run analysis are a Matlab script and Analysis Export in Controls Studio Pro that uses Creo Parametric 4.0. Geomagic wrap saves an. stl (binary) for the Matlab script and a step file for Analysis Export. These methods, as well as the scanning process, are described in more detail in Appendix A.
The procedure is as follows: First, the input and output file folder for the population and treatment desired to be analyzed are entered into the Matlab software. It starts the analysis by aligning the sweetpotato in space with an x,y,z coordinate system. It then takes 80 normalized sections spaced normally along the entire curved length of the sweetpotato. These sections are oriented perpendicularly along the curved axis of the root. It then determines the centroid of each section and assigns it a unique x,y, and z coordinate. The software ignores any end pieces that have a diameter less than 0.5 inches. In addition, only 95% of the model, i.e. the 3D image of the sweetpotato imported from the scanners
being analyzed and added to the spreadsheet. Figure 8 shows a visualization output of an individual sweetpotato showing its central axis. From the visualization of the 3D Model of the root, it can be rotated about any point to give multiply views. However, for the sake of time this option is not selected unless visualizations of all roots are of interest. The average processing time per sample is approximately 16 seconds. Matlab R2017b is being run on a laptop with 2.5 GHz Intel Core i7 processor with 16 GB of RAM.
Figure 8: Matlab Output Visualization of an Individual Sweetpotato
was very challenging. As stated previously, the Analysis Export software does its analysis very similar to the Matlab software. A few differences are that the Analysis Export software does its analysis in Creo Parametric 4.0, it does 10 normalized sections, and is a bit more time consuming. This software allows the percentage of the model (i.e. the solid 3D image of the sweetpotato used for calculations) to be adjusted, for this analysis it is kept at 97.5% to help eliminate errors in calculations towards the end tips of the sweetpotato. Both software packages analyze the same shape and size characteristics and export data into an excel spreadsheet.
An example spreadsheet heading of the data determined from an analysis of the scans of each sweetpotato is shown below.
There is one spreadsheet page for each treatment with the page heading giving the treatment number and the date.
Column 1: e.g. 401-001. Treatment number followed by the individual sweetpotato number. Each sweetpotato is assigned a unique number denoting both the data and the image.
Column 2: Straight Length – the length from tip to tip ignoring any diameter less than ½
inch.
Column 3: Curved Length – the sum of the piece wise lengths along the curved axis from the centroid of each cross section tip to tip.
Column 4: Curvature - The ratio of the numbers in Column 1 and Column 2. This will yield a measure of crook of the sweetpotato.
Sweetpotato Scan Data
Treatment #401 Scan Date 11/23/17 Area of Cross Section at Normalized Length
Column 5: Maximum Transverse. This is the distance across the thickest portion of the sweetpotato (as described above) measured perpendicular to the curved axis.
Column 6: This is the length to width ratio.
Column 7: This is simply the average of the roundness of each cross section. Column 8: Volume of each sweetpotato.
Column 9: Surface area of each sweetpotato.
Columns 10-18: The area of each of nine cross sections taken perpendicular to the curved axis and spaced along the normalized length of each sweetpotato. The area at normalized length 0.0 and 1.0 is zero for Analysis Export. These are not used in the Matlab analysis.
The Next Step in the Analysis
The shape and size analysis for each individual sweetpotato is the first step in a process involving hundreds of sweetpotatoes in each of 24 treatments over multiple years. However, starting in 2018 there will only be 20 treatments because the variety Bellevue was unable to be planted. Once the data for each sweetpotato in each of the treatments is entered into the spreadsheets, a statistical analysis for each treatment can be conducted and the data from each treatment compared to all the other treatments in that and subsequent years.
Accuracy
more variability in its measurements. Whereas, Matlab uses 95% of the sweetpotato, also eliminating the ends. The closer to the ends the more errors arise. For example, when calculating cross sections, the ends of the sweetpotatoes will produce more vertically tilted slices because of they are smaller and uneven. To help eliminate this error, use the Matlab analysis or reduce the model percentage for Analysis Export.
A few scans failed because they did not accurately represent the sweetpotato scanned. This could have been a result of slippage while scanning not being caught which skewed the overlap of the five scans that are used to mesh the whole potato together, the system not being calibrated, or a bump or a vibration to the scanners or turntable. The failure had the effect of alerting us to errors. The failures were then rescanned successfully.
Conclusion
Over and undersized and misshaped sweetpotatoes cost just as much to produce as US No. 1s. Sweetpotatoes are unique among fresh fruits and vegetables in their variability of size and shape. As the quality demands of customers, both foreign and domestic increase and the profit margins decrease, the industry’s ability to remain profitable will hinge on the efficient use of resources. This system should be a valuable tool to assess the many agro-climatic factors and management decisions and how they affect size and shape of
CHAPTER 3: Correlations of Size and Shape in Sweetpotatoes Introduction
North Carolina State University has been researching ways to identify and control the many factors that influence the size and shape of sweetpotatoes for at least the last 20 years. Not only do different varieties effect size and shape of sweetpotatoes, but factors such as nitrogen timing, amount, and type have been noticed to play a role, too. Early on, Beauregard demonstrated how important it is to study nitrogen’s effect on sweetpotato size and shapes (Phillips, Warren, & Mullins, 2005). It needs little nitrogen during the season, i.e. 50 pounds per acre, and it is best if the nitrogen is applied at least 21 days after transplanting (Schultheis et al., 2016). If applied 21 days before transplanting, Beauregard roots are frequently
excessively long in some cases (Schultheis et al., 2016). The problem is that these prior results provided strong qualitative evidence of the effect of nitrogen on sweetpotato size and shape, but such findings have yet to be supported with quantitative data. The data from this study is a start to understanding and controlling these numerous factors, as well as, being able to pass recommendations on to growers.
Of particular interest is the variety Covington, since this variety is North Carolina’s most produced variety. In particular, some research and grower evidence suggests that nitrogen in the form of urea will cause more misshapen roots in this variety because urea has been proved to have an effect in other studies.
Procedures
The study reported here was conducted for two years. The 2016 year, the
26th, 2016. The second year the sweetpotatoes were grown at NCSU’s Horticulture Crops Research Station in Clinton, NC on similar soils. They were planted June 14th, 2017, and harvested October 9th, 2017. There are six different varieties in the study: Beauregard, Bellevue, Covington, Evangeline, NC 05-198 (Averre), and NC 09 122. Each variety had four nitrogen fertilizer treatments as follows:
CaNO3 Preplant and CaNO3 Layby, CaNO3 Preplant and Urea Layby, Urea Preplant and Urea Layby, None Preplant and None Layby.
All the fertilizer was applied at the rate of 45 lb/ac (Figure 9). The individual
Figure 10: 2017 Plot Layout
These nitrogen treatment combinations all were replicated 4 times and all roots
Jones Farm, near Bailey, NC during the first year of the study. For the second year, the roots were cured and stored at the same condition but at NCSU’s Horticulture Crops Research Station in Clinton, NC. Each population (variety with corresponding fertilizer application) was washed, labeled and photographed for records before scanning. The reason for multi-year studies is to allow and control for different weather conditions during the growing season. A third year (2018) is in the process but no data will be available for this thesis.
Each population of individual sweetpotato for each replication was scanned by 3D System’s Capture Scanners, corresponding 360 degree turntable, and Geomagic Software to determine the length, maximum diameter, Length-to-width ratio, volume, surface area, curvature, taper, and roundness. These quantified metrics were analyzed through mixed-design analysis of variance (ANOVA) to determine the significant differences among shape characteristics, varieties, and nitrogen source/applications. Knowing how different nitrogen sources and application affects the shape and size of different sweetpotato varieties for this Eastern North Carolina area will inform growers how to manipulate these factors to reduce uncertainty, obtain a higher percentage of consumer-desired sweetpotato shapes, avoid over fertilization, and increase grower returns.
uniform product in terms of diameter, length, taper and crook. Being able to determine what influences shape and how to measure it will allow us to produce the size and shape desired by all.
Results
1.00 4
1.01
0 1.021
1.03 05
1.05 12 1.04
07
1.06 3
1.09
1 1.1435
1.10 0
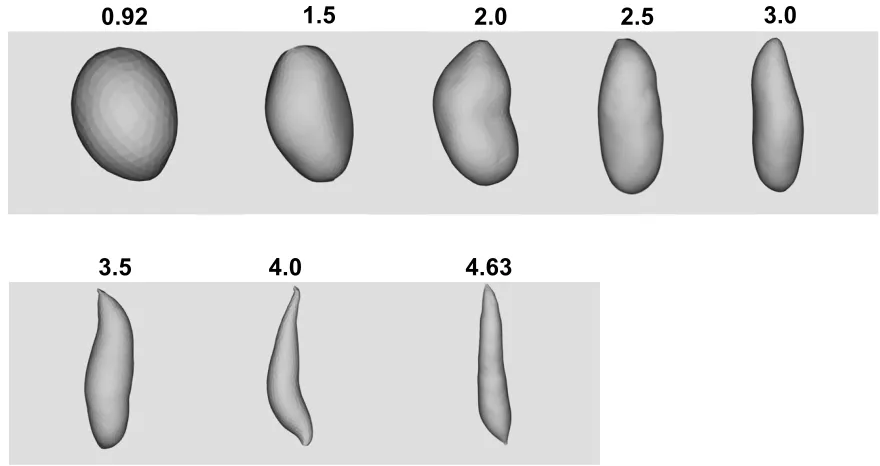
Figure 12: Example of Length-to-Width Values with Images of Individual Sweetpotatoes
Based on the 2017 data, Table 2 gives the coefficient of variation for all desired measurements by varieties. This shows how variable each variety is for specified size and shape measures. Large percentages show that the specified measure for the correlating variety is more likely to deviate from its average value. The shaded cells draw attention to which variety has the largest percentage of variation for the specified size and shape measure. Covington and Beauregard, as compared with the other varieties are the least variable across the board. Table 3 lists the varieties by how well they fit into the following ranges:
Length: 5.5 - 6.25 inches
Max transverse: 2.2 - 2.6 inches Curvature: 1.00 - 1.03
Length-to-With: 2 - 3 Weight: 8 - 16 ounces
0.92 1.5 2.0 2.5 3.0
These “Ideal” ranges were chosen by taking a poll of consumers preferences. Similar tables and graphs can be created for different sweetpotato chip or fry processors to see which varieties best fit their preferences based on size and shape. Size and shape is not the only aspect processors look for, although it is one of the bigger factors, they also prefer specific nutrient and starch contents.
Table 2: Coefficient of Variation by Variety
Variety
Straight Length
Curved
Length Curvature
Surface
Area Volume
Max Trans.
L/W Ratio Beauregard 20.42% 21.12% 3.87% 28.89% 41.84% 19.52% 23.40% Bellevue 21.23% 22.99% 7.25% 32.09% 48.12% 22.58% 23.37% Covington 19.92% 20.37% 2.67% 29.97% 45.35% 20.25% 24.19% Evangeline 24.24% 24.35% 1.56% 32.64% 47.98% 18.76% 27.13% NC05198 22.39% 22.67% 2.09% 34.18% 50.51% 19.26% 22.62% NC09122 23.49% 23.78% 1.48% 33.72% 50.42% 19.95% 26.03%
Table 3: Percent of Ideal Ranges by Variety
Variety
Straight Length
Max
Diameter Curvature
Length-to-Width Weight
Beauregard 23.03% 34.11% 78.86% 59.77% 54.23%
Bellevue 21.06% 32.28% 81.21% 62.93% 47.41%
Covington 16.54% 33.70% 79.29% 43.26% 47.67%
Evangeline 15.32% 30.76% 81.01% 48.86% 45.06%
NC05198 22.34% 32.11% 77.16% 61.68% 44.67%
Beauregard fits the best in respect to the “Ideal” ranges. Table 4 shows the percentage of U.S. No. 1s by variety. The U.S. No. 1 Extra, U.S. No. 1, and U.S. No. 1 Petite are
described in Table 1. According to Table 4, Covington is least likely to produce any of the U.S. No. 1s.
Table 4: Percent of U.S. No. 1s by Variety
Variety Extra US1 Petite Remainder
Beauregard 35.42% 36.15% 19.83% 8.60%
Bellevue 35.94% 37.58% 23.20% 3.28%
Covington 23.16% 23.53% 14.58% 38.73%
Evangeline 25.44% 26.46% 16.84% 31.26%
NC05198 33.7 6% 36.04% 22.59% 7.61%
NC09122 27.23% 28.22% 24.88% 19.67%
Analysis Export Data
The Analysis Export data is approximately 5 percent or less different than the Matlab data with the exception of some max transverse/diameter calculations. When comparing the two systems against known measurements, the Matlab system produces results all
approximately 5 percent or less but the Analysis Export system in some instances produces a larger percent difference. This could be from skewed calculations at the ends of the
Statistics
A mixed-design ANOVA test was applied for all of the described measurements. Variety, nitrogen treatment, and the interaction between variety and nitrogen treatment were all treated as fixed effects; blocks and plots within blocks were treated as random effects. The ANOVA was run in R (R Core Team, 2018). P-values are reported in Tables 5 and 6 for the 2016 and 2017 years, respectively. Cells that display significance at an alpha level of 0.05 are shaded. Appendix D shows pairs plots for variety, and nitrogen that have significance, for both the 2016 and 2017 crop years. From the pairs plots, the significant differences between varieties can be visualized easily.
For the 2017 crop, no significant differences were observed among Nitrogen
treatments. However, for straight length, curved length, and length-to-width ratio in the 2016 crop, there was evidence of significant differences across nitrogen treatments. The variety and nitrogen interaction displayed no significance for any of the metrics in either years.
Table 5: 2016 P-Values from ANOVA
Variety Nitrogen
Treatment
Variety: Nitrogen Interaction
Straight Length 2.647 x 10⁻⁷ 0.0073 0.1846
Curved Length 2.612 x 10⁻⁷ 0.0058 0.2322
Curvature 0.4661 0.3740 0.0771
Max Transverse 7.454 x 10⁻⁵ 0.8492 0.6035
Length-to-Width Ratio
1.853 x 10⁻⁸ 0.0049 0.0959
Surface Area 3.655 x 10⁻⁵ 0.2819 0.5237
Table 6: 2017 P-Values from ANOVA
Variety Nitrogen
Treatment
Variety: Nitrogen Interaction
Straight Length 1.335 x 10⁻⁹ 0.5075 0.4361
Curved Length 5.132 x 10⁻¹⁰ 0.4606 0.3521
Curvature 0.03199 0.5688 0.5985
Max Transverse 6.023 x 10⁻⁷ 0.7333 0.6869
Length-to-Width Ratio
2.349 x 10⁻¹⁵ 0.8625 0.2462
Surface Area 0.0017 0.2947 0.8013
Volume 0.0021 0.3364 0.7347
Discussion
It has been reported that nitrogen and its form (e.g., urea, calcium nitrate) affect the growth of sweetpotatoes, so the reason that there is no significance for the 2017 crop year could be because other factors could have influences or the concentration of nitrogen used in this study is of a lower concentration that does not display the effects others have reported. This is still preliminary data and at least another seasons worth of data should be used to make better recommendations. In all but one case for the variety, there is significant differences, as expected.
their length-to-width ratio is greater than 2.5. It also is the variety that had the most variability in its length-to-width ratio.
Covington was developed and selected to be grown in North Carolina where this study took place. Covington’s length-to-width ratio was approximately 2 for both years, meaning its’ roots were more “bally”. This root would be most desirable to companies that make chips or fries because it is a more “bally” root than the others in this study. Bally roots produce more consistent fry lengths with less waste in the form of slivers. The length of the roots were approximately 5 inches and significantly shorter than the Beauregard, Bellevue, NC 05 198 (Averre), and NC 09 122 in 2017. The max transverse of the roots were
approximately 2.5 inches and significantly thicker than Bellevue, NC 05 198 (Averre), and NC 09 122 in 2017.
NC 05 198 (Averre) produces a larger root that are long with a larger surface area and volume. In 2016, NC 05 198 (Averre) was significantly longer than all other varieties,
averaging approximately 6 inches (most desirable by consumers).
In 2016, the varieties with a max transverse of or close to 2.4 inches (most desirable by consumer) are Covington, Evangeline, and NC 05 198 (Averre). For 2017, the varieties were Beauregard, Evangeline, and NC 05 198 (Averre). Based on length (6 inches), max
Bellevue and Evangeline in 2017 with Bellevue tending to be a little more curved. Evangeline seemed to also have the least variability in lengths.
Nitrogen treatment was only significantly different in 2016 for straight length, curved length and length-to-width ratio. All of these are essentially connected in that the roots in the CaNO3 preplant/ CaNO3 layby and Urea preplant/ Urea layby treatments produced shorter roots than the control treatment. Thus, a shorter length, will alter the length-to-width ratio. Some environmental or cultural factors that could influence size and shape difference of sweetpotatoes are weather, soil type and compaction, other nutrients, planting/harvesting times and conditions, etc. These factors could explain why nitrogen fertilizer was not an influential factor in this study. However, another year’s worth of data collection could still prove that nitrogen has an influence on shape and size. The 2018 crop is planted in the field next to where the 2017 crop was planted, this might help even though soil types in Clinton, NC and Kinston, NC are similar. In addition, with sweetpotatoes everything is done by hand with little machine help which leaves a lot of room for human errors.
Conclusions
Size and shape is a major factor to consider with sweetpotatoes, however, it is not the only factor. There are many traits a sweetpotato variety is bred for, such as nutrients, storage capability, processing, etc. So, while one variety may not be the best size and shape, it may make up for with other traits.
REFERENCES
Abrahamsen, M. (1949). Determining consumer preferences for sweet potatoes: Methods and results. Journal of Farm Economics, 31(1), 635-639. doi:10.2307/1232879.
Alchanatis, V., and S. W. Searcy. (1995). High Speed Inspection of Carrots with a Pipelined Image Processing System. ASAE Paper No. 953170. St. Joseph, Mich.: ASAE. Alves, A. U., Oliveira, A. P. d., Alves, E. U., Oliveira, Arnaldo Nonato Pereira de, Cardoso,
E. d. A., & Matos, B. F. (2009). Management of nitrogen fertilization for sweet potato: Sources and application parceling. Ciência E Agrotecnologia, 33(6), 1554-1559. doi:10.1590/S1413-70542009000600014.
Ankumah, R. O., Khan, V., Mwamba, K., & Kpomblekou-A, K. (2003). The influence of source and timing of nitrogen fertilizers on yield and nitrogen use efficiency of four sweet potato cultivars. Agriculture Ecosystems & Environment, 100(2-3), 201-207. doi:10.1016/S0167-8809(03)00196-8.
Benedict, L., Smith, T., Labonte, D. R., & Villordon, A. O. (2009, June 16,). Nitrogen management: New insights and opportunities.
Boyette, Michael, and Amber L Tsirnikas. (2017). Evaluating the Shape and Size
Characteristics of Sweetpotatoes Using Digital Image Analysis. ASABE Paper No. 1700038 (doi:10.13031/aim.201700038). St. Joseph, Mich.: ASABE.
Chen X, Kou M, Tang Z, Zhang A, Li H, Wei M (2017) Responses of root physiological characteristics and yield of sweet potato to humic acid urea fertilizer. PLoS ONE 12(12): e0189715.
England Port Moresby Armidale, & Australia Papua New Guinea.Consumer versus farmer preference for sweetpotato product attributes in papua new guinea
Deck, S., C. T. Morrow, P. H. Heinemann, and H. J. Sommer. (1992). Comparison of a Neural Networks and Traditional Classifier for Machine Vision Inspection of Potatoes. Applied Engineering in Agriculture, 11(2): 319-326. ASAE Paper No. 923595. St. Joseph, Mich.: ASAE.
Delwiche, M. J., S. Tang, and J. F. Thompson, (1993). A High Speed Sorting System for Dried Prunes. Trans. ASAE 36(1):195-200.
Department of Agriculture. (2005). United states standards for grades of sweetpotatoes
Eguchi, T., Kitano, M., & Eguchi, H. (1997). On-line system for volume measurement in sweet potato tuber. Retrieved from http://hdl.handle.net/2324/8235
Gogineni, S., White, J. G., Thomasson, J., Thompson, P. G., Wooten, J. & Shankle, M. (2002). Image-Based Sweetpotato Yield and Grade Monitor. ASAE Paper No. 021169. 10.13031/2013.10586.
Heinemann, P. H., Pathare, N. P., & Morrow, C. T. (1996). An automated inspection station for machine-vision grading of potatoes. Machine Vision and Applications, 9(1), 14-19. DOI: 10.1007/BF01246635.
Mummert, C. N. (2005). The Development of a Machine Vision System to Measure the Shape of Sweetpotato Root.
R Core Team (2018). R: A language and environment for statistical computing. R
Foundation for Statistical Computing, Vienna, Austria. URL https://www.R-project.org/. Schultheis, J. R., Walters, S. A., Adams, D. E., & Estes, E. A. (1999). In-row plant spacing
and date of harvest of 'beauregard' sweetpotato affect yield and return on investment.
HortScience, 34(7), 12229-1233.
Schultheis, J., Duque, L., Pecota, K., Thronton, A. (2016). Nutrient Effects on Sweetpotato Yield and Shape.
Sweet potatoes commodity pricing. (2016, November 4,). The Packer,
Tallyrand, H., & Lugo-Lopez, M. A. (1976). Effects of five levels and three sources of N on sweet potato yields on ultisol. J. Univ. Puerto Rico, 60, 9-14.
Tippett, R. (2017). NC in Focus: Sweet Potatoes, 2017. Carolina Demography.
Wilson, L. A. (1977). Components of tuber yield in sweet potato. Proc. Intern. Soc. Trop. Root Crops, 3, 83-86.
Wooten, J. R., J.A. Thomasson, J. G. White, and P.G. Thompson. (2000). Yield and Quality Monitor for Sweetpotato with Machine Vision. ASAE Paper No. 001123. St. Joseph, Mich.: ASAE.
Appendix A: Scanning Protocol
Sweet Potato Scanning Procedure Pre-scan
• Get the next lug from the cooler, taking note of the tag number
o 2017 lugs should contain roughly 50 potatoes each
• Wash each potato using either the scrubbing pads or brush next to the sink
o The goal here is to clean the dirt off the potato, not the skin
o Make sure to remove any buds that have sprouted
• Once cleaned, place potatoes on a towel to dry
• Take a picture of any potatoes, along with the tag number, that fit completely through the opening in the white size gauge
o 2017 lugs should not contain any potatoes this size
• Count the potatoes and record (lug #- # of potatoes) in John Deere notebook located the on top of the computer, ex. 999- 50
• While potatoes are drying, cut off the ends using the jig beside the sink
o Insert the end of the potato into the jig up to the point where the potato is too large to go any further, this is where you will cut
o Repeat on the other end
• Once potatoes are dry (doesn’t have to be completely dry, just not soaking wet), place in a pile with the lug number tag on top
Scanning
• Power on computer and log in
o Username: baegrad-2018
o Password: baegrad2018
• Open Geomagic Wrap 2017
• Make sure the directory number corresponds with the lug number you are scanning; all scans will be saved in the Raw folder under each lug number’s file
• To check directory number
Jig used for cutting ends of potatoes
o Left-click the 3DS icon in the upper, left hand corner of the screen, then select Options at the bottom of the menu
o The directory currently being used to save scans will be under the General- Frequently Used tab
o Check the directory name under Default Save Directory, the name (ex. 2017\123\123 Raw) should correspond with the lug number of the potatoes being scanned
o If it doesn’t match, click browse, scroll down until you find the folder with the correct lug number, click on the folder, and select that lug number’s Raw folder, click OK
• If there is not a matching folder and/or when starting a new lug, create a new folder for that lug number
o In the 2017 folder on the desktop, right-click and select New…Folder, name this folder the same as the new lug number (ex. 234)
o Within the new folder create three more new folders, name one lug # Object (ex. 234 Object), another lug # Raw (ex. 234 Raw), and the last lug # Surface (ex. 234 Surface)
• Click the Capture tab located on the ribbon at the top of the page, then click on the Scan icon, this will open a new Geomagic Capture window
• Before scanning any potatoes be sure that the scanners are calibrated
o To check calibration, click on the Settings icon at the bottom of the Geomagic Capture window
o Under device status, there should be three devices which appear: HDI-Series (35766), HDI-Series (40731), and Turntable
o If all three devices have OK under their Registered column, they are calibrated, and you can begin scanning
o If all three devices do not have OK under their Registered column, they will need to be recalibrated
• If required, recalibrate one or both scanners
o On the Capture tab, select Scan, then click on the Settings button in the lower, right corner of the scan window
o Place the grey 3DS partifact on the turntable
vertically, so that the three spheres are at the top and are facing outward towards the scanners
§ For successful calibration, all three spheres must be visible in the scan window
§ You may have to adjust the turntable if the stationary post is blocking a sphere from being visible to the scanners
§ The partifact has a tendency to spin when placed between the allen head screw and the sliding rod; to prevent this either remove the screw and place the partifact directly on the turntable or place it just in front of the screw
o Under Device Status, make sure the correct devices are selected; either “HDI-Series (35776)” and “Turntable” for scanning with the lower scanner only, or all three devices if both scanners are going to be used
o Under Scan Resolution, make sure that the resolution is set to Low
o To get an optimal scan, adjust the Exposure value by clicking on the Auto-Exposure button; this should be done for each scanner that is being calibrated
o Under Device Registration, in the lower right corner of the settings menu, make sure that the Spheres method is selected
o Click on Register to calibrate
§ When registration is complete you will receive a “Registration Complete” message
• If you receive the error message “Sphere detection and alignment failed. Try repositioning the object or changing the exposure for each scanner.”, you will need to adjust the position of the partifact so that all three spheres are visible to the scanner and try the recalibration process again
§ Click OK to accept the registration results
• When calibration is complete, click the OK button under the Dialog tag on the left side of the screen
• After clicking OK, the ribbon on the left side of the screen will automatically default back to the Model Manager tab
• Making sure that all scans are highlighted, right-click on Group 1, select Delete; a window will pop up asking if you are sure you want to delete these objects, Click Yes
• To scan, place a potato on the turntable with one end on the allen head screw and secure the other end by inserting the sliding rod just under the skin of the potato
o Depending on the size of the potato, you may have to raise or lower the clamp that connects the sliding rod to the stationary post on the turntable for a proper fit