Formulation of Improved Grey Wolf
Optimization Methodology for EELD Problem
Guntaas Mr. Sushil Prashar
M. Tech. Student Assistant Professor
Department of Electrical Engineering Department of Electrical Engineering D.A.V.I.E.T., Jalandhar, Punjab, India D.A.V.I.E.T., Jalandhar, Punjab, India
Abstract
A latest meta-heuristic technique IGWO (Improved Grey Wolf Optimization) is being formulated to solve Economic Emission Load Dispatch Problem in this paper. And the results have been compared with various techniques like GSA, MODE, PDE, SPEA, NSGA for six-unit system and for ten-unit system. Furthermore, the proposed algorithm obtains competitive and satisfying results compared to other proposed techniques.
Keywords: EELD (Economic Emission Load Dispatch), GWO (Grey Wolf Optimization), IGWO (Improved Grey Wolf Optimization)
________________________________________________________________________________________________________
I. INTRODUCTION
The main goal of economic emission dispatch problem is to get optimum output of thermal generators in power system subjected to several constraints to minimize the operating cost. The thermal power plant operation is dependent upon combustion of fossil fuel which produces SOx, NOx and COx emissions. The increasing pollution is a matter of environmental concern worldwide which has led to formation of international standards for emissions from industries and power plants. Different acts have been made which forces the industries to modify their principles to follow the environment-emission standards strictly. Thus it becomes significant to do emission dispatch or consider emission constraints in optimum generation scheduling. The economic & emission scheduling are contradictory in character and both must be considered together to find optimal scheduling. The problem is formulated as a multi-objective Economic Emission Load Dispatch problem in which both the objectives (emission and economy) have to be minimized.
Earlier traditional methods like Newton’s method, gradient approach and linear programming [2] were used for solving economic load scheduling problem. In the last years different techniques have been used for solving EELD. Nanda et al [1] applied goal programming techniques to solve economic emission load dispatch. Song et.al [3] solved environmental/economic dispatch with genetic algorithm controlled by fuzzy logic. Abido [7] used genetic algorithm for the economic emission load dispatch (EELD) to find out pareto-optimal solutions. Ah King [8, 9] applied improved non- ruled sorting genetic algorithm (NSGA-II) for creating pareto-optimal front for EELD. Thenmozhi [11] solved EELD using hybrid genetic algorithm. Perez [8] solved environmental/economic dispatch using differential evolution. Hong [15] applied immune genetic algorithm for EELD. Hazra [16] proposed bacteria foraging algorithm for emission constrained economic dispatch. Hemamalini [17] solved non convex EELD by applying particle swarm optimization. Bhattacharya.et.al [18] presented a BBO technique to solve EELD of thermal generators with different emission substances (SOx, NOx, & COx). Similarly there are many other techniques like teaching learning based algorithm [21], firefly algorithm (FFA) [20], artificial neural networks [4], NSGA [5] and SPEA [6], hybrid grey wolf optimization –particle swarm optimization[27],Ant Lion optimization[25], GWO[26] and IGWO[27] which have been successfully used to solve EELD problem.
In this paper, IGWO has been formulated to solve EELD problem and both the fuel and emission costs have been minimized.
II. PROBLEM FORMULATION
Economic Load Dispatch (ELD)
Objective for ELD is to reduce the operating (fuel) cost of thermal generators satisfying some limits. The objective function is given by:
𝐶 = ∑NGi=1(aiPgi2+ biPgi+ ci) (1)
Where ai, bi, & ci are the fuel-cost coefficients and 𝑃𝑔𝑖 is power output for the ithgenerating unit among NG total committed generating units.
Energy Balance Constraint
The overall generation by the entire generators should be equal to the sum of whole power demand (Pd) & system’s real power loss (PL).
∑NGi=1Pgi− Pd− PL (2) The power loss is calculated by using B coefficients and unit power output:
PL= ∑i=1NG∑NGj=1PiBijPj+ ∑i=1NGB0iPi+ B00 (3)
Generator Limit Constraint
Real power generation of each and every generator need to be controlled within its respective lower operating limits 𝑃𝑔𝑖𝑚𝑖𝑛and upper operating limits 𝑃𝑔𝑖𝑚𝑎𝑥.
Pgimin≤ Pgi≤ Pgimax , i=1, 2… NG (4)
Economic Emission Dispatch
The objective is to reduce the entire pollution discharge from combustion of coal or gas for producing electricity. The emission function consists of the summation of different types of emissions (i.e. COx, NOx and SOx) with appropriate pricing for every pollutant discharged. In this paper, we are considering and minimizing only Cox emissions. The problem of optimum emission scheduling for NOx is given as follows:
EN= ∑NGi=1(diNPgi2+ eiNPgi+ fiN) (5)
Where EN is the total amount of NOx emission from the power plant in kg/hr. diN , eiN , fiN are the NOx emission coefficients of
ithgenerating unit. The power balance & generator limit restrictions are given by Eq. (2 & 4) respectively.
EELD (Economic Emission Load Dispatch)
The emission and economic scheduling are contradictory in character and they both have to be considered together to find optimal scheduling. The problem is expressed as an economic emission load dispatch problem in which both the objectives (emission and economy) have to be minimized. The objective function is given by:
FC (C, EN) (6) Where ‘C’ denotes fuel cost objective and ‘EN’ denote emission objectives.
III. GREY WOLF OPTIMIZATION(GWO) AND IMPROVED GREY WOLF OPTIMIZATION(IGWO) Grey Wolf Optimization
For understanding the concept of IGWO methodology, we need to first understand about GWO and its algorithm.
GWO algorithm was mainly proposed by Syed Mohammad Mirajili. A grey wolf is described by powerful teeth, bushy tail and grey wolves hunt in a pack having an average group size of 5-12. Natural habitats of grey wolves are found in the mountains, forests and plains of North America, Asia and Europe. GWO algorithm involves four models which are as follows:
Social Hierarchy
Grey wolves’ hierarchy exist in a pack, in which ‘α’ is the leader and the most dominant one & important decision makers, ‘β’ and ‘δ’ are assistants & helps ‘α’ in decision making and the left ones are the omega which need to follow the instructions given by ‘α’, ‘β’, and ‘δ’.
Encircling Prey
The mathematical modelling involved in encircling prey can be represented by following equations: D = | CXp - AX(t) (1)
X(t+1) = Xp(t) – AD (2) Where A and C are coefficients vectors given by:
A = 2 a*r1*a (3)
C = 2*r2 (4)
t is the current iteration
X is the position vector of a wolf
r1 and r2 are random vectors € [0,1] and ‘a’ linearly decreases from 2 to 0
Hunting
The mechanism of hunting of the grey wolves involves the following main steps: – Tracking, chasing and approaching the prey.
– Pursuing, encircling and troubling the prey until it stops moving. – Lastly, attacking the prey.
However, in abstract search space, we need to have idea about the (prey) optimum’s location. To mathematically simulate the hunting behavior, the assumption is made that the alpha, beta and delta have better information about the potential location of the prey as follows:
Dβ= C2.Xβ−X,
Dδ= C3.Xδ−X …. (8) X1=Xα−A1.(Dα)
X2=Xβ−A2.Dβ
X3=Xδ−A3.(Dδ) (9) X (t+1) = (X1+X2+X3) (10)
3
Where t is the current iteration and Xα, Xβ and Xδ are the position vector of the grey wolves α, β and δ.
Attacking Prey (Exploitation) and Search for Prey (Exploration)
The ability of the grey wolves may result in the global optima; that is the exploitation ability. Though the value of a decreases from 2 to 0, A is also decreased at the same time. A is a random value in the interval [-2a, 2a]. If |A|< 1, the grey wolves are forced to attack the prey. The values of ‘A’ are utilized arbitrarily for indulging the search agent so as to diverge from the prey. When |A| > 1, the grey wolves are forced to diverge from the prey.
An Improved Grey Wolf Optimization (IGWO)
The agent’s movement in GWO is significantly dependent upon the circumstances of the alpha, beta and delta. Figure (1) below is showing how a search agent update its position. A new approach has been added to calculate the vectors D՛α, D՛β, D՛δ in this paper, which willbe helpful for a search agent to have more exploration ability and it will not get trapped in the local optima. The updated position can be calculated as follows:
D՛α = | C1. Xr1 – Xr3 | D՛β = | C2 . Xr2 – Xr1 | D՛δ = | C3 . Xr3 – Xr1 | (11)
X՛1 = Xα – A1 . (D՛α) X՛2 = Xβ – A2 . (D՛β) X՛3 = Xδ – A3 . (D՛δ) …. (12) X՛(t + 1) = X՛1 + X՛2 + X՛3 …. (13)
3
Fig. 1: Showing position of omega (ω) or any other hunters in GWO & IGWO
Fig. 2: Showing Pseudo- Code of IGWO’
IV. FORMULATION OF IMPROVED GWO METHODOLOGY [27] Step 1: Implementation
The main motive of ELD is allocating the load demand amongst contributing generators at minimum possible cost without violating any constraints present in the system. Formulation of ED problem is given by Eq. (1) and transmission losses are formulated by Eq. (2).
𝐹𝑡= ∑𝑛𝑖=1𝐴𝑖𝑃𝑔𝑖2 + 𝐵𝑖𝑃𝑔𝑖+ 𝐶𝑖 (1)
0 00
1 1
n n
L gi ij gj i gi
i i
P P B P B P B
(2) E = ∑𝑛𝑖=1𝐴𝑖𝑃𝑔𝑖2 + 𝐵𝑖𝑃𝑔𝑖+ 𝐶𝑖+ ηi exp(δPgi) (3) i = 1,2…….NG
Where δi and ηi are used only if the valve point effect is taken into account.
Step 2: Improved Grey Wolf Pack Representation
Real power generations act as decision variables for ELD problem. Let if there are NG generators in the system, the wolf position’s representation would be described in the form of vector length NG. Let us assume that NP wolves are taken in the pack, and complete pack in the matrix form can be represented as below:
Pack = [
𝑃11 𝑃12 … 𝑃1𝑁𝐺
𝑃21 𝑃22 … 𝑃2𝑁𝐺
… … 𝑃𝑖𝑗 …
𝑃𝑁𝑃1 𝑃𝑁𝑃2 … 𝑃𝑁𝑃𝑁𝐺
]… (6)
Step 3: Pack Initialization
Each element of above described pack matrix is first initialized and occurred randomly within capacity constraints depend upon Eq. (7). The initialization of the positions of the wolves is done through this inequality:
𝑃𝑗𝑚𝑖𝑛 < 𝑃𝑖𝑗< 𝑃𝑗𝑚𝑎𝑥
(i=1,2..NP;j=1,2...NG) (7)
𝑃𝑖= 𝑃𝑖𝑚𝑖𝑛+ 𝑟𝑎𝑛𝑑( )( 𝑃𝑖𝑚𝑎𝑥− 𝑃𝑖𝑚𝑖𝑛) (8)
Step 4: Evaluation of Objective function
For satisfying energy constraints, one of the committed generators is selected as a dependent/slack generator d and this is obtained by:
𝑃𝑑 𝑗
= 𝑍𝑗(i=1, 2...NP; j= 1, 2...NG) (9) Where
𝑍 = 𝑃𝑑− ∑𝑁𝐺𝑖=1,𝑖≠𝑑𝑃𝑖 (10)
If operating limits are violated by the production of the dependent/slack generator, then it is set by equation:
𝑃𝑖𝑗= {
𝑃𝑖𝑚𝑖𝑛; 𝑃𝑖 𝑗
< 𝑃𝑖𝑚𝑖𝑛
𝑃𝑖𝑚𝑎𝑥; 𝑃𝑖 𝑗
> 𝑃𝑖𝑚𝑎𝑥
𝑃𝑖𝑗; 𝑃𝑖𝑚𝑖𝑛< 𝑃𝑖 𝑗
< 𝑃𝑖𝑚𝑎𝑥
(i=1,2...NG; i≠ 𝑑; j= 1,2..L) (11)
After restraining the value of dependent generator, the objective function is then set up with a penalty term. Then the function is defined by:
𝑓𝑗 = 𝐹(𝑃
𝑖 𝑗
) + ∅ … (12)
Step 5: Encircling the Prey
The mathematical model of the encircling behavior has been shown as follows:
D
⃗⃗ = |C⃗ . P⃗⃗ p(t) − P⃗⃗ (t)|… (13)
P
⃗⃗ (t + 1) = P⃗⃗ p(t) − A⃗⃗ . D⃗⃗ … (14)
Where A⃗⃗ and C⃗ are coefficient vectors, P⃗⃗ p is the prey’s position vector, P⃗⃗ denotes position vector of the grey wolf and ‘t’ denotes the current iteration.
Vectors A and C can be calculated is as below:
A
⃗⃗ = 2. a⃗ . r 1. a⃗ … (15)
C
⃗ = 2. r 2… (16)
Where values of ‘𝑎 ’are linearly reduced from 2 to 0 during the course of iterations and r1, r2 are arbitrary vectors in [0, 1].
Step 6: Improved Grey Wolf Movement & Updating the position
Grey wolves have the capability of identifying the position of prey and encircling them. The rest of the wolves need to update their positions according to best wolf position. Formulation of their agent position can be updated as below:
D
⃗⃗ α= |C⃗ 1. P⃗⃗ α− P⃗⃗ | , D⃗⃗ β= |C⃗ 2. P⃗⃗ β− P⃗⃗ | , D⃗⃗ δ= |C⃗ 3. P⃗⃗ δ− P⃗⃗ |
P
⃗⃗ 1= P⃗⃗ α− A⃗⃗ 1. (D⃗⃗ α),P⃗⃗ 2= P⃗⃗ β− A⃗⃗ 2. (D⃗⃗ β) , P⃗⃗ 3= P⃗⃗ δ− A⃗⃗ 3. (D⃗⃗ δ)
P
⃗⃗ (t + 1) =P⃗⃗ 1+ P⃗⃗ 2+ P⃗⃗ 3
3
Position updating of the search agent according to beta, alpha and delta in a two-dimensional search space is shown in fig.1 shown above.
Updation of IGWO agent’s position takes place as follows:
D′
⃗⃗⃗ α= |C⃗ 1. P⃗⃗ r1− P⃗⃗⃗⃗⃗ | , D′r3 ⃗⃗⃗ β= |C⃗ 2. P⃗⃗ r2− P⃗⃗⃗⃗⃗ | , D′r1 ⃗⃗⃗ δ= |C⃗ 3. P⃗⃗ r3− P⃗⃗⃗⃗⃗ |r1
P′ ⃗⃗⃗
P
⃗⃗ ′(t + 1) =P′⃗⃗⃗ 1+ P′⃗⃗⃗ 2+ P′⃗⃗⃗ 3
3
Step 7: Stopping Criterion
A stochastic optimization approach may be terminated by many criterions that are available nearby. Some of them are maximum no. of iterations, no. of functions evaluations and tolerance. In the present case, maximum no. of iteration is taken for this task.
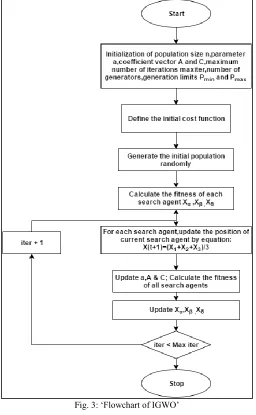
Fig. 3: ‘Flowchart of IGWO’
V. SIMULATION TESTS & RESULTS
In this paper multi-objective economic emission load dispatch problem has been solved for two different test systems. In all cases, the constraints of operating limit and power balance are considered. The program was written in MATLAB (R2009b).The population taken in each case was 30 and maximum numbers of iterations performed were 2000 in test system 1 and 1000 iterations in test system 2.
Test System 1
In this case system, the IGWO algorithm has been implemented on a system consisting of six generator units with transmission loss. The population number is set to 30 and maximum number of iterations performed is 2000. Table 1 shows the comparison of cost and emissions of IGWO with other methods like lambda-iteration, differential evolution, GSA, PSO etc. Figure 4 shows pareto optimal font showing fuel cost and emissions for six generators at 1000 MW power demand’.
Test system 2
power generations, cost and emissions of IGWO with other methods for ten units. Figure 5 shows pareto optimal font showing fuel cost and emissions for ten generators at 2000 MW power demand’.
Table – 1
Comparison of the results for test system 1 (6 generator) (PD = 1000 MW) Methods Cost ($/h) Emission (kg/h) γ -iteration [30] 51264.6 828.720
Recursive [30] 51264.5 828.715
PSO [30] 51269.6 828.863
DE [30] 51264.6 828.715
Simplified recursive [30] 51264.6 828.715 GA similarity [16] 51262.31 827.2612
Proposed GSA 51255.7880 827.1380
IGWO 50365.3051 838.1456
Table – 2
Comparison of the results between multi-objective GSA and multi-objective IGWO for six units with power demand PD = 1000 Unit Proposed GSA [5] IGWO
P1(MW) 78.8221 21.64968
P2(MW) 83.0013 16.25974
P3(MW) 164.2907 163.3899
P4(MW) 164.9136 158.1493
P5(MW) 258.1108 313.1358
P6(MW) 250.8619 313.0282
Cost ($/h) 51255.7880 50365.3051 Emission(kg/h) 827.1380 824.1456
Fig. 4: Pareto optimal font showing fuel cost and emissions for six generators at 1000 MW power demand’
Table – 3
Comparison of the results for test system 2 (10 generator) (PD = 2000 MW)
Unit MODE [12] PDE [12] NSGA-II [12] SPEA 2 [12] Proposed GSA[5] IGWO
P1 (MW) 54.9487 54.9853 51.9515 52.9761 54.9992 17.16465
P2 (MW) 74.5821 79.3803 67.2584 72.8130 79.9586 79.84502
P3 (MW) 79.4294 83.9842 73.6879 78.1128 79.4341 82.92533
P4 (MW) 80.6875 86.5942 91.3554 83.6088 85.0000 81.37967
P5 (MW) 136.8551 144.4386 134.0522 137.2432 142.1063 160
P6 (MW) 172.6393 165.7756 174.9504 172.9188 166.5670 202.7769
P7 (MW) 283.8233 283.2122 289.4350 287.2023 292.8749 292.413
P8 (MW) 316.3407 312.7709 314.0556 326.4023 313.2387 304.1758
P9 (MW) 448.5923 440.1135 455.6978 448.8814 441.1775 414.793
P10 (MW) 436.4287 432.6783 431.8054 423.9025 428.6306 409.2384
Cost (×10^5 $) 1.1348 1.1351 1.1354 1.1352 1.1349 1.1182
Fig. 5: Pareto optimal font showing cost and emissions for ten generators for 2000 MW power demand
VI. CONCLUSION
The IGWO algorithm is efficiently applied for solving multi-objective EELD problem. It is apparent from the obtained results that the proposed IGWO algorithm can evade the deficiency of early convergence of the genetic algorithm and particle swarm optimization methods to get superior solutions. The results confirmed that IGWO was able to give competitive results in comparison to GSA, MODE, PDE, SPEA, NSGA-II. The novel probabilistic model of searching, encircling and hunting the prey handle the trouble of early convergence. Because of simplicity and effectiveness of the IGWO method, it can be useful for searching better results in difficult power system problems in future.
REFERENCES
[1] Nanda, J., Khotari, D. P., and Lingamurthy, K. S., “Economic-emission load dispatch through goal programming techniques,” IEEE Trans. Energy Conversion, Vol. 3, No. 1, pp. 26–32, March 1988.
[2] Wood, A. J. and Wollenberg, B. F., Power Generation, Operation, and Control, 1996, Wiley, New York, 2nd Ed.
[3] Song, Y. H., Wang, G. S., Wang, P. Y., and Johns, A. T., “Environmental/economic dispatch using fuzzy logic controlled genetic algorithms,” IEE Proc. Generat. Transm. Distrib., Vol. 144, No. 4, pp. 377–382, July 1997.
[4] Kumarappan, N.; Mohan, M.R.; Murugappan, S., "ANN approach applied to combined economic and emission dispatch for large-scale system," Neural Networks, 2002. IJCNN '02. Proceedings of the 2002 International Joint Conference on , vol.1, no., pp.323,327, 2002
[5] Abido MA. A novel multiobjective evolutionary algorithm for environmental economic power dispatch. Electr Power Syst Res 2003;65(1):71–81. [6] Abido MA. Environmental/economic power dispatch using multiobjective evolutionary algorithms. IEEE Trans Power Syst 2003;18(4):1529–37. [7] Abido, M. A., “A niched Pareto genetic algorithm for multi-objective environmental/economic dispatch,” Elect. Power Energy Syst., Vol. 25, No. 2, pp. 79–
105, February 2003.
[8] Rughooputh, H.C.S.; Ah King, R.T.F., "Environmental/economic dispatch of thermal units using an elitist multiobjective evolutionary algorithm," Industrial Technology, 2003 IEEE International Conference on , vol.1, no., pp.48,53 Vol.1, 10-12 Dec. 2003
[9] R. T. F. Ah King and H. C. S. Rughooputh, “Elitist Multi-objective Evolutionary Algorithm for Environmental/Economic Dispatch,”Congress on Evolutionary computation, vol. 2, pp. 1108-14, 8-12 Dec.2003.
[10] M. Sudhakaran, S.M.R Slochanal, R. Sreeram and N Chandrasekhar, “Application of Refined genetic Algorithm to Combined Economic and Emission Dispatch” J. Institute Of Engg. (India) volume-85, Sep. 2004pp. 115-119.
[11] Thenmozhi, N.; Mary, D., "Economic emission load dispatch using hybrid genetic algorithm," TENCON 2004. 2004 IEEE Region 10 Conference, vol.C, no., pp.476,479 Vol. 3, 21-24 Nov. 2004 doi: 10.1109/TENCON.2004.1414811.
[12] M. Sudhakaran and S.M.R Slochanal, “Integrating Genetic Algorithm and Tabu Search for Emission and Economic Dispatch Problem” J. Institute of Engg. (India) volume-86, June.2005, pp-22-27.
[13] Perez-Guerrero, R.E.; Cedeno-Maldonado, J.R., "Differential evolution based economic environmental power dispatch," Power Symposium, 2005. Proceedings of the 37th Annual North American , vol., no., pp.191,197, 23-25 Oct. 2005.
[14] AlRashidi, M. R., and El-Hawary, M. E., “Emission-economic dispatch using a novel constraint handling particle warm optimization strategy,” Canadian Conference on Electrical and Computer Engineering 2006, pp. 664–669, Ottawa, Canada, 7–10 May 2006.
[15] Hong-da Liu; Zhong-li Ma; Sheng Liu; HaiLan, "A New Solution to Economic Emission Load Dispatch Using Immune Genetic Algorithm," Cybernetics and Intelligent Systems, 2006 IEEE Conference on , vol., no., pp.1,6, 7-9 June 2006
[16] Hazra, J.; Sinha, A.K., "Environmental Constrained Economic Dispatch using Bacteria Foraging Optimization," Power System Technology and IEEE Power India Conference, 2008. POWERCON 2008. Joint International Conference on , vol., no., pp.1,6, 12-15 Oct. 2008
[17] Hemamalini, S.; Simon, S.P., "Emission constrained economic dispatch with valve-point effect using particle swarm optimization," TENCON 2008 - 2008 IEEE Region 10 Conference, vol., no., pp.1,6, 19-21 Nov. 2008
[18] Bhattacharya, Aniruddha, and P. K. Chattopadhyay. "Application of biogeography-based optimization for solving multi-objective economic emission load dispatch problems." Electric Power Components and Systems 38, no. 3 (2010): 340-365.
[19] Gaurav Prasad Dixit, Hari Mohan Dubey, ManjareePandit, B. K. Panigrahi, “Artificial Bee Colony Optimization for Combined Economic Load and Emission Dispatch”, International Conference on Sustainable Energy and Intelligent System (SEISCON 2011) ,Dr.M.G.R. University, Maduravoyal, Chennai, Tamil Nadu, India. July.20-22, 2011.
[20] Abedinia, O.; Amjady, N.; Naderi, M.S., "Multi-objective Environmental/Economic Dispatch using firefly technique," Environment and Electrical Engineering (EEEIC), 2012 11th International Conference on , vol., no., pp.461,466, 18-25 May 2012
[22] Dinakara Prasad Reddy P, J N Chandra Sekhar ,“Application of Firefly Algorithm for Combined Economic Load and Emission Dispatch” International Journal on Recent and Innovation Trends in Computing and Communication, Vol.2 , No.8(2014):2448-2452.
[23] Nipotepat Muangkote, Khamron Sunat, Sirapat Chiewchanwattana, “An Improved Grey Wolf Optimizer for Training q-Gaussian Radial Basis Functional-link Nets”, International Computer Science and Engineering Conference (ICSEC),2014
[24] Mirjalili, Seyedali. "The ant lion optimizer." Advances in Engineering Software 83 (2015): 80-98.
[25] N. Chopra and S. Mehta, "Multi-objective optimum generation scheduling using Ant Lion Optimization," 2015 Annual IEEE India Conference (INDICON), New Delhi, 2015, pp. 1-6.doi: 10.1109/INDICON.2015.7443839
[26] Dr.Sudhir Sharma,Shivani Mehta, Nitish Chopra, “Economic Load Dispatch using Grey Wolf Optimization”Vol.5-Issue 4(April-2015),International Journal Of Engineering Research and Applications(IJERA),ISSN:2248-9622,www.ijera.com
[27] Guntaas, Mr. Sushil Prashar “Formulation of Improved Grey Wolf Optimization Methodology for ELD Problem” International Journal of Research in Advent Technology, Vol.4, No.5, May 2016, E-ISSN: 2321-9637