Wireless Sensor Networks Suitable for Large-Scale
Heterogeneous Networking
https://doi.org/10.3991/ ijoe.v15i01.9779
Xi Wang
Suzhou Institute of Industrial Technology, Suzhou, China
Feifei Li (*)
Suzhou University, Suzhou, China [email protected]
Abstract—In order to optimize the network architecture, addressing mechanism, heterogeneous nodes and other functions of wireless sensor networks, this study begins with the issue of networking of large-scale heterogeneous networks. A layered distributed network architecture is proposed, which provides a powerful reference for the future architecture of wireless sensor networks. Based on this architecture, the resource addressing of the corresponding hierarchical network, and the scale and location deployment of heterogeneous nodes such as sink nodes are discussed separately, and corresponding strategies and algorithms are proposed. The research results show that the core idea of the addressing mechanism is data-centric, address-oriented addressing is transformed into service-address-oriented addressing. Therefore, the proposed LBA addressing algorithm is suitable for other hierarchically structured networks. In addition, although the sink node is taken as an example for research, it is also suitable for the deployment of other heterogeneous nodes such as sink nodes, relay nodes, and base stations. In summary, regardless of the number of nodes or the location of the deployment, energy-saving factors need to be considered. Energy-saving is also an indispensable technology in wireless sensor network technology.
Keywords—Heterogeneous network, wireless sensor network, node
1
Introduction
area, and they form a multi-hop network system through wireless self-organization. After the sensor information is collected, processed and transmitted, it is finally sent to the observer. Sensors, sensing objects, and observers form the three elements of a sensor network. The emergence of the Internet has created a logical information world for us, thus changing the way people communicate with each other; the advent of wireless sensor networks extends this logical information world to an objective physical world, fuses the two, and enables human-to-human interaction and communication to evolve into human-natural interaction.
Since the wireless sensor network is composed of randomly deployed inexpensive sensor nodes, when some nodes in the network fail, the network can still maintain normal operation with its good self-organizing and fault-tolerant capabilities, and it will not cause the entire network system to crash. It is very suitable for applications in harsh conditions or in unreachable environments. At present, wireless sensor networks are widely used in military, industrial, agricultural, environmental protection, medical and health, space exploration, business and other fields. In an industrial environment, wireless sensor networks have many advantages, including easy installation, flexible deployment, and reduced cost, which can avoid the chaos of "spider webs" in the factory environment. It can be used for real-time monitoring of the production line to help improve efficiency, control power consumption, reduce emissions, reduce maintenance costs, and optimize control. The communication technologies commonly used in Wireless sensor networks in the industrial field include Zig Bee, Wireless HART, ISA100 and China's independent WIA standards. The data link layer of these communication standards is based on the IEEE 802.15.4 protocol. 802.15.4 is an economical, high-efficiency, low-transmission-rate (less than 250 kbps) wireless communication technology operating in 2.4 GHz, supporting applications such as sensors, remote control, and home automation. Its communication range is usually less than 100m. The IEEE 802.15.4 protocol only specifies the physical layer (PHY) and media access control layer (MAC) protocols, and its physical layer uses direct sequence spread spectrum (DSSS) techniques to avoid communication interference. At the MAC layer, the IEEE 802.11 series of CSMA/CA methods in the wireless local area network (WLAN) are mainly used to improve system compatibility.
In environmental monitoring, the use of wireless sensor networks can overcome the difficulty of traditional methods of collecting raw data in harsh environments. For example, deployment of disposable wireless sensor nodes with drone airborne can be performed in extremely difficult areas that are difficult for humans to reach (eg, polar, ocean, desert, etc.). Raw data is collected through the characteristics of the ad hoc network of the wireless sensor network and satellite communication. Wireless sensor networks can also track migration of migratory birds and animals; it can monitor the composition of the oceans, atmosphere and soil; monitor the pollution of rivers, wetlands, and air; study the impact of environmental changes on animals and plants; monitor and predict earthquakes, flash floods, mudslides, landslides, and forest fires.
the Internet of Things, the network scale is expanding day by day. The number of nodes may contain tens of thousands of sensor nodes. The requirements for data collection, transmission, calculation, storage and sharing are getting higher and higher. Compared to traditional communication networks, wireless sensor networks are data-centric networks. Traditional networking technologies such as networking, routing, address allocation, and network deployment can’t be easily applied to wireless sensor networks. With the rapid development of wireless sensor networks and the continuous expansion of application requirements, the networking technology of traditional wireless sensor networks has not adapted to the development of demand.
2
Literature Review
Wireless sensor network node deployment focuses on the following issues: network coverage, network connectivity, network service life, and network cost. From the perspective of node classification, it is mainly divided into the deployment of common sensor nodes and the deployment of heterogeneous nodes. The deployment of common sensor nodes typically focuses on network coverage and connectivity. This type of deployment strategy deploys the sensor node appropriately so that it can completely cover the area to be monitored. And the sensor nodes can interconnect with each other to avoid network fragmentation or coverage loopholes. The deployment of heterogeneous nodes usually refers to the deployment of sink nodes or relay nodes. These nodes have more energy and resources and more powerful data processing capabilities than ordinary nodes. The deployment strategy mainly considers energy consumption or network lifetime issues.
Heterogeneous node deployment studies are mostly the deployment of multiple sink nodes or the deployment of relay nodes. The study of most multi-sink node deployments considers the impact of the location of the sink node on the network lifetime. Sani et al. (2016) studied the deployment strategy of multi-sink nodes in the grid structure and proposed the GEP-MSN algorithm. This deployment strategy can prolong the network lifetime and shorten the response time under specific applications [6]. Assaf et al. (2016) proposed two algorithms, one is the global algorithm for sink node layout based on global information, and the other is the 1hop algorithm based only on adjacent node information, both of which extend the network life to a certain extent [7]. Logambigai et al. (2016) studied the sink nodes with mobility to dynamically move their positions based on energy consumption and distribution, thus extending the network lifetime [8].
3
Methodology
3.1 The design of hierarchical distributed network architecture
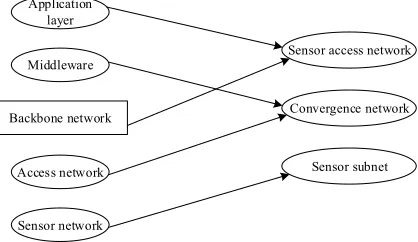
For large-scale sensor networks, the planar structure limits network expansion and flexible access, so it is not suitable as a networking architecture. Because of its good scalability, the hierarchical structure becomes the first choice for large-scale network architectures. To implement networking of large-scale heterogeneous wireless sensor networks, a hierarchical distributed large-scale heterogeneous wireless sensor network networking architecture is proposed, as shown in Figure 1. The architecture consists of a sensor subnetwork, an information aggregation network and a sensor access network to form a three-level networking system. The following describes the three levels of networks.
Fig. 1. The architecture of hierarchical network
The sensor subnet consists of various existing wireless sensor networks, such as Zig Bee subnets, Wi-Fi subnets, etc., which are responsible for collecting raw sensor information. In order to enable heterogeneous wireless sensor networks to be smoothly accessed, this standard does not impose any requirements on the communication systems and networking methods of existing sensor subnets. In a traditional sensor network, the sensor node transmits the collected information to the
Sensor access network
Information Integration network
sink node in one-hop or multi-hop mode. In this structure, the sensor subnet still transmits sensor information to the “sink node” according to its own network mechanism. Only this "sink node" is the upper-level node here. For the sensor subnet, this transmission method does not change, so it does not affect the original networking mechanism of the sensor subnet.
Due to the large scale, the amount of information collected by the wireless sensor network is very large, and it is often necessary to do data aggregation and fusion processing to reduce the amount of data in the network. In previous sensor networks, data fusion processing is performed within the sensor network. When the scale of the network further expands and there are multiple wireless sensor sub-networks, the data fusion requirements may also exist between the sub-networks. This data fusion implemented only internally can’t meet the requirements. After the convergence layer is added, data aggregation and convergence are performed before the data enters the backbone network. This way greatly reduces the amount of data entering the backbone network, reduces the network burden, and improves efficiency. At the same time, this information is stored in the aggregation network as an information sharing platform to facilitate data query and collaborative operations. For the USN architecture, data sharing is low because the data sharing location is at the middleware layer and close to the application layer.
Fig. 2. Hierarchical networking architecture
The main difference between the proposed network architecture and the USN high-level architecture proposed in Y.2002 is that the middleware of the USN is moved down to the backbone network, merged with the access network, and replaced with the information aggregation network, as shown in Figure 2. From the current application of wireless sensor networks in the Internet of Things, it basically belongs to one-to-one or many-to-one communication relationship. That is, one sensor network only serves a specific application, or multiple sensor networks serve a specific application. In the application requirements of the Internet of Things, many-to-many applications may be needed. That is, the data of a sensor network needs to be provided for use by multiple applications, and data needs to be shared cooperatively. Traditional network architecture is difficult to satisfy because of the independence of data aggregation processing. The architecture implements data processing in the layer
Application layer
Middleware
Access network
Sensor network Backbone network
Sensor access network
Convergence network
of information aggregation network, and provides a unified service and sharing platform for upper-layer applications, which is more suitable for the needs of Internet of Things applications.
Analysis of layered architecture features:
Firstly, heterogeneous compatibility: nodes don’t affect the existing sensor
network structure and operating mechanism. Aggregation nodes are sink nodes for sensor subnets. The existing sensor network can be directly accessed without any modification. It has good compatibility and expandability and is very suitable for large-scale applications of the Internet of Things.
Secondly, unified networking: heterogeneous sensor networks with different
communication systems are interconnected. This kind of interconnection includes two aspects: one is to allow smooth access of heterogeneous sensor subnets, that is, access the network at any time and any place, which is especially suitable for gradually deployed networks; the second is to realize self-organizing network between aggregation nodes.
Thirdly, the data aggregation platform: sensor information gathered at the
information convergence layer after being collected by the subnet. Information aggregation has two levels. One is based on the convergence of local sensor network information. The convergence layer performs a collection of sensory information from the same sensor network. The second is the distributed information aggregation based on service types. The information aggregation layer aggregates the information of the same or related service types again according to the service type of the information.
Fourth, information storage sharing platform: the data fusion strategy can be
extended on the information aggregation node, so that the sensor information can be processed with data fusion before entering the sink node, so as to reduce data redundancy. After convergence nodes have converged and fused information, the distributed storage strategy can be adopted to store the information at the business point of the aggregation network, so as to provide different applications when needed.
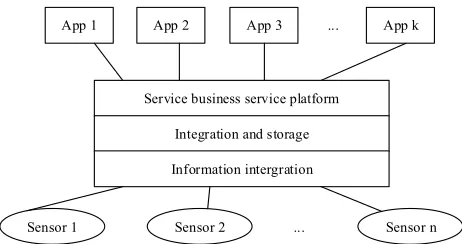
Fifth, sensor business service platform: according to different application
Fig. 3. Information convergence network service framework
Through this distributed network, the information aggregation network realizes logical functions such as collection, integration, storage, and service of sensing information. The basic functional level is shown in Figure 3.
Sixth, normalized data processing: in traditional Internet of Things applications,
the data processing flow varies with different applications and doesn’t have a unified processing model. In this network architecture, the data has a unified data processing flow from the sensor subnet to the application system. This process can be summarized as: information acquisition, aggregation, converged storage, scheduling and distribution. In this way, the normalization of data processing is achieved, and the system architecture becomes easier to implement.
Seventh, support gradual deployment: because different applications and different
regions may use different sensor subnets to collect data, different communication systems may be adopted, and different types of service data may be used. Therefore, the deployment of wireless sensor networks is not always completed in one step but a step-by-step approach. This is a gradual deployment. This gradual deployment puts severe demands on the networking of the network. This architecture can support a gradual deployment structure. For the network deployment of different regions and communication systems, this architecture can complete the networking between different stages of network deployment in batch and step by step.
3.2 The analysis of information aggregation network
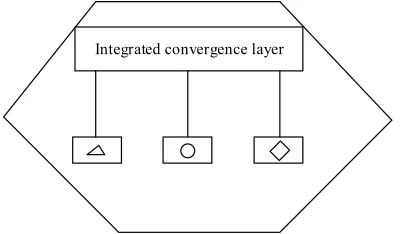
The information aggregation network consists of several aggregation nodes, which are the core components of the entire network architecture. Sink nodes can implement access of multiple homogeneous or heterogeneous subnets in the lower layer. Therefore, information aggregation networks are the key to shielding the differences in lower-layer subnets. The information aggregation node accomplishes this function through a multi-channel structure. The structure of the sink node is shown in Figure 4. Different channels allow access to the sensing subnet of the corresponding communication system. For example, the Zig Bee sensor subnet accesses the sink node through the Zig Bee channel, and the Wi-Fi sensor subnet accesses the sink node through the Wi-Fi channel. The aggregation node has a comprehensive aggregation
Service business service platform
Integration and storage
Information intergration
App 1 App 2 App 3 ... App k
layer for storing and possibly processing data information. The necessary functions such as data fusion strategies can be extended at this level as needed. The aggregation nodes achieve self-organizing networking through wireless communication. The aggregation nodes can transmit information in one or more hops. Since the number of aggregation nodes is relatively small, it may be considered to use a wired power supply or a large-capacity battery in practical applications. Compared with ordinary sensor nodes, the aggregation node has more resources, more powerful processing power, more energy, and therefore belongs to heterogeneous nodes.
Fig. 4. The simulation diagram of network architecture
The information aggregation network and the lower sensor sub-network form a many-to-many access structure. A sink node allows multiple sensor sub-networks to access. At the same time, multiple sensor nodes can be deployed in a sensor sub-network to collect sensing information nearby. This kind of many-to-many structure can not only facilitate the expansion or reduction of sensor subnets, but also increase the flexibility of heterogeneous multi-subnet access and support large-scale network deployment; at the same time, it can effectively shorten the transmission path length of the sensing information in the subnet, reduce the energy consumption and networking complexity of the subnet.
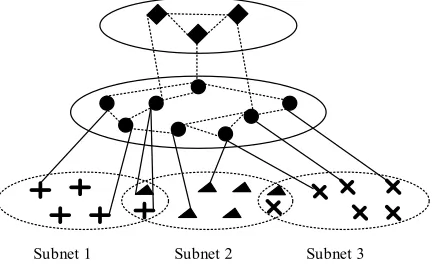
3.3 The design of simulation system
Figure 5 shows the simulation diagram of the network structure. The simulation scenario consists of a sensor subnet, a convergence platform, and an access platform. The sensor subnet consists of three subnets. The aggregation node platform has three nodes as aggregation storage nodes, which store data of three sensor subnets respectively, and other aggregation nodes forward the received data of sensor subnets to the corresponding aggregation storage nodes. Each time the aggregation storage node receives N monitoring data packets, it reports a fused monitoring data packet to the access platform node.
Fig. 5. Schematic diagram of network architecture simulation
In order to verify the feasibility and effectiveness of the addressing scheme, a simulation is implemented in NS2. In the simulation, LBA addressing is compared with Address-Based Addressing (ABA) mechanism and content-based DD and CBP mechanisms. It mainly compares the response time and delay jitter of different query requests, query response time and message delivery rate under different scales. The ABA mechanism is implemented with broadcast addressing.
Table 1. Simulation parameter configuration
Parameter Value
Area division 1200m*1200m
The number of sensor nodes 10*10
The number of aggregation nodes 9
The number of sink nodes 4
Aggregation network protocol AODV
Subnet protocol ZigBee
The number of requested messages 30
The number of data messages 30
Subnet channel transmission rate 250kbps
Table 2. Parameter configuration for different sizes
Node type Scale 1 Scale 2 Scale 3 Scale 4 Scale 5
The number of
sensor node 10*10 14*14 17*17 21*21 25*25
The number of
aggregation nodes 9 16 25 36 49
The number of sink
nodes 4 9 16 52 36
In order to compare the response time and delay jitter of different query requests, 100 sensor nodes, 9 aggregation nodes, and 4 sink nodes are arranged with a grid topology in a simulation area of 1200m×1200m. There are 3 types of services in the
entire area: temperature, humidity, and light. The Zig Bee network is used in the sensor subnet, and the AODV routing protocol is adopted in the convergence network. The user generates 30 different query tasks respectively, and queries the values of temperature, humidity, and illumination in different areas, and records the response time and delay jitter of the 30 query requests. Simulation parameters are shown in Table 1.
In order to compare the query response time and message delivery rate under different scales, five network scales are designed in the simulation environment. In different network scenarios, the number of sensor nodes, aggregation nodes, and sink nodes changes accordingly. The specific number of each node is shown in Table 2. In this scenario, the temperature values of one area are queried under five sizes.
4
Result
4.1 Analysis of gradual deployment simulation results
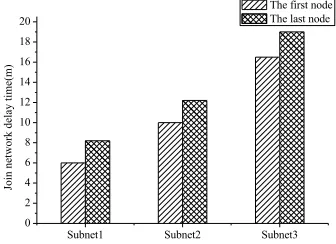
In order to verify that the network architecture can support gradual deployment, the simulation system operates without sensor subnets in the initial state; deploy subnet 1, subnet 2, and subnet 3 (ie, open the nodes in the subnet) at the 5th, 10th, and 15th minutes, and record the delay of the subnet joining the network. The experimental results are shown in Figure 6, in which the ordinate unit "m" represents minutes.
Fig. 6. Time delay of the sensor subnet joining the network
Figure 6 shows the time when the first sensor node and the last sensor node in the three sensing subnets join the network. The time when the last sensor node joins the network is the total time that the subnet joins the network. It can be concluded that three different types of sensor sub-networks deployed in different stages can smoothly join the network through their respective wireless channels. The time for the last node of the three subnets to join the network is 8.2m, 12.1m, and 18.9m, respectively. Considering that the initial start-up time of the three subnets is 5m, 10m and 15m respectively, the total time of the three subnets from starting to joining the network is
Subnet1 Subnet2 Subnet3
0 2 4 6 8 10 12 14 16 18 20
Join
ne
twork de
la
y ti
me
(m)
3.2m, 2.1m and 3.9m respectively. It can be concluded that subnet 2(i.e. Wi-Fi subnet) has a shorter time to join, mainly because the ability of self-organizing networking of Wi-Fi network is faster, so the overall time delay of joining network is shorter. It should be noted that in NS2, there should be a certain gap between the simulated subnet access delay and the actual application. It should be noted that there should be a certain gap between the simulated subnet access delay and the actual application. Because in practical applications, the start-up time of the sensor node is related to the artificial opening time and system performance on the sensor node, and all the nodes in the simulation system can be set to be turned on at the same time. The start-up time should be much less than the actual application. Therefore, the result of this simulation is a functional result, not a performance result.
4.2 Analysis of simulation results of different scale deployments
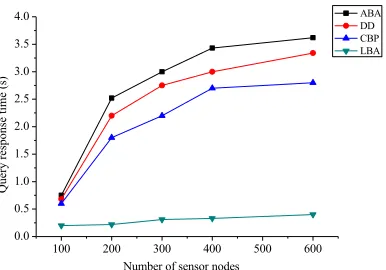
Figure 7 is a comparison of query response times for several addressing mechanisms at different scales. It can be concluded from the figure, as the network scale increases, query response time for Address-Based Addressing (ABA), Directed Diffusion (DD), and Content-Based routing Protocol (CBP) increases significantly, and the query response time of Label-Based Addressing (LBA) don’t change much. The larger the network size, the greater the increase in the number of redundant messages caused by the broadcast query method. On the other hand, the more sensor nodes that satisfy the query request, the more the number of responding messages. Therefore, the impact on the query response delay is also greater. Because the LBA addressing mechanism is addressed by tags, the network scale has little impact on the response delay. From the figure, when the network size is 100 sensor nodes, the response time of the other three algorithms is 3-5 times that of LBA. When the network scale reaches 600 sensor nodes, this figure reaches 7-8 times. This shows that LBA is more suitable for large-scale network applications.
Fig. 7. Response time at different scales
100 200 300 400 500 600
0.0 0.5 1.0 1.5 2.0 2.5 3.0 3.5 4.0
Que
ry r
esponse
ti
me
(s)
Number of sensor nodes
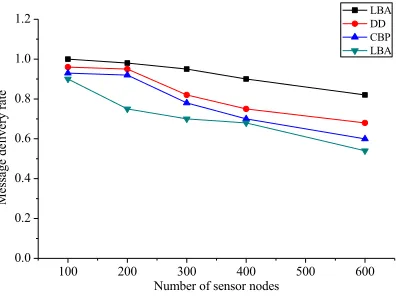
Figure 8 compares the message delivery rates of several addressing mechanisms. It can be concluded from the figure, as the network scale increases, LBA always maintains a high message delivery rate. When the network scale reaches 600 nodes, LBA can still maintain 80% of the message delivery rate. However, as the number of other types of addressing mechanisms increases, the delivery rate of messages drops significantly. This is because the number of LBA query messages and response messages is small and it is not easy to lose. In the other three mechanisms, because broadcast queries are used, although query messages are not lost, a large number of broadcast messages are likely to cause the loss of query response messages.
Fig. 8. Message delivery rate
5
Conclusion
Starting from the networking problem of large-scale heterogeneous networks, a layered and distributed network architecture is proposed, which provides a powerful reference for the architecture of wireless sensor networks in the future. Based on this architecture, the resource addressing of the corresponding hierarchical network, as well as the size and location deployment of heterogeneous nodes such as aggregation nodes and sink nodes, are also discussed separately, and corresponding strategies and algorithms are proposed. Although the addressing mechanism and deployment strategy are discussed based on the proposed network architecture, they are still applicable in sensor networks of other structures. The core idea of the addressing mechanism is data-centric, translating address-oriented addressing into service-oriented addressing. Therefore, the proposed LBA addressing algorithm is suitable for other hierarchically structured networks. Chapters 4 and 5 discuss the deployment of heterogeneous nodes. Although the study is based on sink nodes, it is also suitable for other heterogeneous nodes such as aggregation nodes, relay nodes, and base stations. Regardless of the number of nodes or the deployment of locations, energy-saving factors need to be considered. Energy-saving is also an indispensable and necessary technology in wireless sensor network technology.
100 200 300 400 500 600
0.0 0.2 0.4 0.6 0.8 1.0 1.2
Me
ssa
ge
de
live
ry r
ate
Number of sensor nodes
6
References
[1]Halder, S., & Ghosal, A. (2016). A survey on mobile anchor assisted localization techniques in wireless sensor networks. Wireless Networks, 22(7): 1-20.
https://doi.org/10.1007/s11276-015-1101-2
[2]Wu, S., Niu, J., Chou, W., & Guizani, M. (2016). Delay-aware energy optimization for flooding in duty-cycled wireless sensor networks. IEEE Transactions on Wireless Communications, 15(12): 8449-8462. https://doi.org/10.1109/TWC.2016.2615296
[3]Naranjo, P. G., Shojafar, M., Mostafaei, H., Pooranian, Z., & Baccarelli, E. (2017). P-sep: a prolong stable election routing algorithm for energy-limited heterogeneous fog-supported wireless sensor networks. Journal of Supercomputing, 73(2): 1-23.
https://doi.org/10.1007/s11227-016-1785-9
[4]Fu, L., He, L., Cheng, P., Gu, Y., Pan, J., & Chen, J. (2016). Esync: energy synchronized mobile charging in rechargeable wireless sensor networks. IEEE Transactions on Vehicular Technology, 65(9): 7415-7431. https://doi.org/10.1109/TVT.2015.2481920
[5]Shao, J. F., & Tian, W. Z. (2016). Energy-efficient rssi-based localization for wireless sensor networks. IEEE Communications Letters, 18(6): 973-976.
[6] Sani, A., & Vosoughi, A. (2016). Distributed vector estimation for power- and bandwidth-constrained wireless sensor networks. IEEE Transactions on Signal Processing, 64(15): 3879-3894. https://doi.org/10.1109/TSP.2016.2552504
[7]Assaf, A. E., Zaidi, S., Affes, S., & Kandil, N. (2016). Low-cost localization for multihop heterogeneous wireless sensor networks. IEEE Transactions on Wireless Communications, 15(1): 472-484. https://doi.org/10.1109/TWC.2015.2475255
[8]Logambigai, R., & Kannan, A. (2016). Fuzzy logic based unequal clustering for wireless sensor networks. Wireless Networks, 22(3): 945-957. https://doi.org/10.1007/s11276-015-1013-1
7
Authors
Xi Wang is working in Suzhou Institute of Industrial Technology, Suzhou, China,
His research interests include Optimization Algorithm.
Feifei Li is working in Suzhou University, Suzhou, China, His research interests
include wireless sensor network.