JIEM, 2016 – 9(2): 487-504 – Online ISSN: 2013-0953 – Print ISSN: 2013-8423 http://dx.doi.org/10.3926/jiem.1425
The Optimal Parameter Design for a Welding Unit of Manufacturing
Industry by Taguchi Method and Computer Simulation
Seyed Mojib Zahraee1 , Ali Chegeni2 , Arshin Toghtamish3
1Department of Mechanical Engineering, Universiti Teknologi PETRONAS (UTP) (Malaysia)
2Faculty of Mechanical Engineering, Department of Industrial Engineering, Universiti Teknologi Malaysia (Malaysia) 3Department of Industrial Engineering, International Branch of Ferdowsi University, Mashhad (Iran)
[email protected], [email protected], [email protected]
Received: February 2015
Accepted: April2016
Abstract:
Purpose: Manufacturing systems include a complicated combination of resources, such as materials, labors, and machines. Hence, when the manufacturing systems are faced with a problem related to the availability of resources it is difficult to identify the root of the problem accurately and effectively. Managers and engineers in companies are trying to achieve a robust production line based on the maximum productivity. The main goal of this paper is to design a robust production line, taking productivity into account in the selected manufacturing industry.
Design/methodology/approach: This paper presents the application of Taguchi method along with computer simulation for finding an optimum factor setting for three controllable factors, which are a number of welding machines, hydraulic machines, and cutting machines by analyzing the effect of noise factors in a selected manufacturing industry.
2, and 1, respectively. This paper has a significant role in designing a robust production line by considering the lowest cost and timely manner based on the Taguchi method.
Keywords: Taguchi method; computer simulation; optimal parameter design; manufacturing industry
1. Introduction
combinations of factors were examined. It is easier also to justify the recommendations because the verification runs have validated the result of the model (Hatami et al., 1990). On the other hand, manufacturing managers believe that productivity improvement is an important research problem and there is a need to implement a new approach by considering the time and cost which lead to a high level of profit. This paper contributes to integrate simulation modeling with statistical Taguchi method, which analyze and optimize manufacturing system productivity. It introduces a new idea for using computer simulation and proposing different scenarios as the input of Taguchi. This approach provides a valuable contribution, because it is impossible to stop the operating system or change the layout due to constraints of cost, time, labor, and many other factors. The novelty of this study lies on integration of simulation and Taguchi method in a Welding Unit of Manufacturing Industry which will lead to a predictable model for optimization of the best scenario for the production line considering two perspectives of controllable and noise factors.
2. Literature Review
Computer simulations have been widely applied to solve operational problems and to improve the productivity and performance in different fields, such as manufacturing systems (Zahraee, Golroudbary, et al., 2014), port container terminal (Shahpanah, Poursafary, Shariatmadari, Gholamkhasi & Zahraee, 2014; Shahpanah, Hashemi, Nouredin, Zahraee & Helmi, 2014), supply chain management (Memari, Zahraee, Anjomanshoae & Rahim, 2013), different services such as bank system (Hatami, Zahraee, Ahmadi, Golroudbary & Rohani, 2014) and construction management (Zahraee, Rezaei, Shahpanah, Chegeni & Rohani, 2014), which are not easy to model. There are many advantages of using manufacturing simulation in the manufacturing systems through saving the money investment, enhancing the resource utilization, reducing the process cycle time, and incrementing of the throughput (Zahraee, Golroudbary et al., 2014). Computer simulation have applied and proposed in order to deal with the problems and variations in the integrated manufacturing systems. It is very useful to analyze, design, and schedule the manufacturing systems and apply simulation instead of using complex mathematical model equations (Tsai, 2002).
Traditionally, the experimental designs have been used in physical experiments, such as agriculture experiments and clinical tests. Due to the large number of input variables and high cost of conducting experiments, performance of physical experiment is practically impossible. Therefore, computer simulation is utilized as a powerful and useful tool, by which experimental trials could be conducted in a low-cost and reliable environment (Wang & Halpin, 2004; Hassan & Gruber, 2008; Ebrahimi, AbouRizk, Fernando & Moha, 2011).
Manufacturing system includes the complicated combination of resources such as material, labor, machines and methods. So, when the manufacturing systems are faced with a problem, it is difficult to identify the root of problem accurately and effectively (Zahraee, Shariatmadari, Ahmadi, Hakimi & Shahpanah, 2014). In order to deal with these problems engineers, would apply experimental design to recognize the important factors which have affected system performance. In fact, by using the design of experiments, it is possible to estimate how changes in input variables influence on the result of response of the experiment (Zahraee, Shariatmadari et al., 2014). Mishra and Pandey (1989) used the DOE and simulation study of flexible manufacturing systems for the evaluation of system performance. Some factors such as number of tardy jobs, number of completed jobs, number of running and waiting jobs, mean processing time, inter arrival time and average machine utilization considered for determination of optimized value of these factors to optimize system performance. Cheng and Kleiinen (1995) established optimal DOE with simulation models of nearly saturated queues. The application of computer simulation herein suggested and executed to solve the problems of variation in incorporated manufacturing systems. However, a simulation model merely acts as a device in investigating performance. Tsai (2002), focused on assessment and optimization of joined manufacturing system operations with the aim of experimental design in computer simulation. The results show that this approach could consider the assessment and optimization of operating situations in multifaceted systems concurrently.
Heavey (2011). Zahraee, Shariatmadari et al. (2014) used the DOE and computer simulation in order in order to find the optimum combination of factors that have the significant effect on the process productivity. Another investigation applied statistical analysis and computer simulation to recognize and to weigh the significance of different factors in the production line. Based on the final result, the two factors i.e. B (Number of labor) and C (Failure time of lifter) have the most significant effect on the manufacturing system productivity (Hatami, Zahraee, Khademi et al., 2014). Zahraee, Chegeni et al. (2015) used computer simulation and Taguchi method in order to assess the effect of controllable and uncontrollable factors on the total output production in a color manufacturing industry. Final result showed that the maximum desirability of productivity will be achieved when the value of factors such service rate of delpak machine=UNIF (30, 40), number of labor=14, inspection time=120 and number of Permil=5. They claimed that Taguchi method plays an efficient and suitable role in the process improvement, proposing adjustments that will provide an improvement in the productivity. Previous studies on this field show that the simulation results can be used as an input to the design of experiment. Simulation and statistical analysis are some tools to analyze the behavior of a system. In this study the behavior of the welding unit of manufacturing industry was simulated and the model outputs were used as the raw data of Taguchi approach. According to the previous literature, this is the first attempt to analyze a manufacturing system using an integrated simulation-Taguchi model. Trying to fill the gap in the literature, this paper proposes an integrated simulation-Taguchi model to design a robust production line, taking productivity into account in a selected manufacturing industry.
3. Materials and Methods
3.1. Case Study
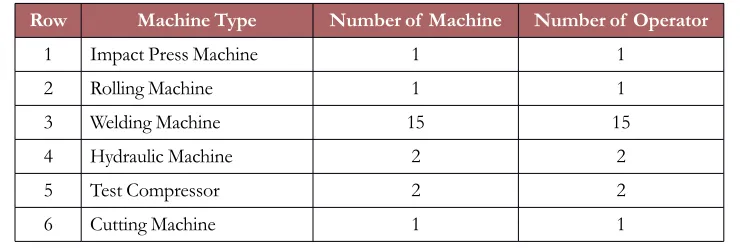
Row Machine Type Number of Machine Number of Operator
1 Impact Press Machine 1 1
2 Rolling Machine 1 1
3 Welding Machine 15 15
4 Hydraulic Machine 2 2
5 Test Compressor 2 2
6 Cutting Machine 1 1
Table 1. Details of equipment and operators
It should be noted that, there is one operator in source preparation test station and three in coal grinding stations. Therefore, the total number of operators can be reached to 26 people. Welding station consists of several smaller units and has the following specifications:
• Raw materials: Raw materials in the welding station which are considered for simulation parts include heater fount galvanized sheet and 110 intermediate tube.
• First Station: In order to obtain hot and cold waters inputs and outputs, the cut sheet laminator is placed in to the impact press machine and punched by the operator. (Resource consumption: a press workman, an impact press machine.)
• Second Station: Punched- card form the first satiation placed in rolling machine and rolled. In this way, the overall form of heater fount created. (Resource consumption: a rolling workman, a rolling machine.)
• Third Station: Both sides of the heather source are located on one direction by the operator and spot welding procedure is done by the welding machine. (Resource consumption: a welder man, a welding machine.)
• Fourth Station: Spot welded sources are placed on a base by another operator while they are perfectly welded in Longitudinal Order from the inside part. (Resource consumption: a welder man, a welding machine.)
• Sixth Station: after spot welding procedure, each source is placed on the base and a full range of welding spots will be welded to the source. (Resource consumption: a welder man, a welding machine.)
• Seventh Station: in this station, 2 sockets which are placed on top of the supplier are welded through welding machine. (Resource consumption: a welder man, a welding machine) sockets are purchased beforehand.
• Eighth Station: in a similar process like seventh station, 3 connections are welded to the bottom of the source operator. (Resource consumption: a welder man, a welding machine.)
• Ninth Station: in this station the source is posed by pressing the prepared bowl which is prepared from the other input. (Resource consumption: a labor press, hydraulic press machine.)
• Tenth Station: At this stage, the suspension clamp is welded to the source. (Resource consumption: a welder man, a welding machine). Prepared Hanger clamps are brought to this unit from the paneling station.
• Eleventh Station: Afterward the operator performs the last coal grinding process on welds position. (Resource consumption: a worker.)
• Twelfth Station: this part is a phase for preparing resource test and fastening the sockets, which include wrapping hemp around the sockets and also fastening the screw stopper. (Resource consumption: a worker.)
• Thirteenth Station: After preparation, each source is placed on the foundation and the test operation will be done by water pump. The operator blocks sockets by screws. Providing the fact that there is a hole in place of sockets, it should be marked in order to do troubleshooting at the next stop. (Resource consumption: A worker, a compressor.)
• Fourteenth Station: The connectors which have been prepared in paneling station should be welded to the source and if there is mark due to the hole on the source from the previous station, troubleshooting process performed. (Resource consumption: a welder man, a welding machine).
• Fifteenth Station: Before sending the connecters from 15th unit, 3 fasteners will be welded to them. (Resource consumption: a welder man, a welding machine) prepared fasteners are brought to this unit from the paneling station.
• Seventeenth Station: In order to construct the junction between black pipe and pipe 110, press machine punches the pipe in this station. (Resource Consumption: labor press, hydraulic press machine) black pipes are purchased beforehand.
• Eighteen Station: Afterwards in the next carbine, five black pipes of each heater are spot welded to pipe 110 by the operator. (Resource Consumption: a welder man, a welding machine.)
• Nineteenth Station: In this station operator welds two pipes together into a fully integrated and allows connections to be exact and seamless. (Power consumption: a welder man, a welding machine.)
• Twentieth station: Coal grinding is done in place of welds in order to prepare tubes for the test phase. (Resource consumption: a worker.)
• Twenty-first Stations: Next step is to test if there is a hole in the pipe. In this case restorative welding will be done in this unit. (Resource consumption: A test worker, a compressor.)
• Twenty-second Stations: After testing, the bowl, which was already prepared in framing station and the pipe are spot welded to each other by the operator. (Resource consumption: a welder man, a welding machine.)
• Twenty-third Stations: In the next cabin the junction of the pipe and the bowl is fully welded. (Resource consumption: a welder man, a welding machine.)
• Twenty-fourth Stations: Eventually, the operator performs coal-grinding procedures on weld area in order to prepare it for placing on a source. (Starting at the ninth station), (Resource Consumption: A welder man, a welding machine.)
3.2. Building Simulation Model
Having determined the different involved resources in the manufacturing process along with their relationship, their duties, and the fitted probability distribution of each data sample of activity duration, the simulation model of the considered manufacturing system should be developed. In order to construct the simulation model, simulation software, Arena 13.9 is selected.
3.2.1. Simulation Model Validation
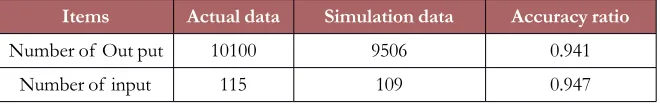
After simulating the production line of this company, some information including the number of orders and product outputs that were available for 2 working years were added to the company’s documents, especially the sales list. After gathering the information, they were compared to the obtained results of the simulation and the final founding is revealed in the table 2. As it is shown in the table 2, the results are 90% accurate. However, these results are because of the reason that the number of samples was large enough and the statistical distributions were estimated with high approximation.
Accuracy ratio Simulation data
Actual data Items
0.941 9506
10100 Number of Out put
0.947 109
115 Number of input
Table 2. Result of simulation model validation
3.3. Taguchi Method
3.3.1. Choosing Control and Noise Factors
In this paper, the number of main machines, which is the number of Welding Machines (A), Hydraulic Machines (B) and Cutting Machines (C) were selected as controllable factors. Additionally, the noise factors in this paper is mean time to repair (MTTR) for the selected controllable factors. A noise factor can affect a specific simulation element in a way that varies the standard deviation of its probability distribution.
3.3.2. Choice of Factors Levels
The variation range or levels of control and noise factors are indicated in Table 3. As can be seen, each factor has a low (–1) and high (+2) level. The specified levels are considered based on the discussion with the managers and collected data for building the simulation model.
Main Factors Noise Factors
Level Number
of Welding Machine
(A)
Number of Hydraulic
Machine (B)
Number of Cutting
Machine (C)
MTTR of Welding
Machine (E)
MTTR of Hydraulic
Machine (F)
MTTR of Cutting
Machine (G) Low level
(1) 15 2 1 UNIF(8.41, 1.53) UNIF(1.15+004) UNIF(805, 1.04)
High level
(2) 17 4 3 UNIF(8.41+004) UNIF(1.15+008) UNIF(805, 1.08)
Table 3. Main and noise factors and levels
3.3.3. Selection of the Orthogonal Array Design
L8 (2^7) Series Factor
Experiment A B C D E F G
1 1 1 1 1 1 1 1
2 1 1 1 2 2 2 2
3 1 2 2 1 1 2 2
4 1 2 2 2 2 1 1
5 2 1 2 1 2 1 2
6 2 1 2 2 1 2 1
7 2 2 1 1 2 2 1
8 2 2 1 2 1 1 2
Table 4. Table of L8 OA
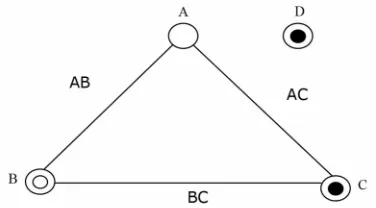
Figure 1. Linear graph for L8 OA design
4. Result and Findings
4.1. Performing Simulation Experiments
After considering the above conditions, the simulation model is run for different experiments. In a manufacturing system the output variables of the simulation modeling are considered as system performance assessed in total output production. This measure named process productivity that can be defined as:
Process Productivity = × (100).
Table 5 indicates the results of performing the simulation experiment. Data analysis was done in Minitab software. This table has two columns, which calculate the values of Signal-to-Noise Ratio (SNR) and Mean. Since the response is a nonnegative value and is to be maximized, calculation of SNR is done based on the situation “Larger is better”. In this situation, the below formula is applied for calculating the SNR:
Run L8 OA Controllable Factor
L4 OA (Noise Factor)
Mean SN Ratio
E 1 1 2 2
F 1 2 1 2
G 1 2 2 1
A B C
1 1 1 1 53.6 60.3 60.7 61 58.90 35.3639
2 1 1 2 72.56 70.8 62.0 71 69.09 36.7369
3 1 2 1 73.00 75.0 81.0 70 74.75 37.4357
4 1 2 2 69.00 65.0 66.0 55 63.75 35.9909
5 2 1 1 79.00 75.0 83.0 73 77.50 37.7545
6 2 1 2 77.00 80.0 74.0 70 75.25 37.4982
7 2 2 1 75.00 71.0 77.0 79 75.50 37.5384
8 2 2 2 62.00 65.0 66.0 69 65.50 36.3058
Average 70.03 36.82
Table 5. Analysis of the data produced by Minitab software
4.2. Optimal Parameter Design
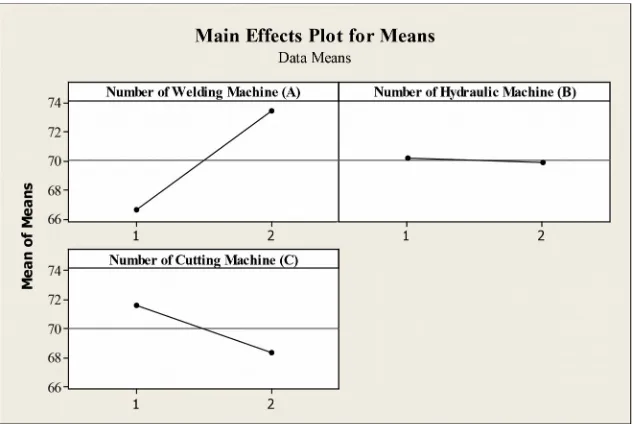
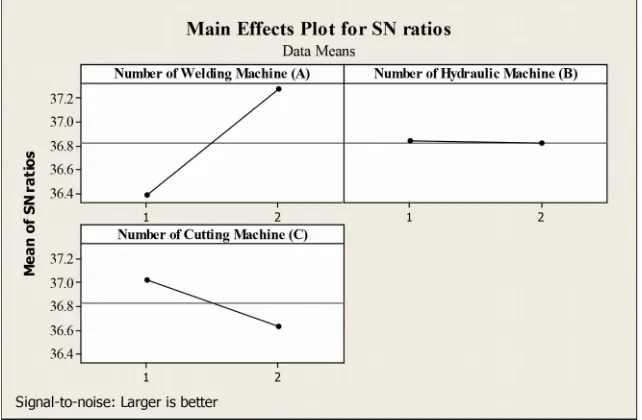
In order to determine the optimal parameter design, the graphical analysis of mean and SNR were conducted based on the graphs produced by Minitab for these variables. Figures 2 and 3 show the plots of main effects for mean and SNR. As can be seen in both graphs, the number of welding machines (A) is the most significant factors. In contrast, the number of hydraulic machines (C) have the lowest effect on the mean and SNR.
Figure 3. Main effect plot of SN ratio
Table 6 and Table 7 ranked the studied factors based on their effect value to make decision regarding which level is better for maximizing productivity; The SNR values at both levels of each main factor were compared. Table 5 and 6 indicate the optimal control factors setting based on the highest SNR. It can be concluded that to achieve a maximum productivity, the optimum level for factor A is located at level 2, also the optimum level for factor B and C is located at level 1. This means that, the optimal parameter design for the welding unit of manufacturing industry is obtained when the number of welding machines, hydraulic machines, and cutting machines is equal to 17, 2, and 1 by considering the noise factors effect.
Factor Level Number of Welding
Machines (A) Number 0f HydraulicMachines (B) Number of Cuttingmachines (C)
1 66.62 70.19 71.66
2 73.44 69.88 68.40
Delta 6.81 0.31 3.26
Rank 1 3 2
Optimum Level 2 1 1
Factor Level Number of Welding
Machines (A) Number 0f HydraulicMachines (B) Number of Cuttingmachines (C)
1 36.38 36.84 37.02
2 37.27 36.82 36.63
Delta 0.89 0.02 0.39
Rank 1 3 2
Optimum Level 2 1 1
Table 7. Effect and ranking of sn ratio for each controllable factor
4.3. Regression Model
Regression models (Equation 2 and 3) designed for the mean and SNR based on the estimated effects, ranking, and optimum level of control factors.
(2)
(3)
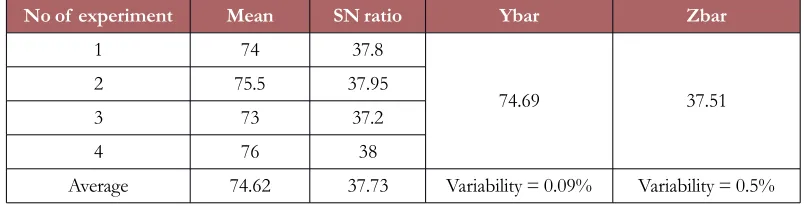
4.4. Confirmation
In order to do the confirmation test, the simulation experiment is run 4 times in the optimum condition of main factors. Table 8 shows the comparison of predicted value of mean and SNR at the optimum levels by considering the obtained optimum condition and regression models of mean and SNR. As can be seen, the calculated variation in mean and SNR are 0.09 and 0.5 respectively. Therefore, the variation values of confirmation test claimed that the regression models are fitted to the data.
No of experiment Mean SN ratio Ybar Zbar
1 74 37.8
74.69 37.51
2 75.5 37.95
3 73 37.2
4 76 38
Average 74.62 37.73 Variability = 0.09% Variability = 0.5%
5. Conclusion
In this paper, the authors suggested the design of a robust production line, which takes productivity into account in the welding unit of a selected manufacturing industry. This paper has presented an application of the Taguchi method and computer simulation to find the optimum factor setting for three controllable factors which are a number of welding machines, hydraulic machines, and cutting machines by analyzing the effect of noise factors. To achieve the goal, after conducting the computer simulation experiments, the model outputs were used as the raw data of Taguchi approach in order to determine the effect of factors on the productivity and to determine the main factor setting that gave the optimum productivity. The final result showed that the optimal parameter design of selected manufacturing industry will be achieved when the level for factor A is located at level 2 and the level for factor B and C in located at level 1. Therefore, the maximum desirability of productivity is obtained when the number of welding machines, hydraulic machines, and cutting machines is equal to 17, 2, and 1 respectively.
References
Antony, J., & Antony, F.J. (2001). Teaching the Taguchi method to industrial engineers. Work Study, 50(4), 141-149.http://dx.doi.org/10.1108/00438020110391873
Basler, F., & Sepulveda, J. (2004). The use of somulation and design of experiment for productivity improvement in the sawmill industry.Proceeding of 36th Winter Simulation Conference. 1218-1221.
Can, B., & Heavey, C. (2011). Comparison of experimental designs for simulation-based symbolic regression of manufacturing systems. Computers & Industrial Engineering, 61(3), 447-462. http://dx.doi.org/10.1016/j.cie.2011.03.012
Cheng, R.C., & Kleijnen, J. (1995). Optimal design of simulation experiments with nearly saturated queues
(No. 1995-67). Tilburg University, Center for Economic Research.
Chuang, S.C., & Hung, Y.C. (2010). Uniform design over general input domains with applications to target region estimation in computer experiments. Computational Statistics & Data Analysis, 54(1), 219-232. http://dx.doi.org/10.1016/j.csda.2009.08.008
Ebrahimi, Y., AbouRizk, S., Fernando, M., & Moha, S. (2011). Simulation modeling and sensitivity analysis of a tunneling construction project’s supply chain. Engineering, Construction and Architectural Management,
Hassan, M., & Gruber, S. (2008). Simulation of concrete paving operations on Interstate-74. Journal of Construction Engineering and Management,134(1), 2.http://dx.doi.org/10.1061/(ASCE)0733-9364(2008)134:1(2)
Hatami, S., Cowley E., & Morey C., (1990). Using experimental design to improve the efficiency of simulation modeling-A manufacturing perspective.Proceeding of the 1990 Winter Simulation Conference. 310-313.http://dx.doi.org/10.1109/WSC.1990.129532
Hatami, M., Zahraee, S.M., Ahmadi, M., Golroudbary, S.R., & Rohani, J.M. (2014). Improving Productivity in a Bank System by Using Computer Simulation. In Applied Mechanics and Materials, 606, 259-263.http://dx.doi.org/10.4028/www.scientific.net/AMM.606.259
Hatami, M., Zahraee, S.M., Khademi, A., Shahpanah, A., & Rohani, J.M. (2014). Evaluating the Effect of Main Factors in Manufacturing Production Line Based on Simulation Experiment.Applied Mechanics and Materials,606, 199-203. http://dx.doi.org/10.4028/www.scientific.net/AMM.606.199
Jahangirian, M., Eldabi, T., Naseer, A., Stergioulas, L.K., & Young, T. (2010). Simulation in manufacturing a n d b u s i n e s s : A r e v i e w.European Journal of Operational Research, 203(1), 1-13. http://dx.doi.org/10.1016/j.ejor.2009.06.004
Kelton, W. (1999). Designing simulation experiments. Proceeding of the Winter Simulation Conference. Piscataway, New Jersy. 33-38.http://dx.doi.org/10.1145/324138.324146
Memari, A., Zahraee, S.M., Anjomanshoae, A., & Rahim, A.R.B.A. (2013). Performance Assessment in a Production-Distribution Network Using Simulation. Caspian Journal of Applied Sciences Research, 2(5), 48-56.
Mishra, P., & Pandey, P. (1989). Simulation studies of flexible manufacturing systems using statistical design of experiment. Computer Industrial Engineering, 16(1), 65-74. http://dx.doi.org/10.1016/0360-8352(89)90009-0
Montevechi, J., Pinho, A., Leal, F., & Marins, F. (2007). Application of design of experiment on the simulation of a process in an automotive industry. Proceedings of the Winter Simulation Conference. 1601-1609. http://dx.doi.org/10.1109/wsc.2007.4419779
Nazzala, D., Mollaghasemi, M., & Anderson, D. (2006). A simulated-based evaluation of the cost of cycle time reduction in Agree Systems wafer fabrication facility- a case study.International Journal of Production Econimics,100, 300-313. http://dx.doi.org/10.1016/j.ijpe.2004.12.026
Sargent, R.G. (2005). Verification and validation of simulation models. Proceeding of 37th Winter Simulation Conference. 130-143.http://dx.doi.org/10.1109/wsc.2005.1574246
Shahpanah, A., Poursafary, S., Shariatmadari, S., Gholamkhasi, A., & Zahraee, S.M. (2014). Optimization Waiting Time at Berthing Area of Port Container Terminal with Hybrid Genetic Algorithm (GA) and Artificial Neural Network (ANN).Advanced Materials Research,902, 431-436.
http://dx.doi.org/10.4028/www.scientific.net/AMR.902.431
Shahpanah, A., Hashemi, A., Nouredin, G., Zahraee, S.M., & Helmi, S.A. (2014). Reduction of Ship Waiting Time at Port Container Terminal Through Enhancement of the Tug/Pilot Machine Operation.
Jurnal Teknologi, 68(3).http://dx.doi.org/10.11113/jt.v68.2931
Steibel, J.P., Rosa, G.J., & Tempelman, R.J. (2009). Optimizing design of two-stage experiments for transcriptional profiling.Computational Statistics & Data Analysis, 53(5), 1639-1649. http://dx.doi.org/10.1016/j.csda.2008.03.032
Tack, L., & Vandebroek, M. (2002). An adjustment algorithm for optimal run orders in design of experiments.Computational Statistics & Data Analysis, 40(3), 559-577. http://dx.doi.org/10.1016/S0167-9473(02)00056-7
Tsai, C.S. (2002). Evaluation and optimisation of integrated manufacturing system operations using Taguchi's experiment design in computer simulation. Computers & Industrial Engineering, 43(3), 591-604. http://dx.doi.org/10.1016/S0360-8352(02)00127-4
Wang, S., & Halpin, D. (2004). Simulation experiment for improving construction processes. Proceedings of the 2004 Winter Simulation Conference. Washington, DC, USA. 5-7.http://dx.doi.org/10.1109/WSC.2004.1371457
Zahraee, S.M., Golroudbary, S.R., Hashemi, A., Afshar, J., & Haghighi, M. (2014). Simulation of Manufacturing Production Line Based on Arena.Advanced Materials Research,933, 744-748. http://dx.doi.org/10.4028/www.scientific.net/AMR.933.744
Zahraee, S.M., Rezaei, G., Shahpanah, A., Chegeni, A., & Rohani, J.M. (2014). Performance Improvement of Concrete Pouring Process Based Resource Utilization Using Taguchi Method and Computer Simulation.Jurnal Teknologi, 69(1), 17-24.http://dx.doi.org/10.11113/jt.v69.2225
Zahraee, S.M., Shariatmadari, S., Ahmadi, H.B., Hakimi, S., & Shahpanah, A. (2014). Application of Design of Experiment and Computer Simulation to Improve the Color Industry Productivity: Case Study.Jurnal Teknologi, 68(4), 7-11.http://dx.doi.org/10.11113/jt.v68.2988
Zahraee, S.M., Rohani, J.M., Firouzi, A., & Shahpanah, A. (2015). Efficiency Improvement of Blood Supply Chain System Using Taguchi Method and Dynamic Simulation. Procedia Manufacturing, 2, 1-5. http://dx.doi.org/10.1016/j.promfg.2015.07.001
Journal of Industrial Engineering and Management, 2016 (www.jiem.org)
Article's contents are provided on an Attribution-Non Commercial 3.0 Creative commons license. Readers are allowed to copy, distribute and communicate article's contents, provided the author's and Journal of Industrial Engineering and Management's